| title | tags | authors | affiliations | date | bibliography | |||||||||||||||||
|---|---|---|---|---|---|---|---|---|---|---|---|---|---|---|---|---|---|---|---|---|---|---|
Comet Time Series Visualizer: CometTS |
|
|
|
24 June 2019 |
paper.bib |
Comet Time Series (CometTS) is a software package and tool that enables workflows for the analysis and visualization of a time series of satellite imagery for the data science and geographic science communities. The tool aims to enable population estimation research, land use change detection, or natural disaster monitoring using a range of data types. CometTS calculates relevant statistical quantities (e.g., measures of central tendency and variation) and provides a visualization of their changes over time (Figure 1 and Figure 2). The package can help to serve as a rapid inspection workflow and analyze multiple regions of interest (ROI)'s in seconds.
The package builds upon previously introduced tools like TSTools [@Holden:2017], TIMESAT [@Jonsson_Eklundh:2004], and Satellite Image Time Series Analysis (SITS) [@e-sensing/sits:2018] to provide a partially automated approach for analyzing a time series of satellite images. CometTS adds new functionality to the overhead time series analysis and visualization domain in a few ways: Specifically, CometTS output includes user-specified statistics such as mean, median, and quartiles, across arbitrarily sized ROI's with polygon geometries. Furthermore, the option for anomaly detection is also included, and CometTS leverages an Auto-Regressive Integrated Moving Average (ARIMA) analysis to quantify trends and test if observations are significantly different from observed historical trends. The obligatory functionality of cloud and snow masking over any ROI is also included. Finally, CometTS is coded in Python, and removes the GIS requirement that is typical for such analyses.
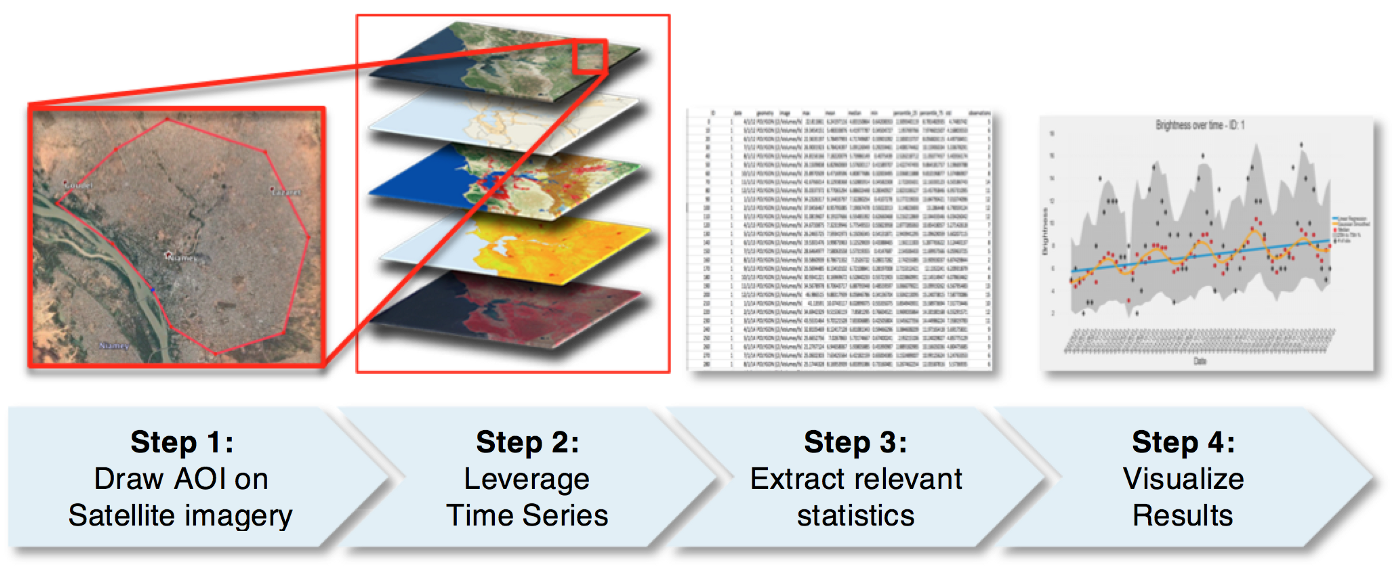 Fig. 1: A four step process to analyze and visualize trends in a time series of overhead imagery.
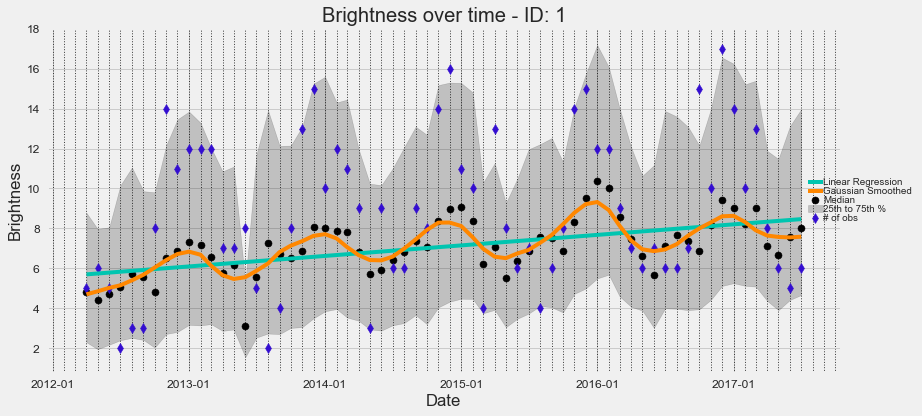 Fig. 2: An example output from
 CometTS showing variations in nighttime brightness in Niamey, Niger. These seasonal trends can be correlated to season migration patterns in the city.
Previously CometTS has been employed to monitor electrical and infrastructure recovery in Puerto Rico following Hurricane Maria [@Shermeyer_PR:2018]. For this study, the tool was used to extract the change in average nighttime brightness for all census tracts within Puerto Rico and to infer the number of persons without power over time. Using the ARIMA analysis functionality, an historical trend line was calculated to determine where brightness was expected to be if the hurricane had not hit. The difference between the actual observed brightness and the forecast brightness was then used to quantify electrical and infrastructure deficiencies and recovery over time. Multiple opportunities exist to employ CometTS for impactful work in the future including: (1) population dynamics; (2) land-use change; and (3) investigating seasonal or climatic conditions such as drought. Visualizations and analyses derived from CometTS in these topics can inform better understanding of changes to climate, poverty, food security, biodiversity, political conflict, and civil instability.
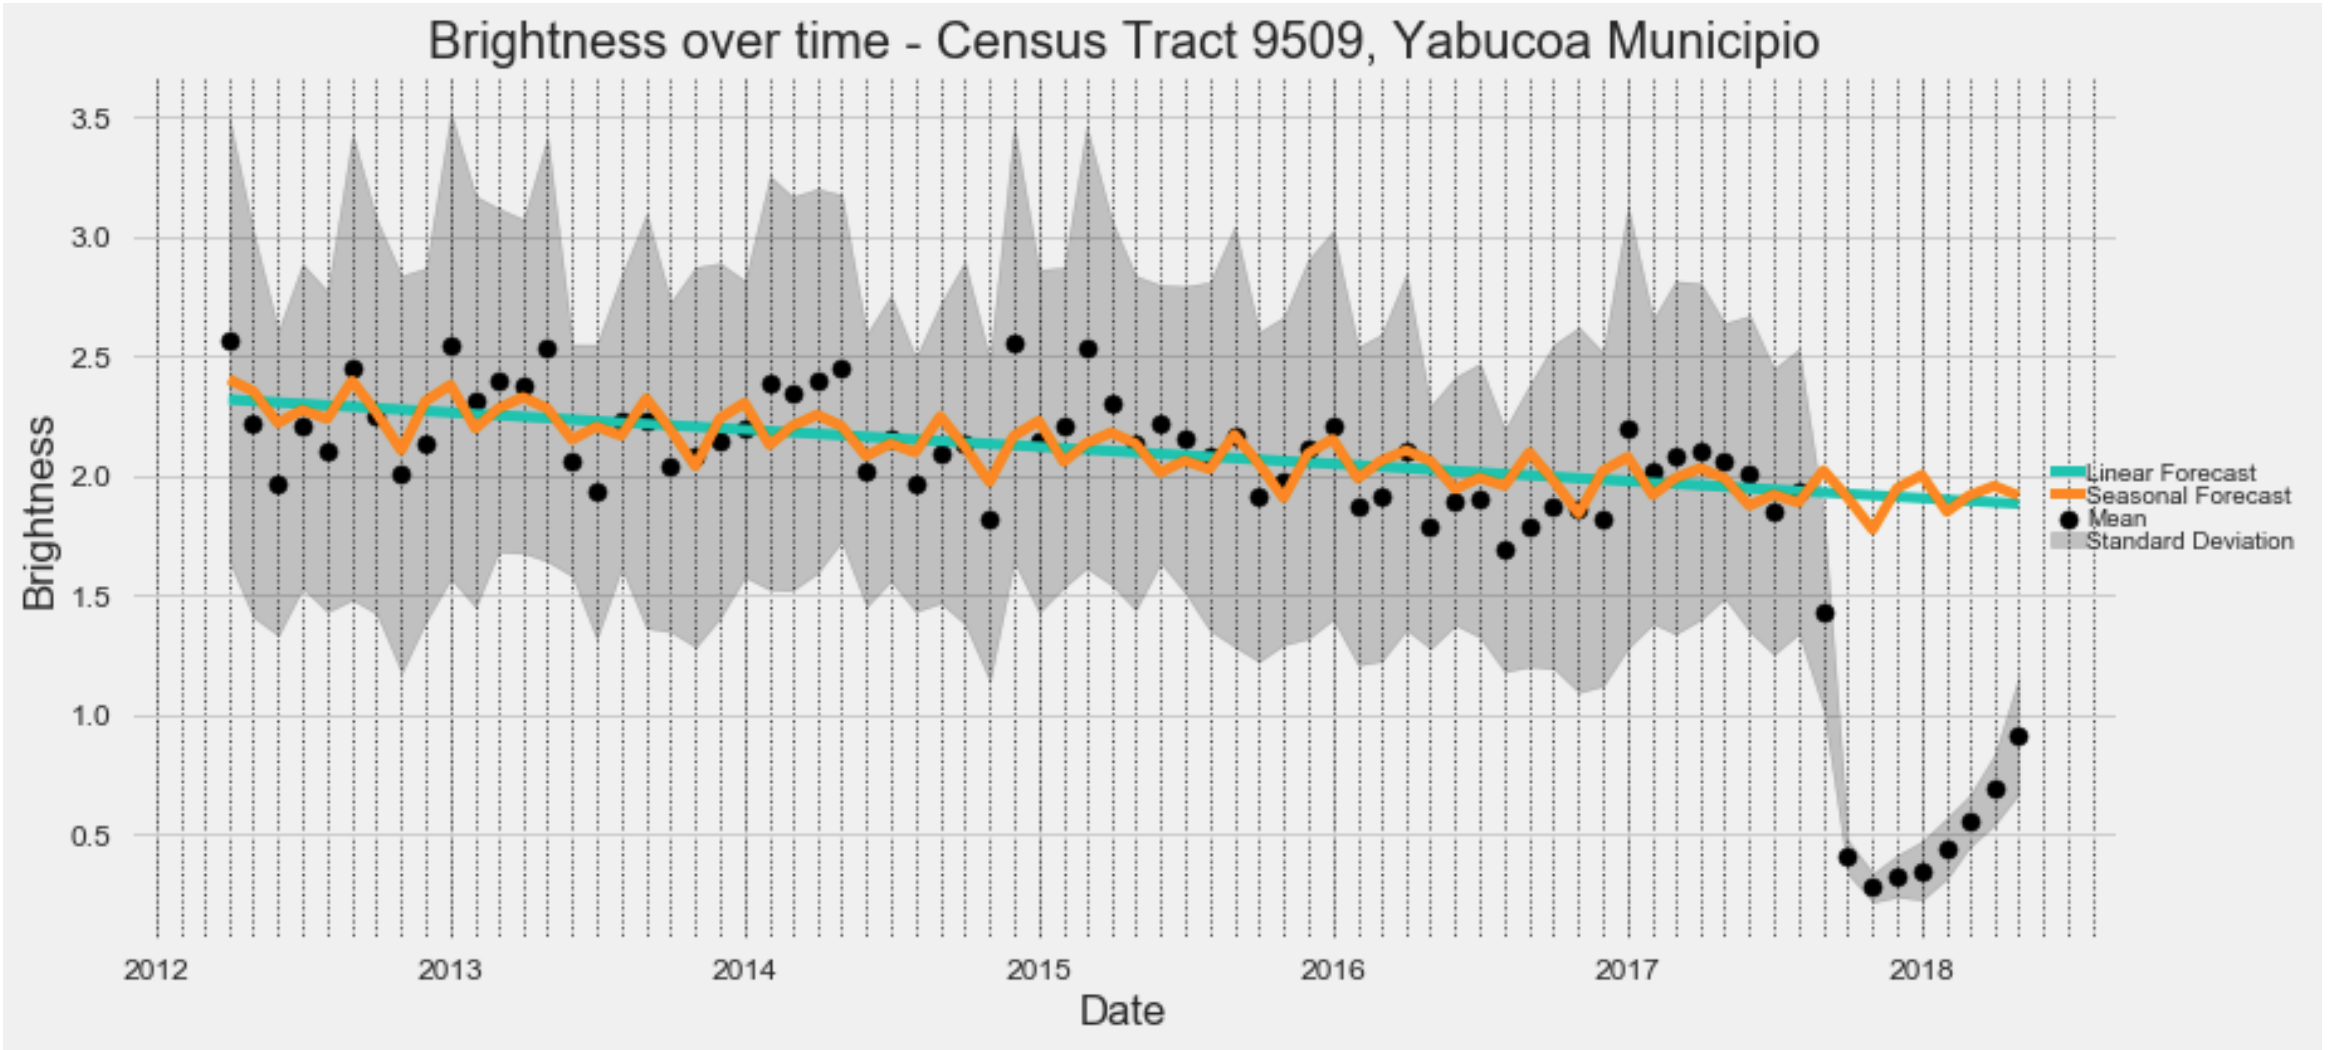 Fig. 3: A visualization of mean and one standard deviation of brightness over time in Census Tract 9509, in Yabucoa Municipio, Puerto Rico. The linear regression forecast, and seasonal adjusted forecast are plotted in teal and orange respectively. Differences of observed vs. expected brightness can be visualized and quantified.
We acknowledge contributions from Dylan George, Dave Lindenbaum, Ryan Lewis, Adam Van Etten, Nick Weir, Zig Hampel Arias, Rob Sare, & Jack McNelis.