-
Notifications
You must be signed in to change notification settings - Fork 9
EdgeH
See the charts and brief explanation of each metric below:
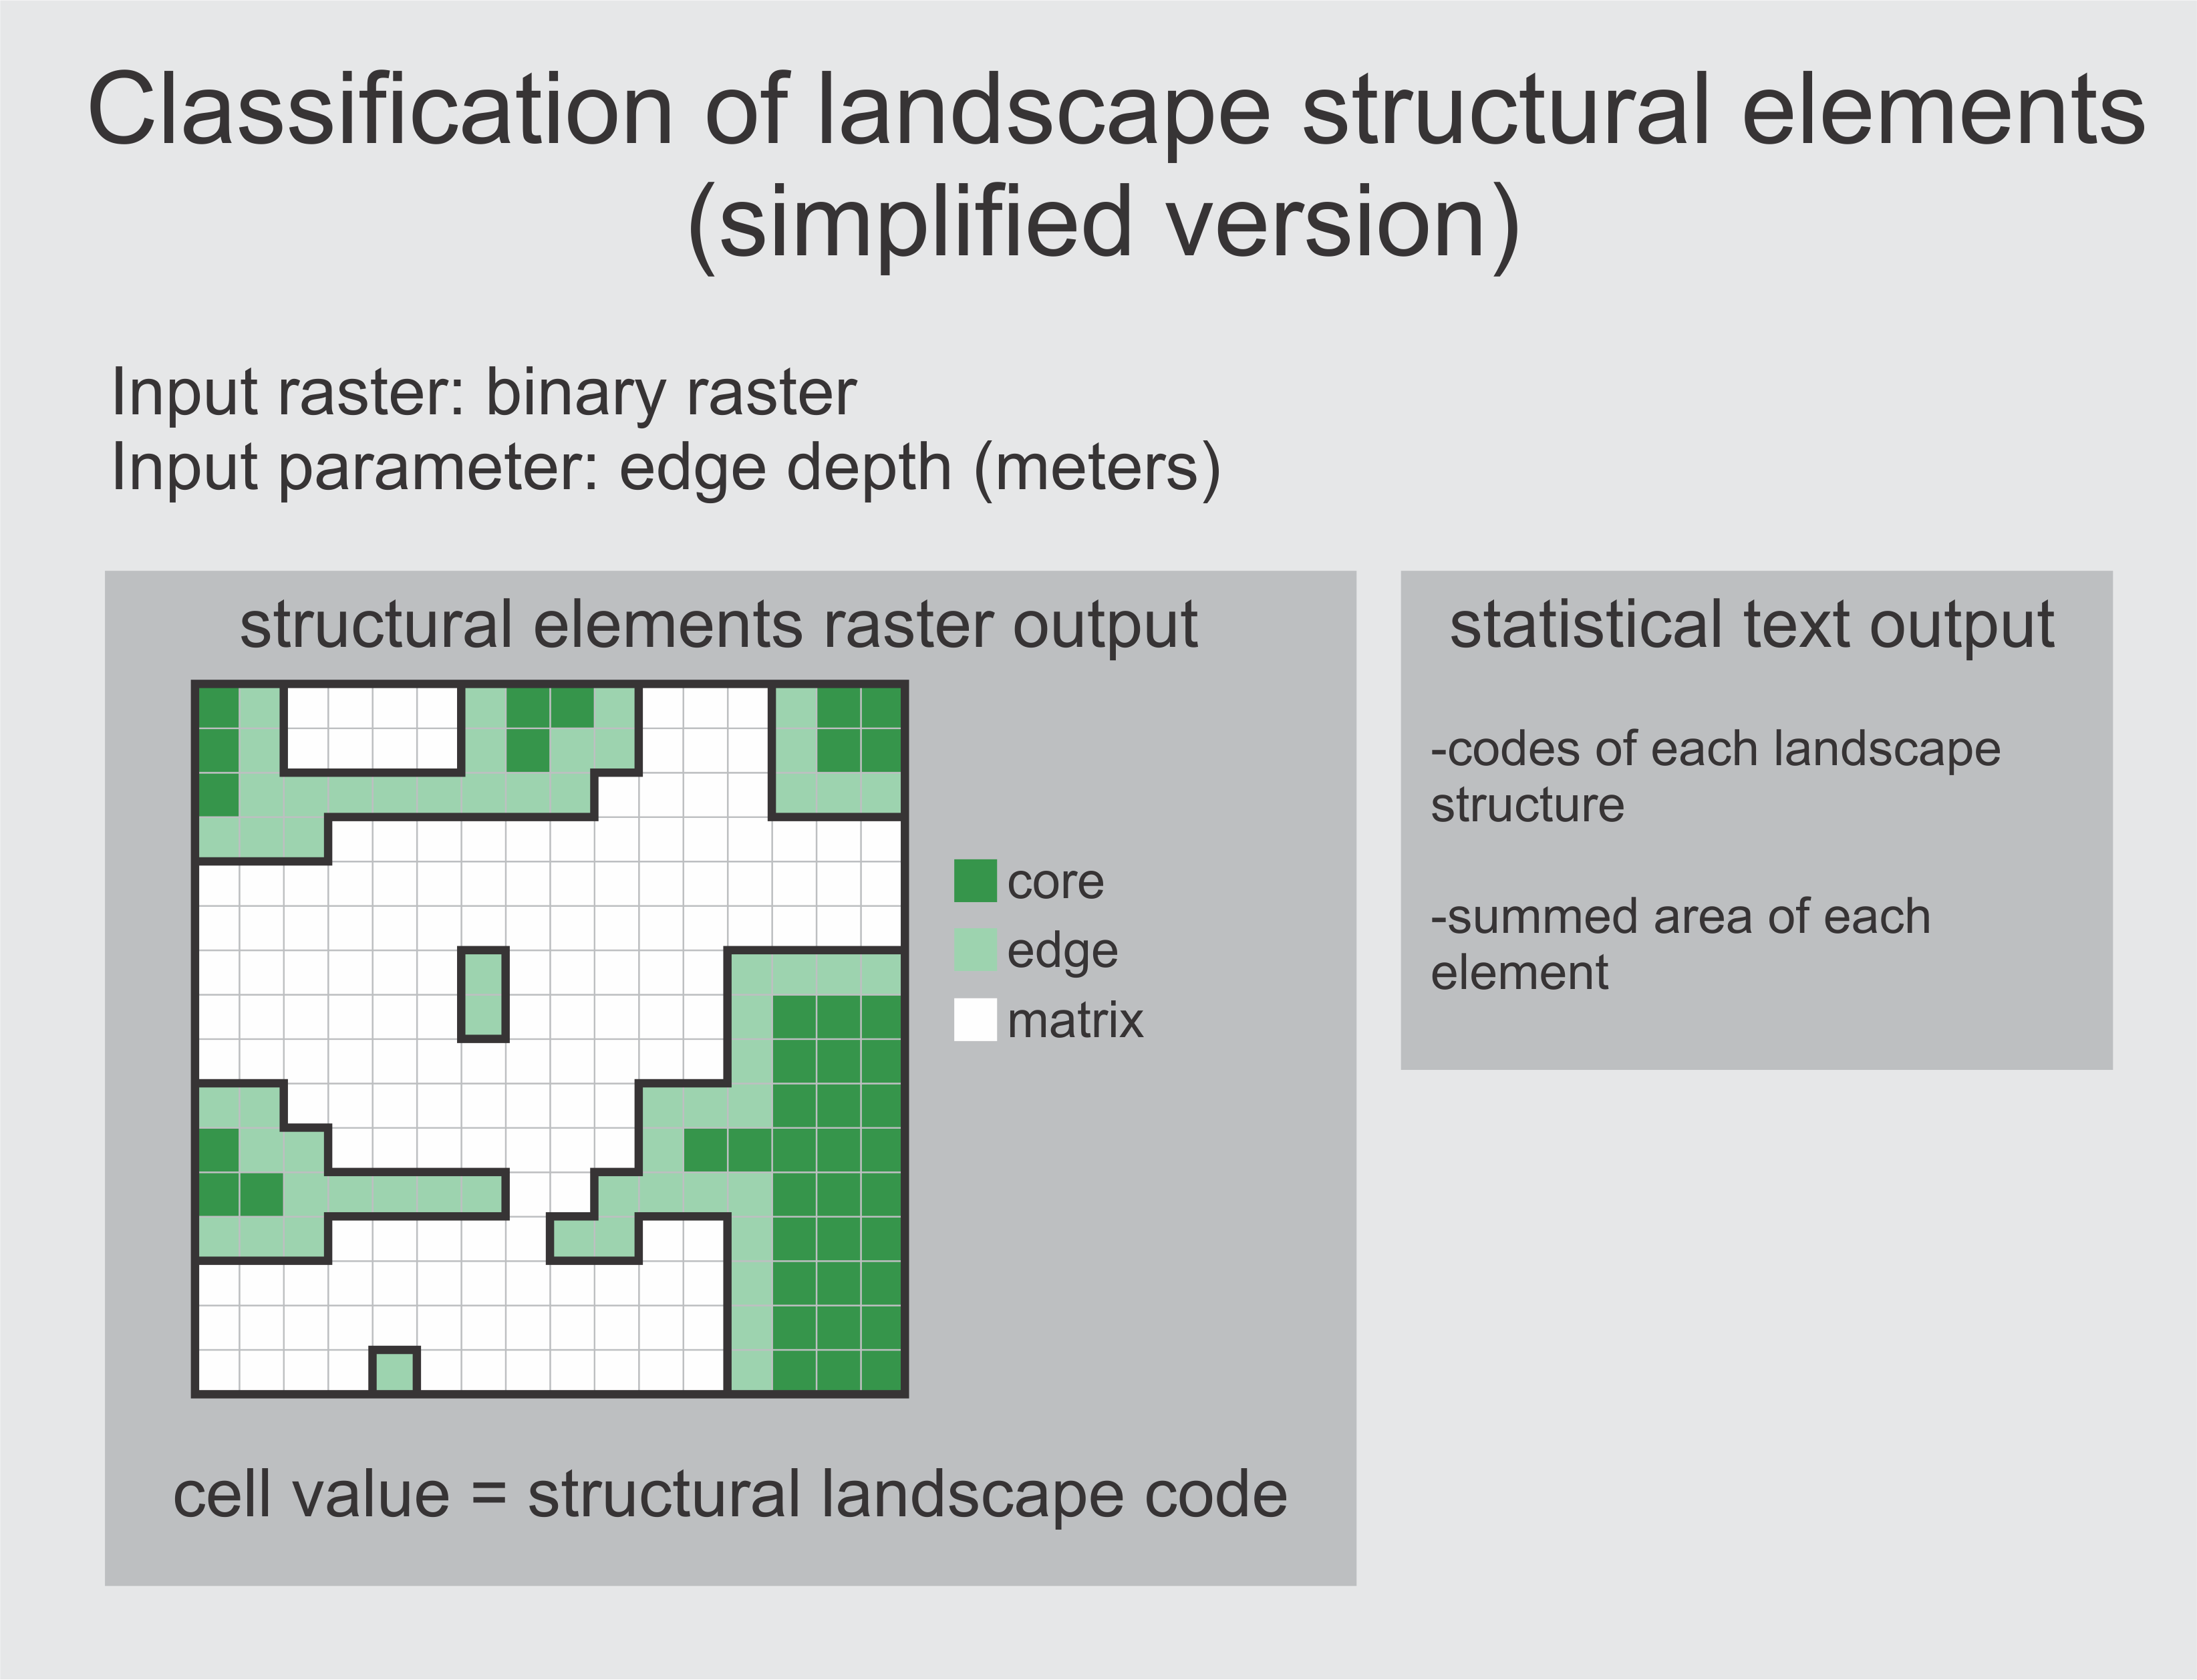
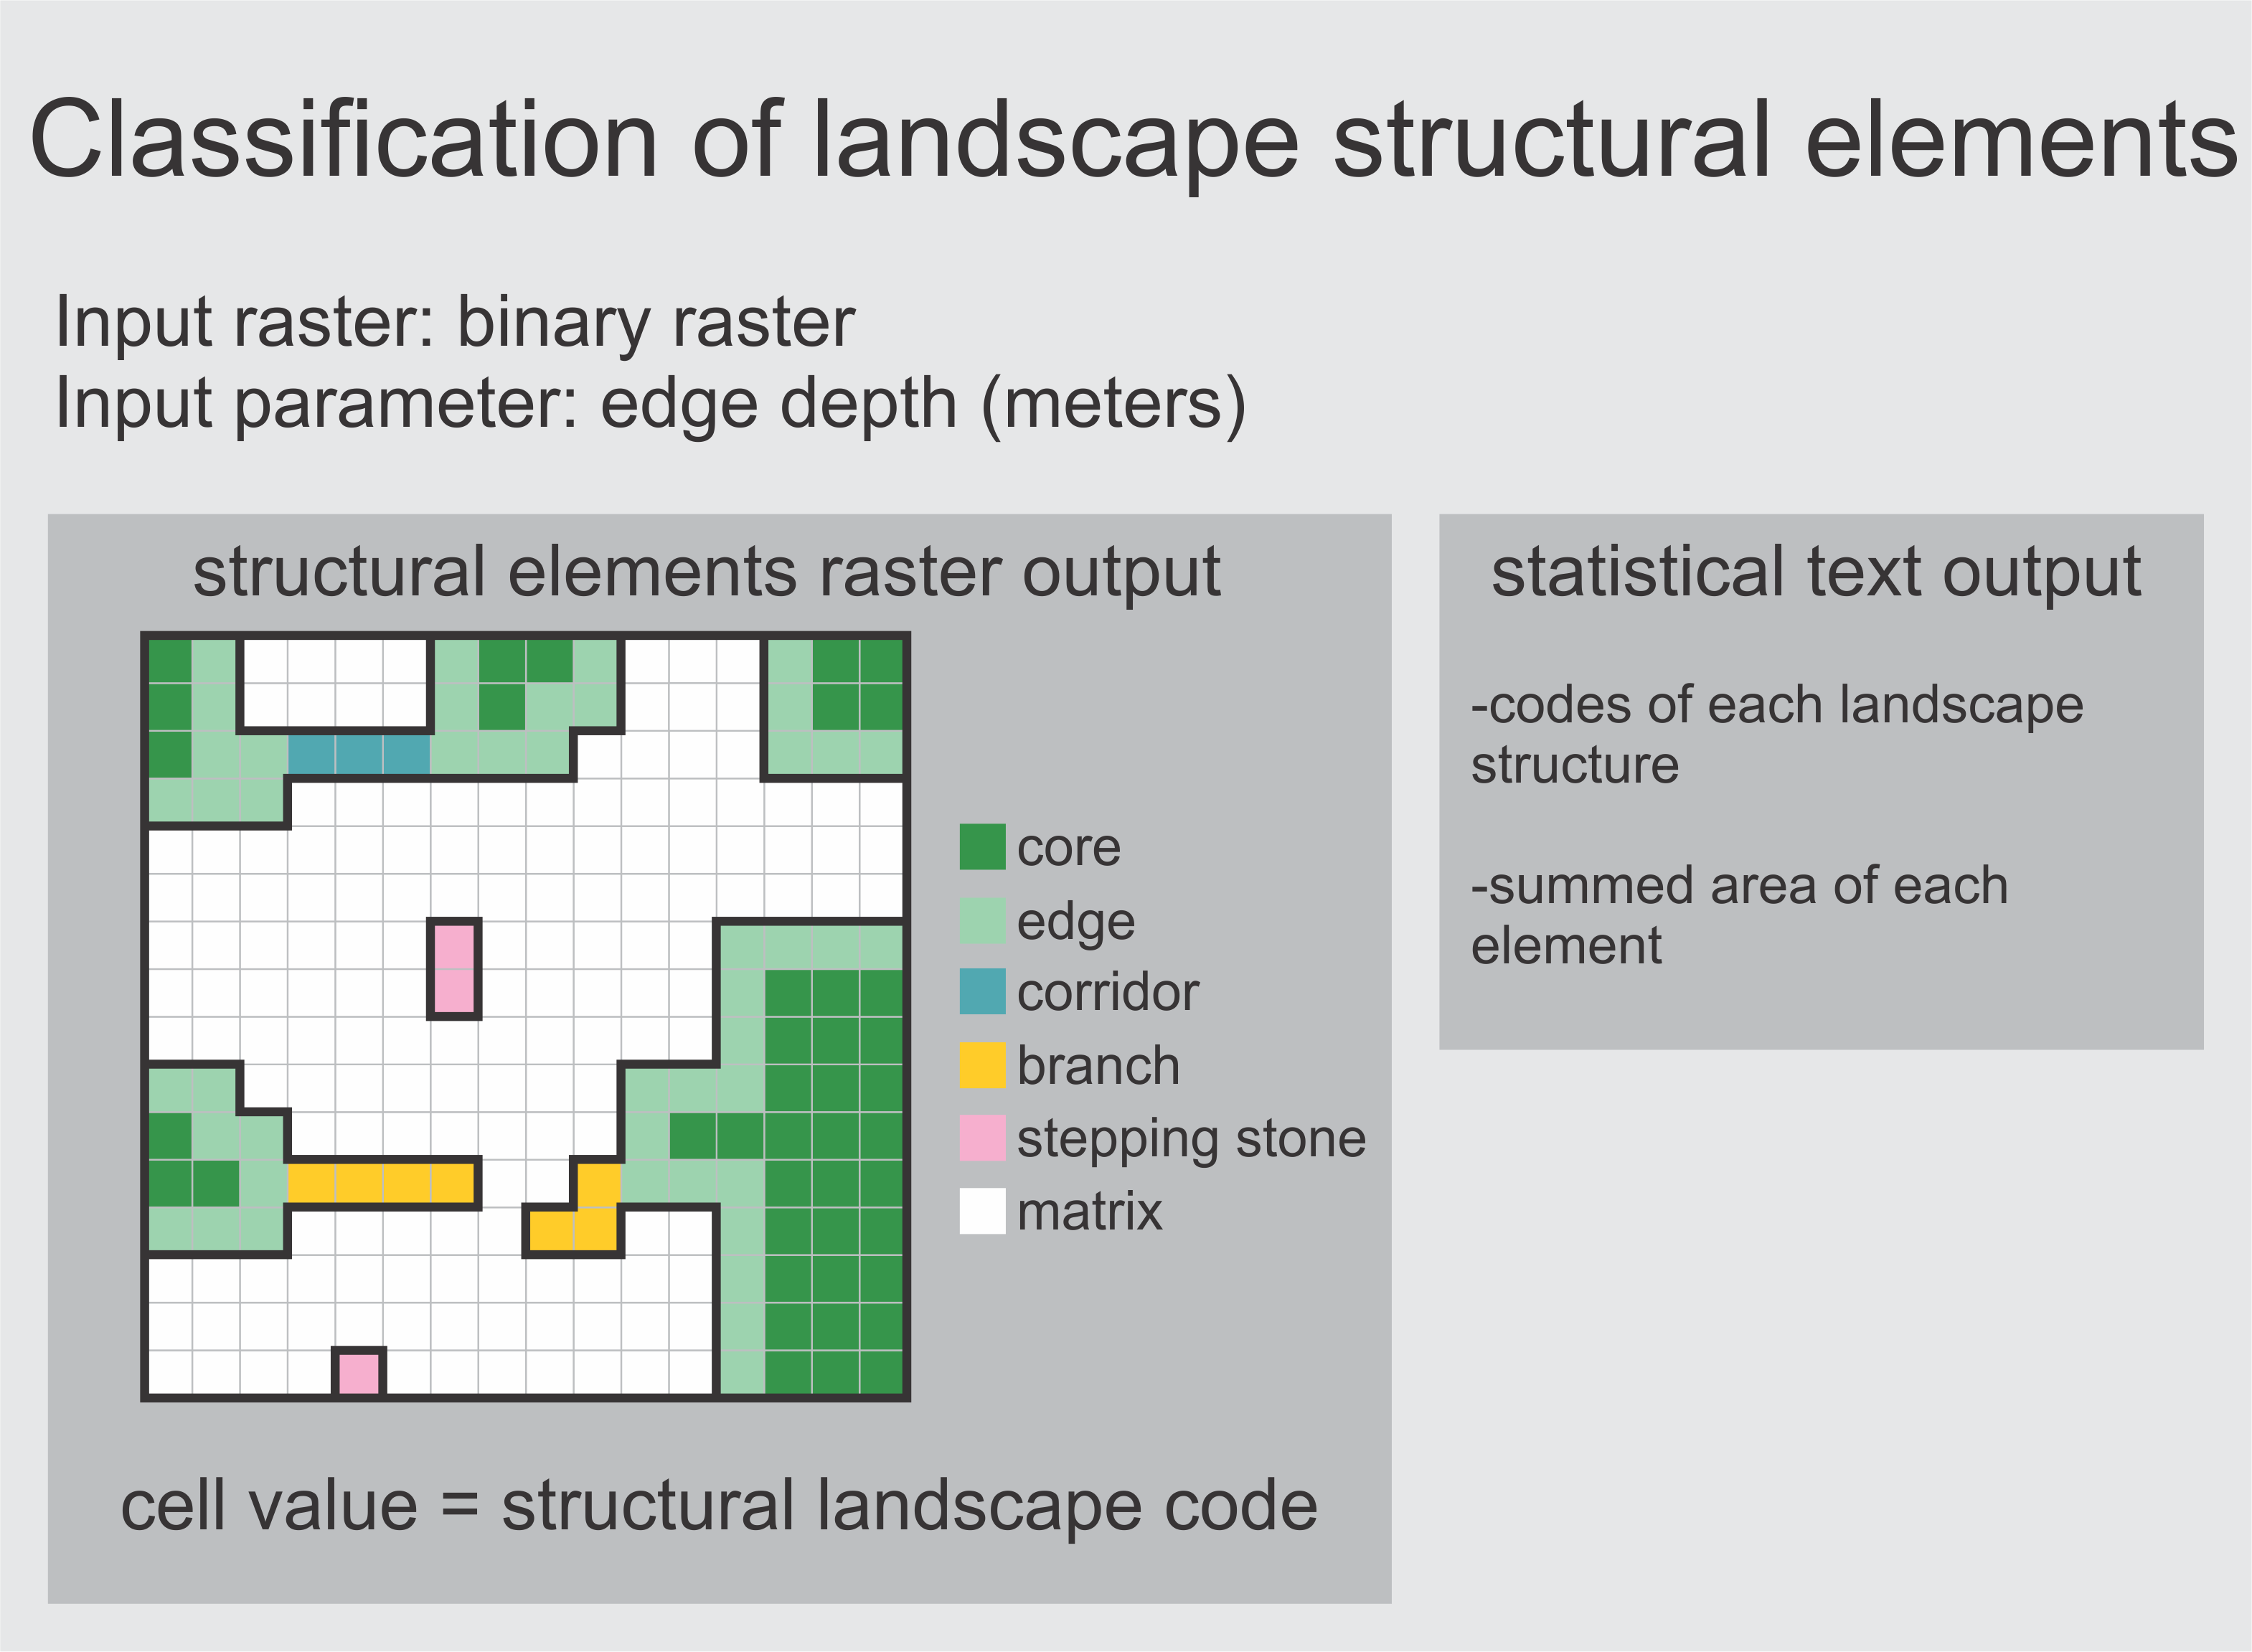
These metrics are classifications of landscape in three or more structural elements. The simple version of this metris divides elements in three categories: core, edge and matrix. The more complex version divides elements in: core, edge, corridor, branch, stepping stone and matrix (will be available soon). See below both versions:
The output value of each pixel will represent the distance of this pixel to the nearest edge.
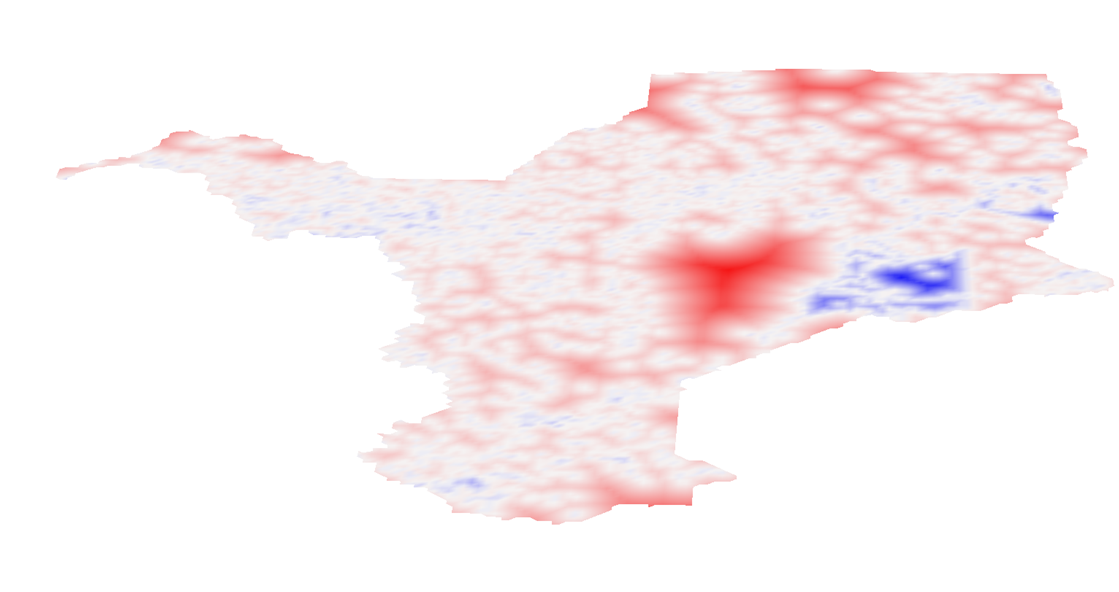
Considering a specified Edge depth, this metric classifies the pixels as belonging to three categories: edge, core and matrix. How species really use habitat area would be represented by the core area, since many species have limitations on using edges or less quality areas than their preferred habitat.
Percentage of habitat and edge within a search radius (Window size parameter), given a specified edge depth (Edge depths parameter).
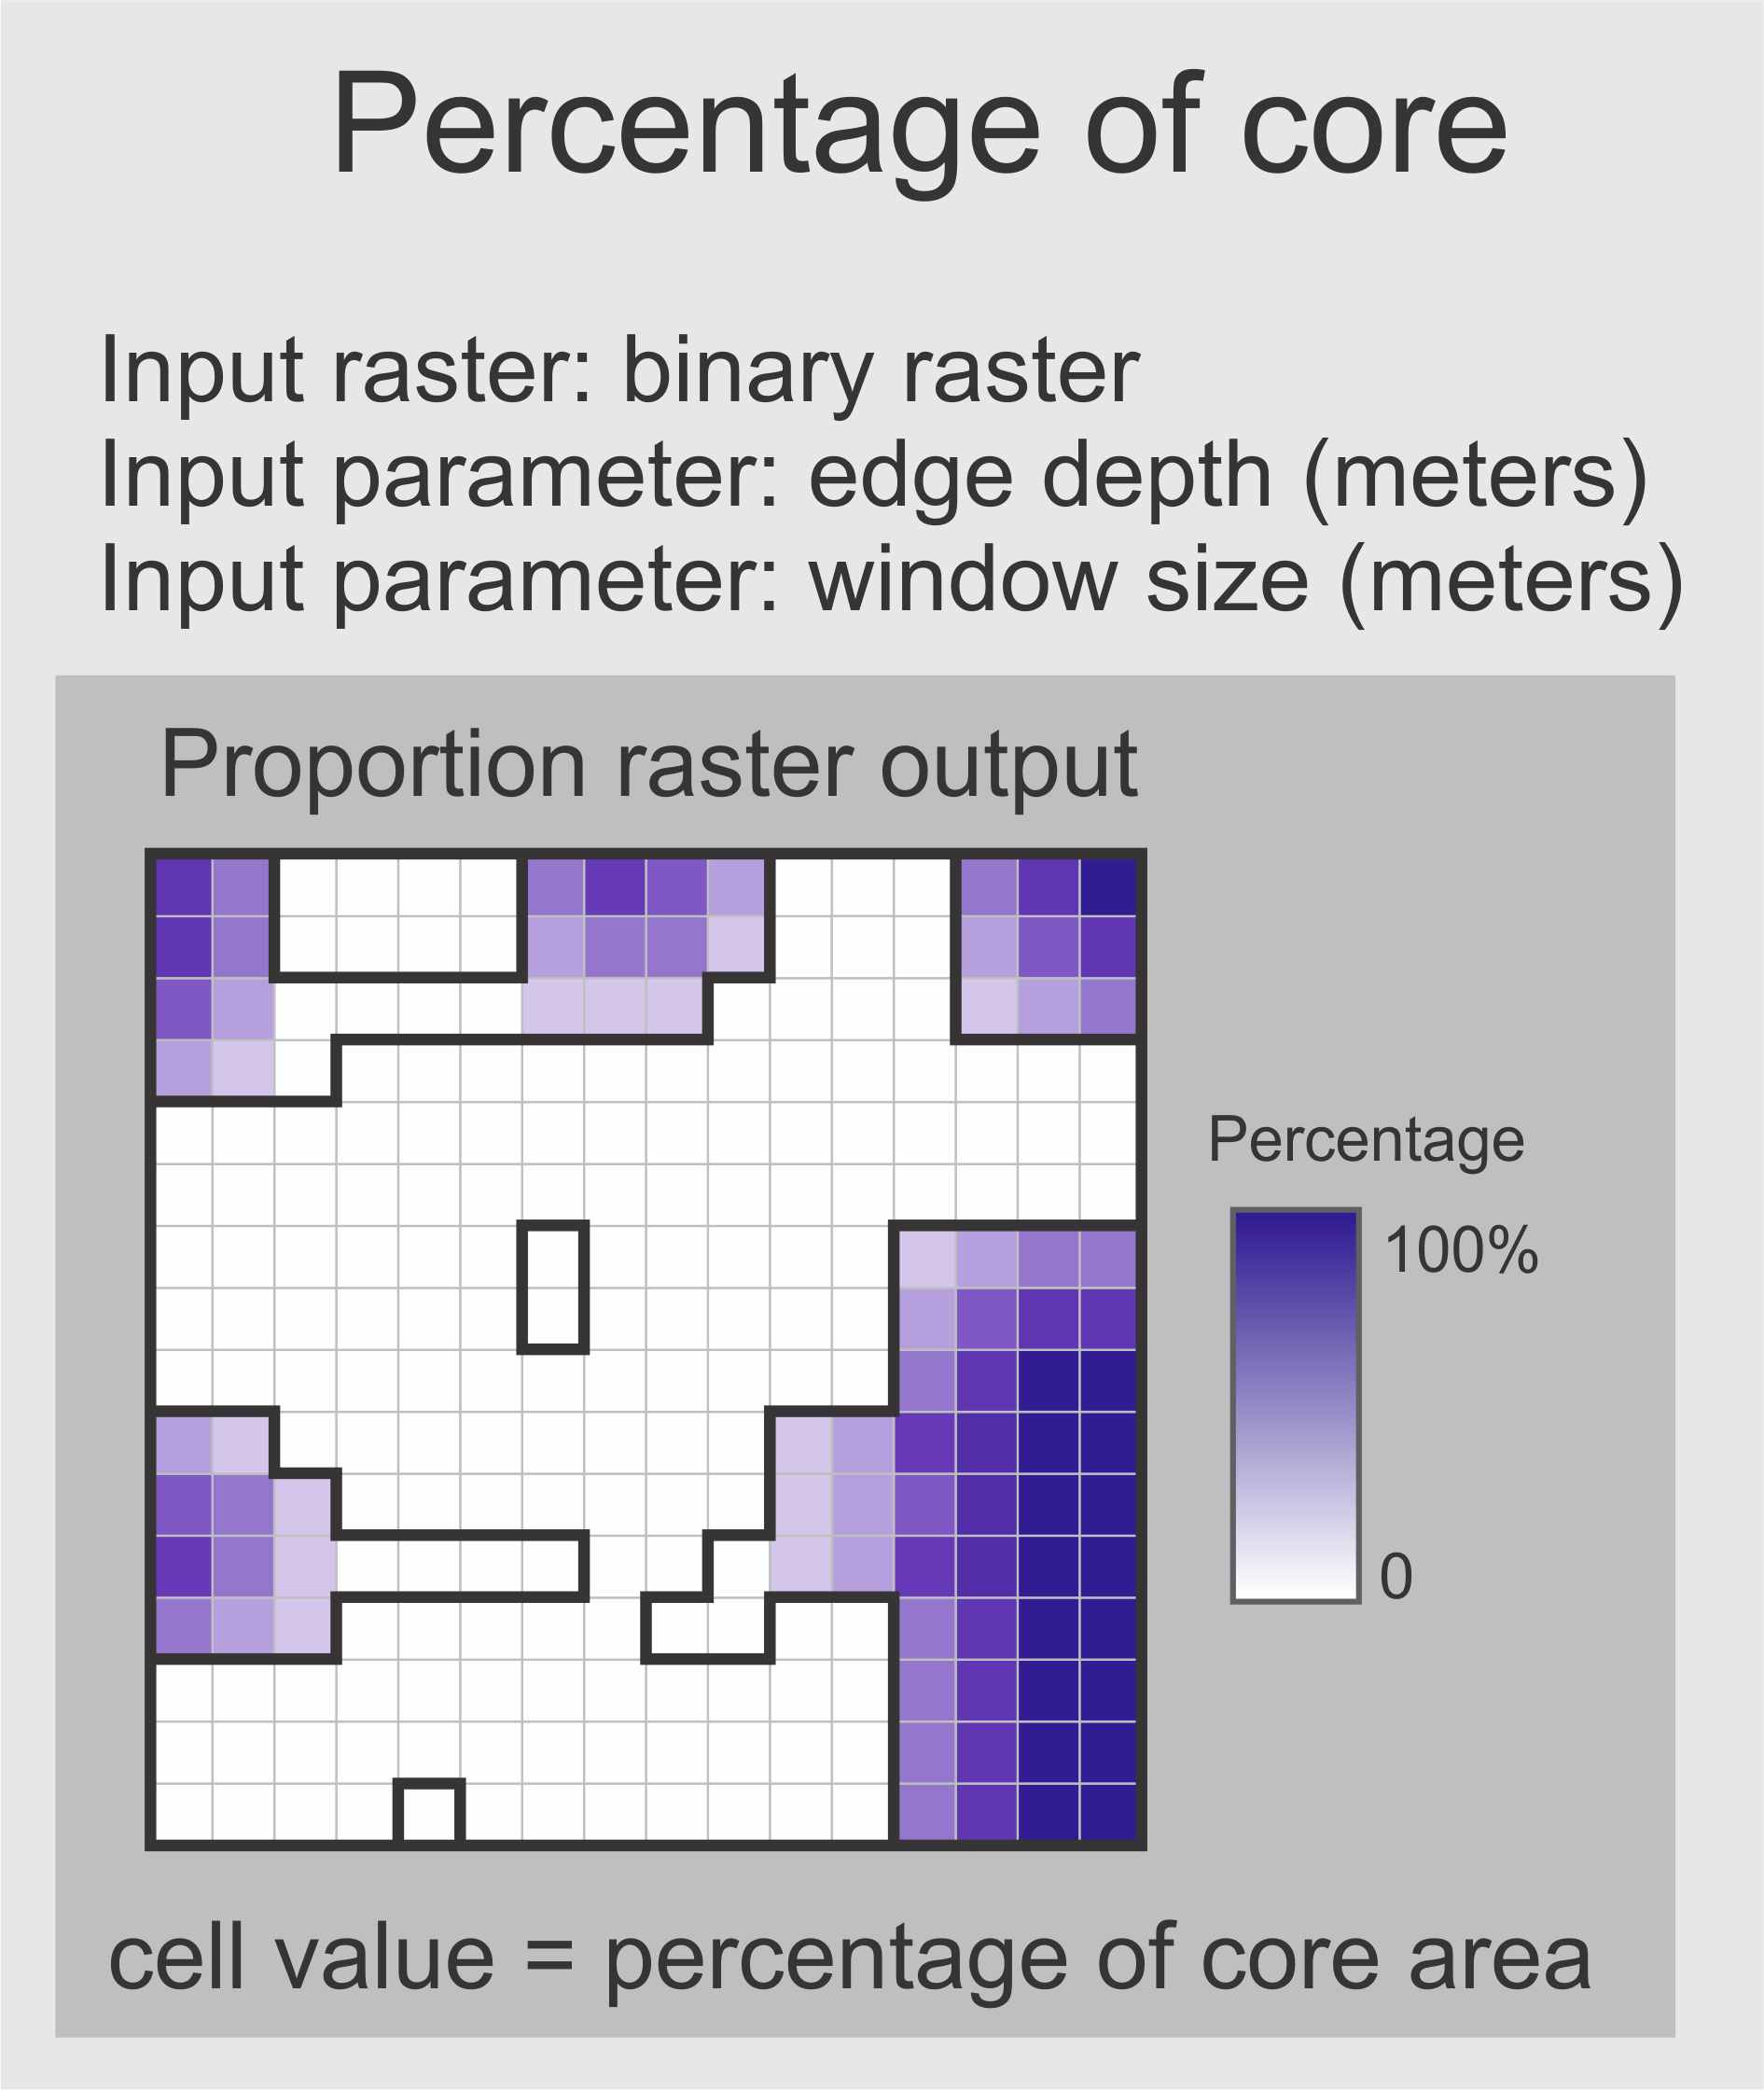
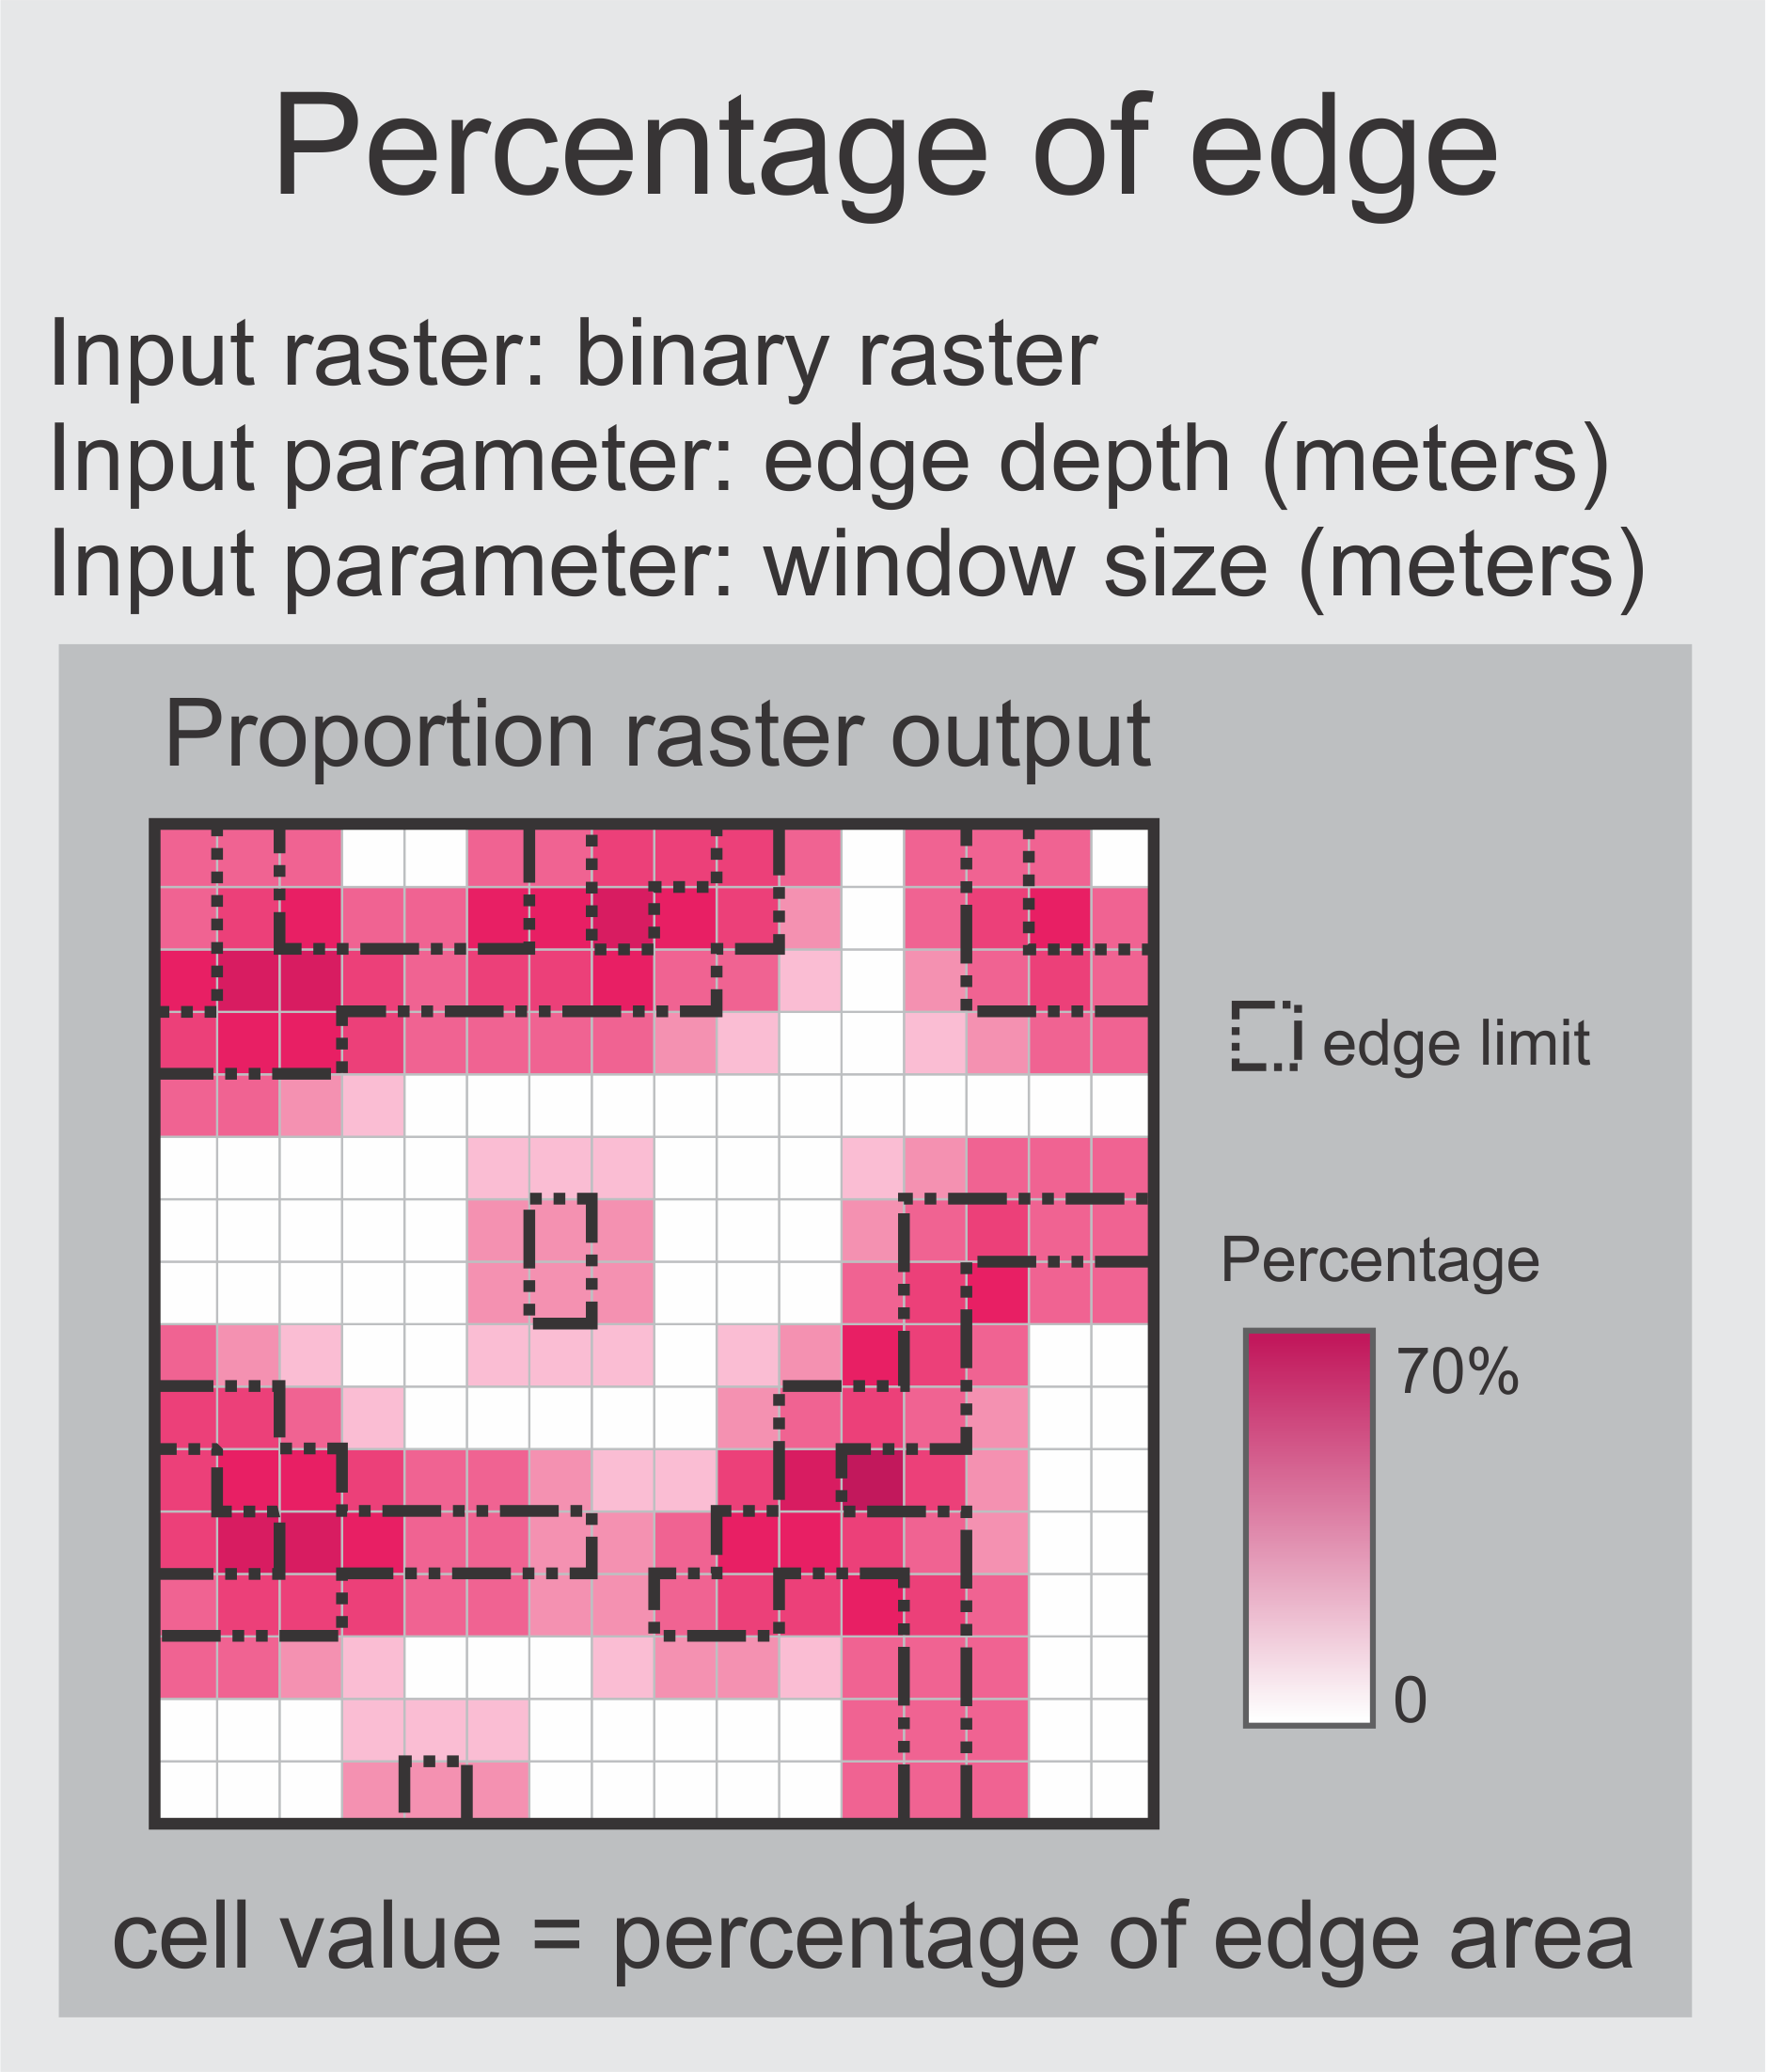
This parameter is a proxy for investigating the impact of edge influence on the different pixels. It estimates the distance of edge influence and should be carefully thought a priori by the user, since it will be used to calculate the output metrics. It is set in meters, and as larger the value, larger the edge influence and extent through landscape.
(Achei difícil reduzir essa explicação)
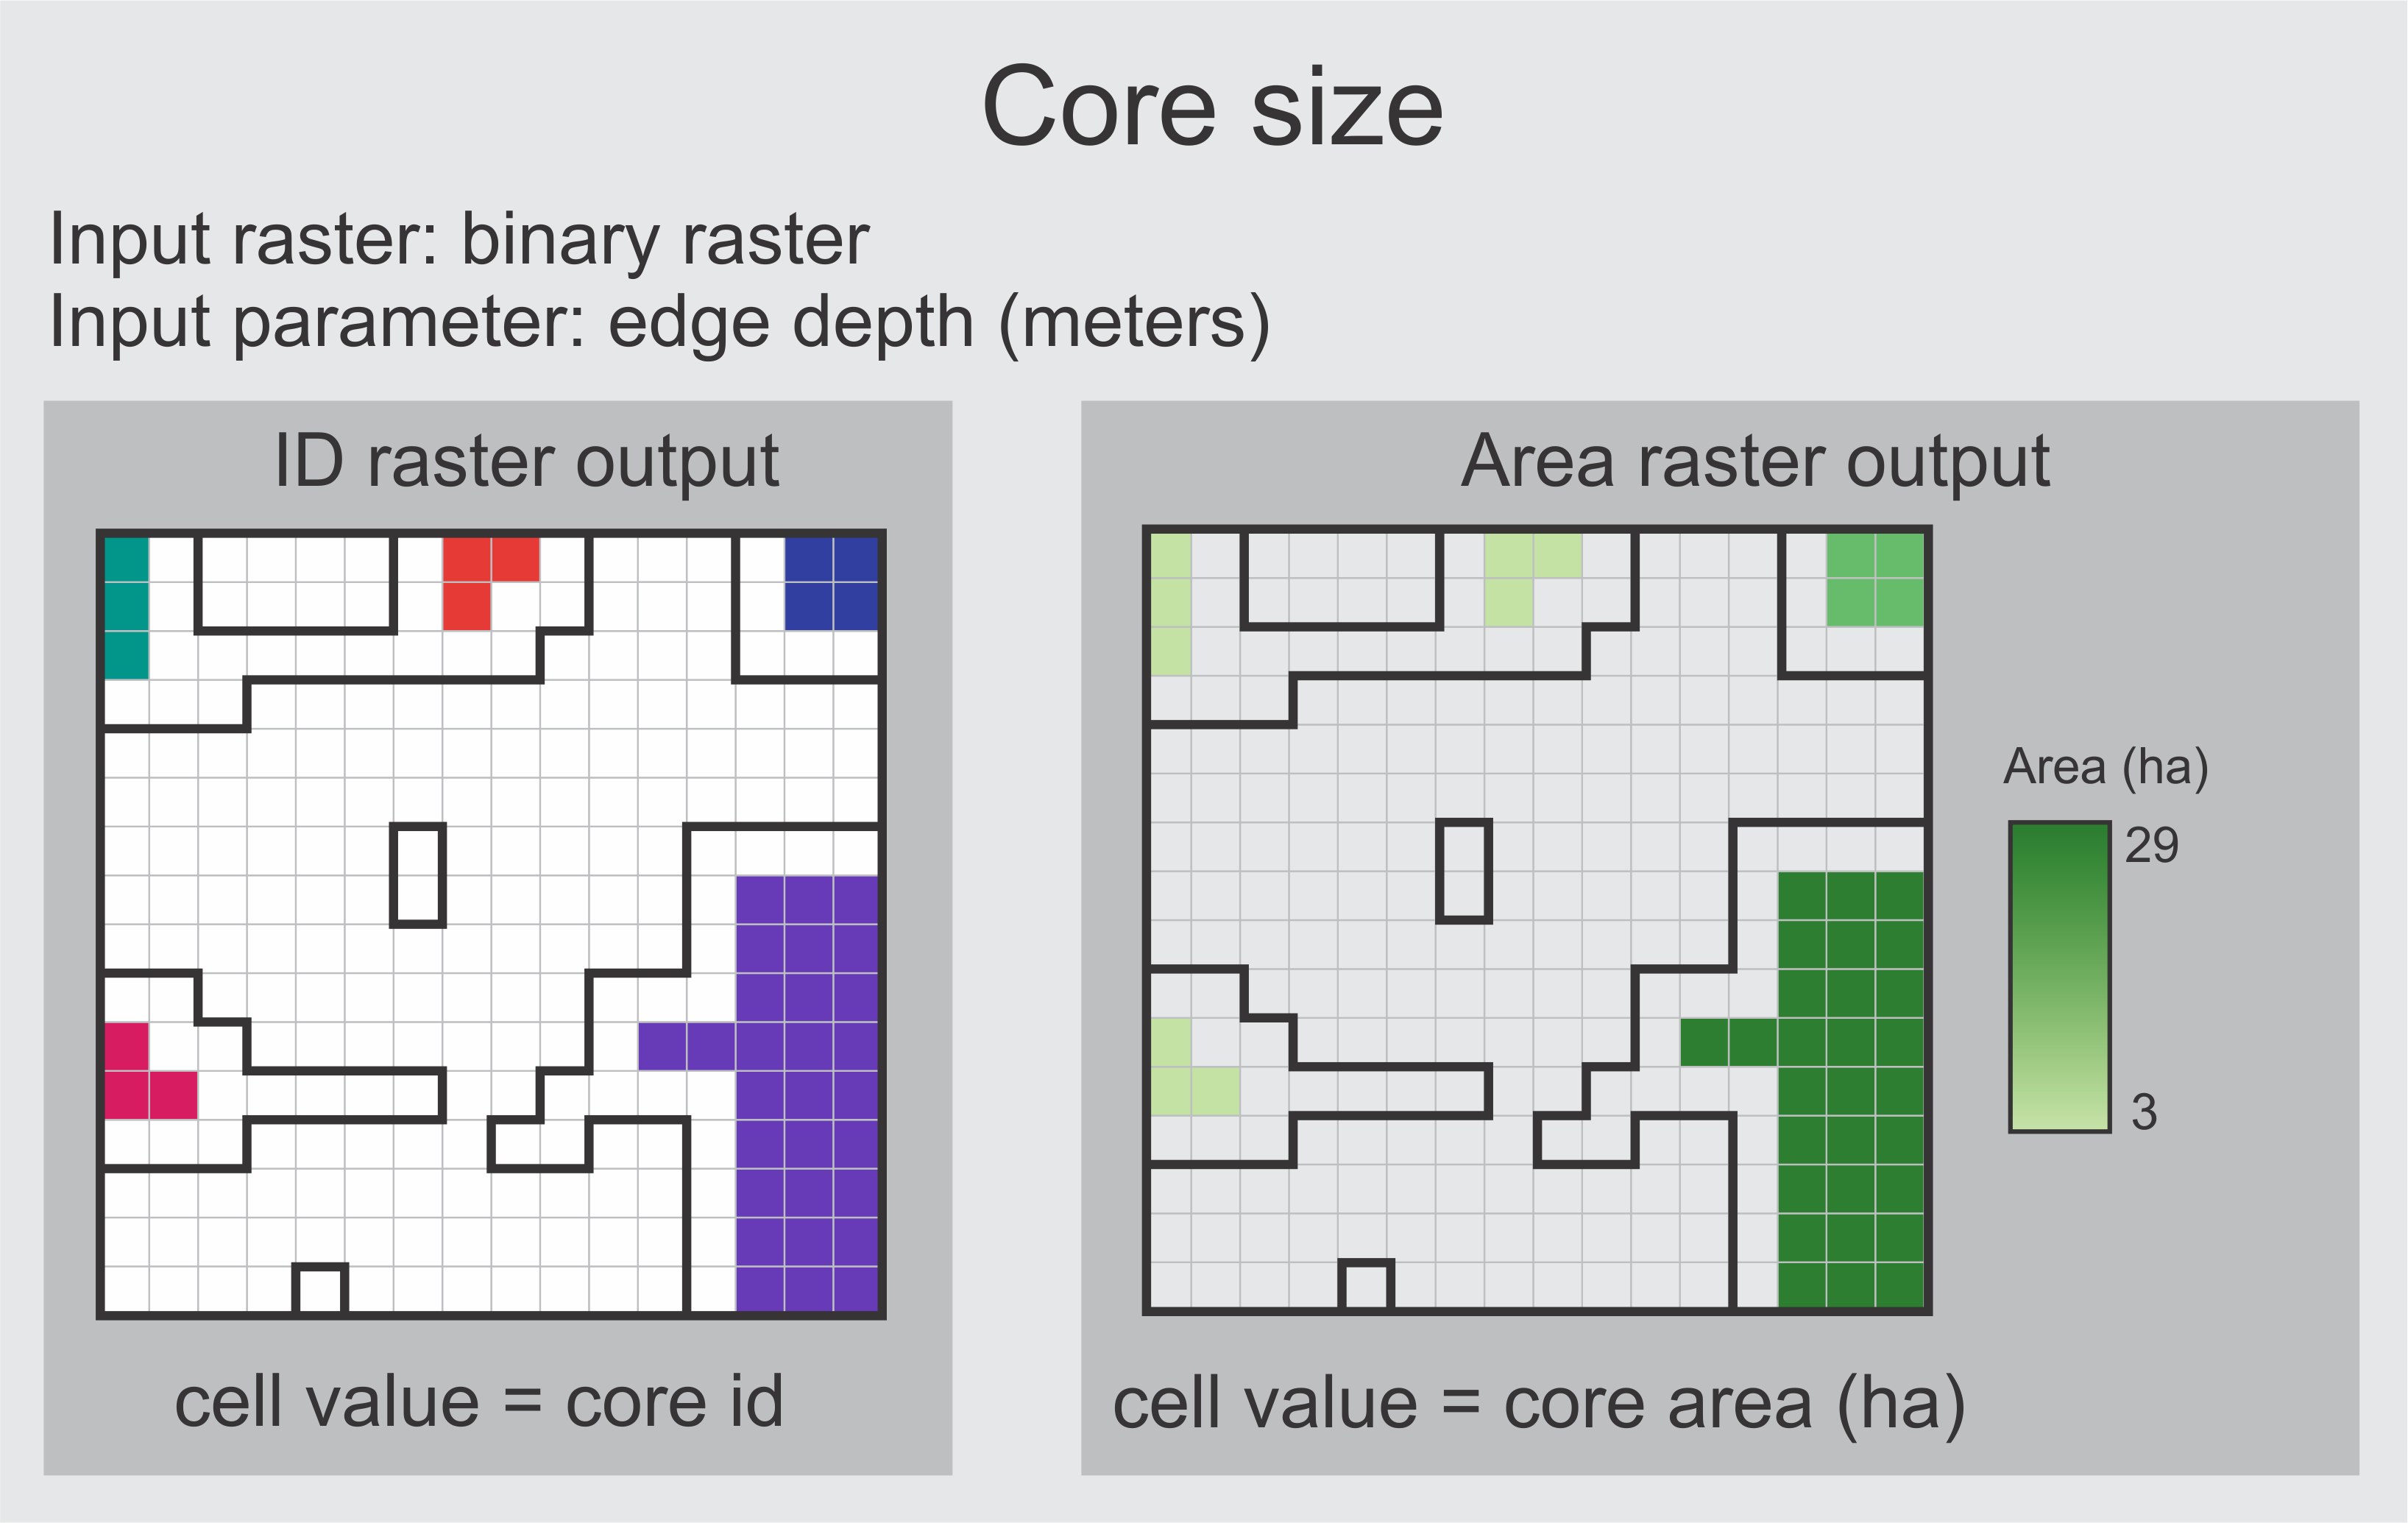
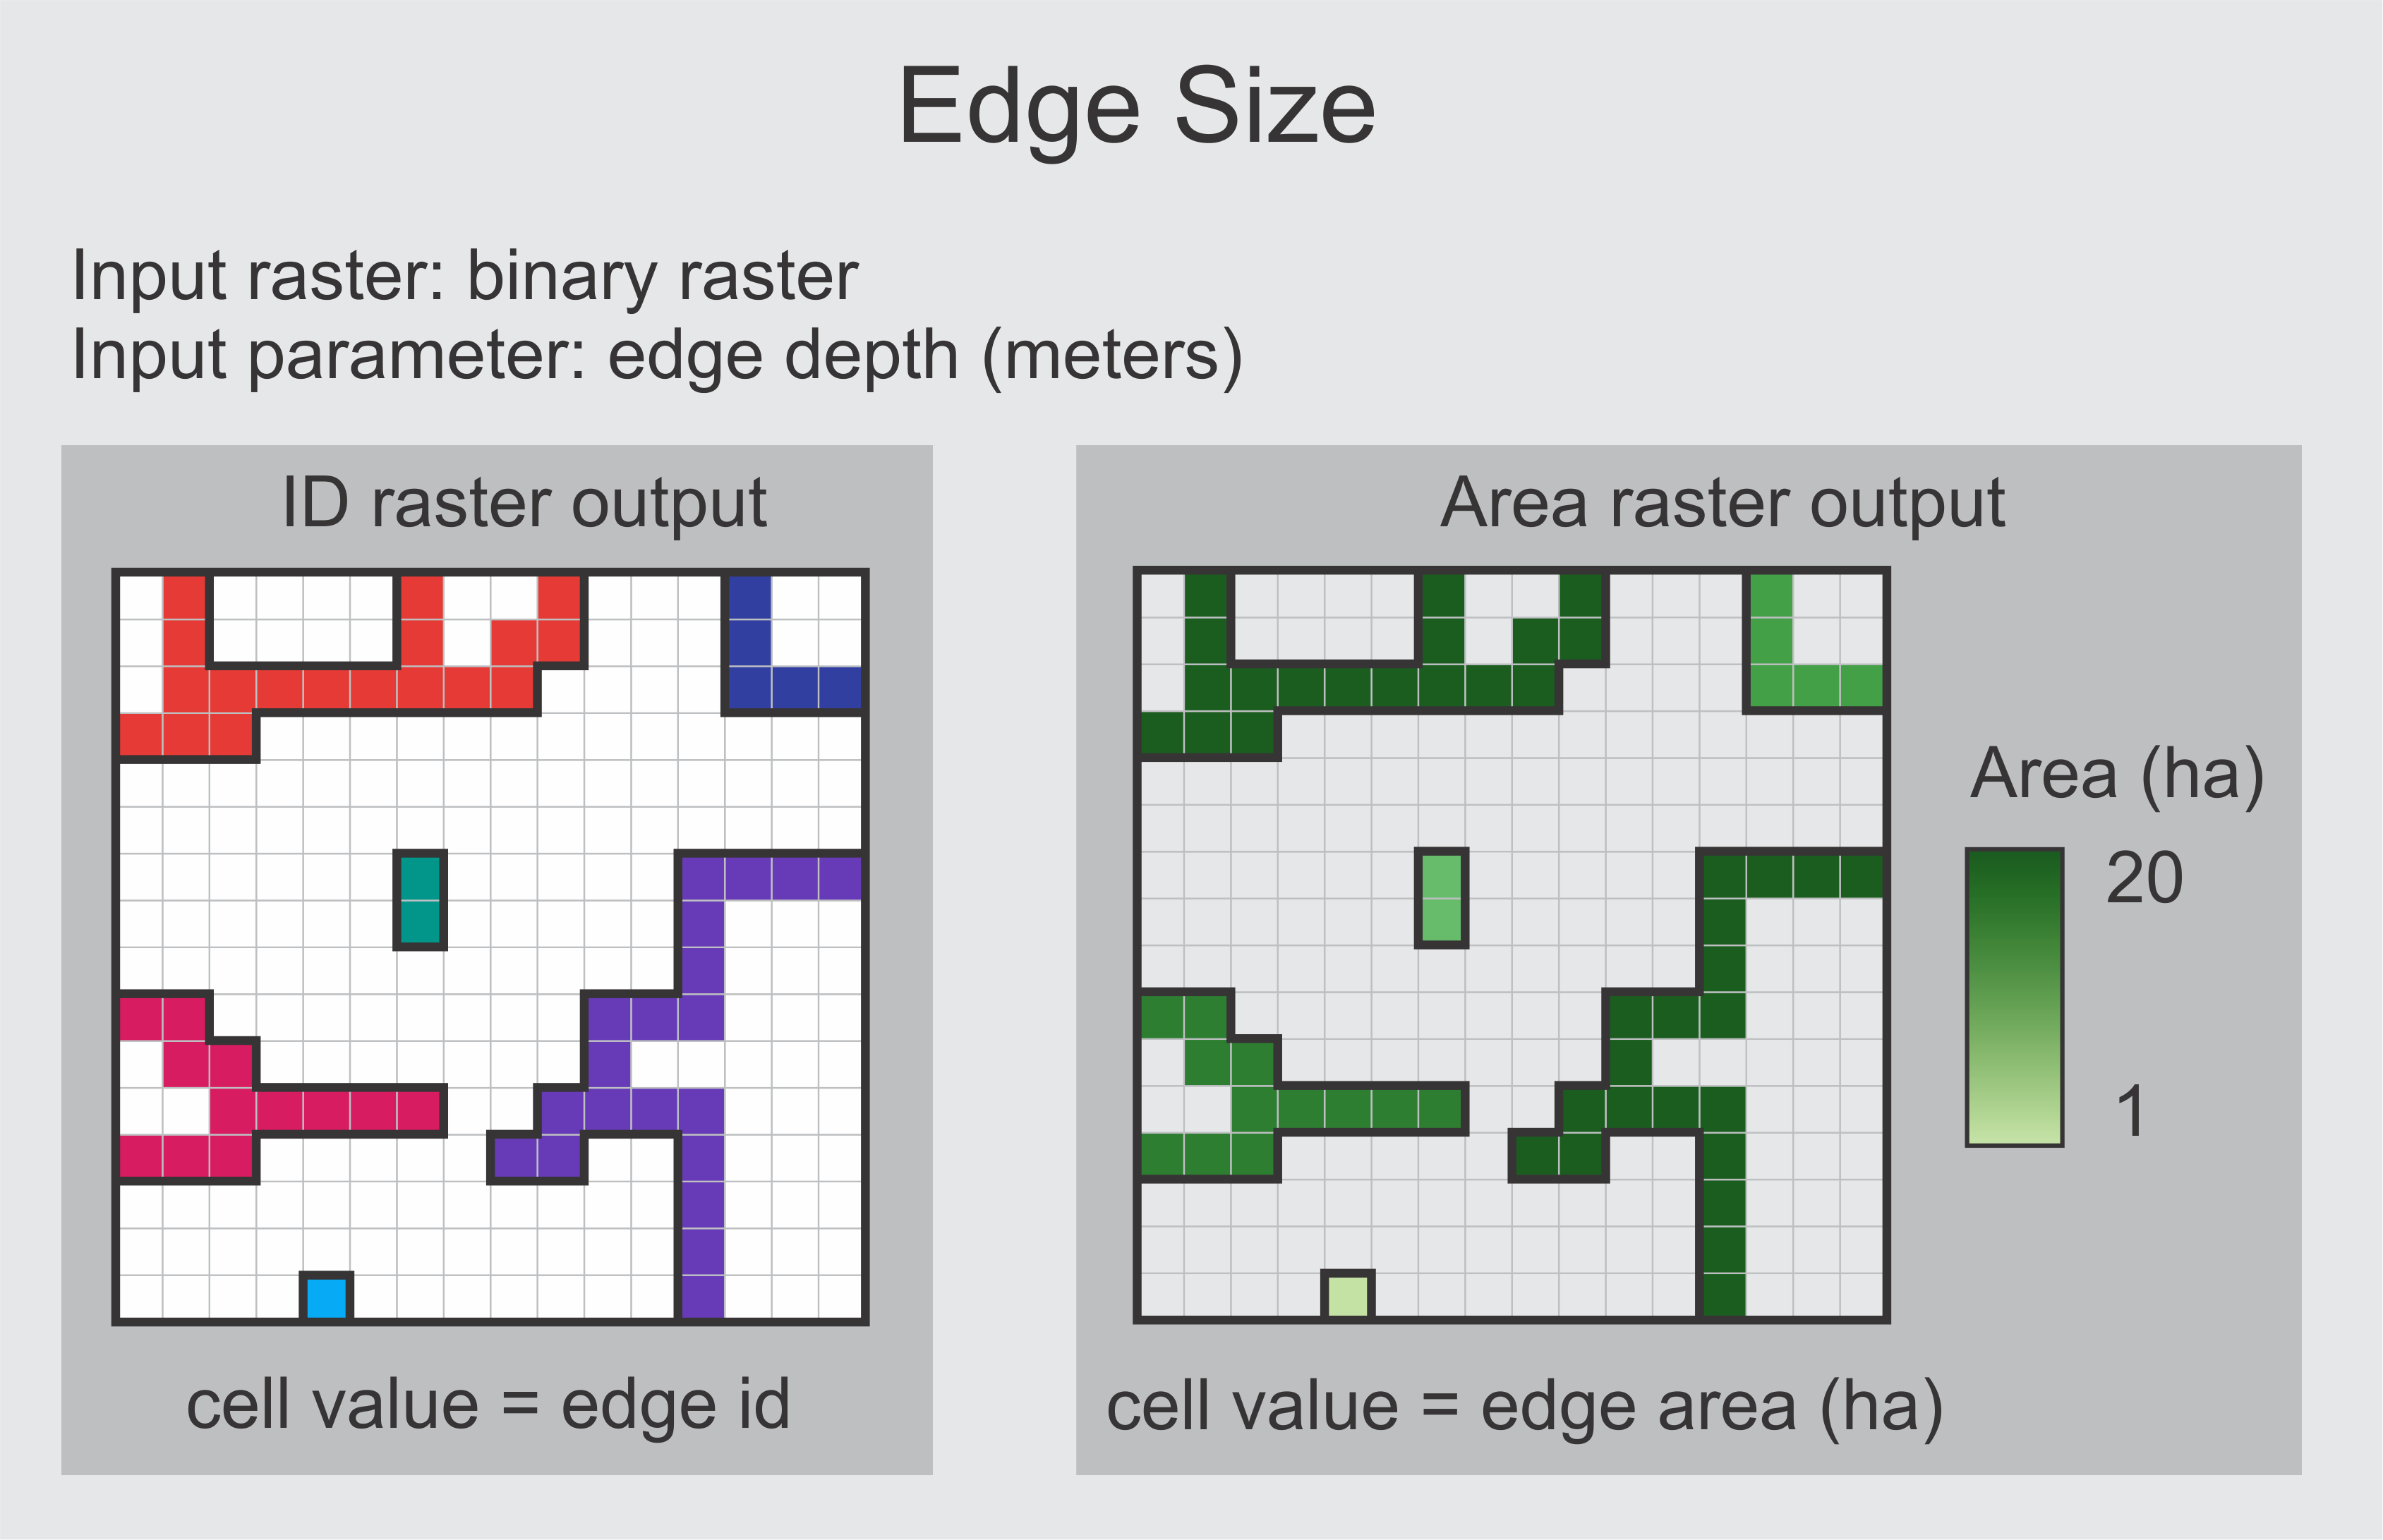
Given edge and core areas were identified, contiguous cells are clumped into edge and core clumps (i.e., cells of edge and core that pertain to the same patch), and their areas are calculated (in hectares). Two maps are created for each one (edge/core) for each landscape: an edge (core) clump ID (edge or core PID) map, which sets a distinct integer number to each clump of edge (core) cells, and a clump size map, which sets the the area of those clumps; non-edge (non-core) cells are set to NULL in both.
