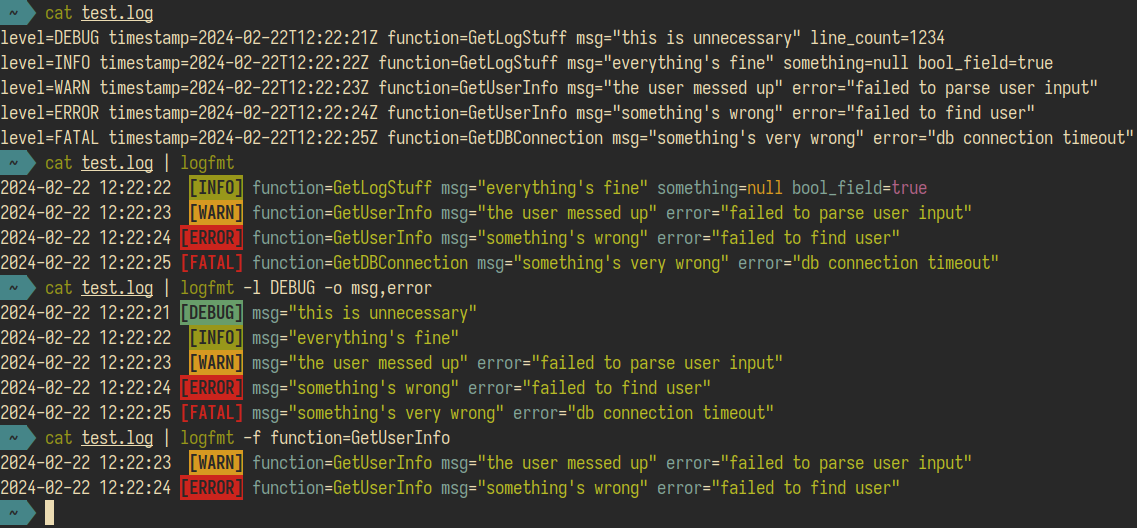
This is a (very) simple CLI tool to make reading and parsing logfmt logs from your terminal easier. It supports colorized output, output field selection, and log level and key value filtering.
logfmt is a basic structured logging format that uses key=value pairs. It is
most popular in go apps, due to its simplicity, and ease of reading and parsing. However, printing logfmt
formatted logs to the terminal and trying to find what you are looking for can be difficult, especially when there's a
lot of debug keys like source, function, caller, etc. The fact that its all white on black (or black on white if
you hate your retinas) doesn't help either.
The goal of this tool is to make these logs more readable by applying some syntax highlighting, separating the
timestamp and level fields into static locations without their keys, filtering based on log level, picking specific
output columns, and filtering based on specific key=value pairs (say you're looking only for a specific API call).
I recommend adding a GOBIN env var to your shell with a location to where you want go compiled programs to reside
and adding that location to your PATH. With that set up, you can install logfmt using:
go install github.com/TheEdgeOfRage/logfmt
Usage:
  logfmt [OPTIONS]

Application Options:
  -l, --level=       Log level filter. One of DEBUG, INFO, WARN, ERROR, FATAL (default: INFO)
  -o, --output=      Output field selector (comma separated)
  -e, --exclude=     Exclude field selector (comma separated)
  -f, --filter=      Filter fields (key=value comma separated)
  -n, --no-color     Disable color output
  -c, --force-color  Force color output, even when outputting to a pipe

Help Options:
  -h, --help         Show this help message
If installed in your PATH, you can just run the logfmt program without any arguments and it will start reading log
lines from stdin and write the formatted lines to stdout.
This CLI follows the UNIX philosophy, so it will only read from stdin and write to stdout. If you want stderr or a different file, use your shell's built-in directives for that.
A typical usecase would be running a service for local development, or fetching the logs from a Kubernetes pod:
go run yourservice.go | logfmt
kubectl logs -n namespace pod | logfmt
To filters your logs based on the log level, you can pass the -l flag with a log level in CAPS format. The level you
provide is lowest level that will get printed, so if you set it to WARN, only WARN, ERROR, and FATAL logs will
show up.
You can pass in a comma separated list of fields to the -o flag that you want it to print to the output. The timestamp
and level are always printed, so this only applies to additional fields.
If you want to exclude some fields from the output, you can pass in a comma separated list of fields to the -e flag.
This can be useful in cases where you don't know what fields are going to be present in the logs, but want to exclude
some verbose ones.
If you want to only select records that have a specific value on a key, you can pass one or more comma separated filters
to the -f flag in the key=value format. Only log lines that match all the filters exactly will be printed. Regex or
numerical filtering might come in the future.
If you don't want to have colors on the output, set -n.
By default, logfmt will detect if the output is a pipe or redirect to a file and will automatically disable colors. If
you still want to have colorized output, for example when piping into less, you can force it using -c.
