Today, we're going to use a new tool, Atom, to read, write and run our code! It's a lot like using a Jupyter notebook, but our product will be a script that we can run in Terminal or anywhere else. Atom also works with other coding languages, like R and C++, which is really neat.
-
Download Atom here
- Once you have downloaded it, search for it in Finder. Drag it into your Applications folder.
-
Go to the Settings tab, then to Featured Packages, and install Hydrogen. This is an interactive code editor that allows us to run snippets of our code right in our editor.
-
Quit Atom. Open your Terminal, and type these lines:
conda install ipykernel
python -m ipykernel install --user -
Open up Atom again. You should be ready to rock and roll! Find the script we were working on two weeks ago, called netCDF_script_yourinitials.py, and drag it into Atom.
-
Let's play around with Atom! You can run individual lines by clicking on them and pressing
shiftandenterat the same time. You should see a little check mark next to the line if it has run successfully. Try writing a print statement and running that -- where does the output show up? -
In the .py file you have opened, there is an absolute path. Find it, and replace it with the absolute path to the "Bermuda_data_SLA.nc" file. (This is the file you downloaded on Tuesday -- you may have Slacked me the absolute path). This is our data for our project, and we'll be working with it for now on.
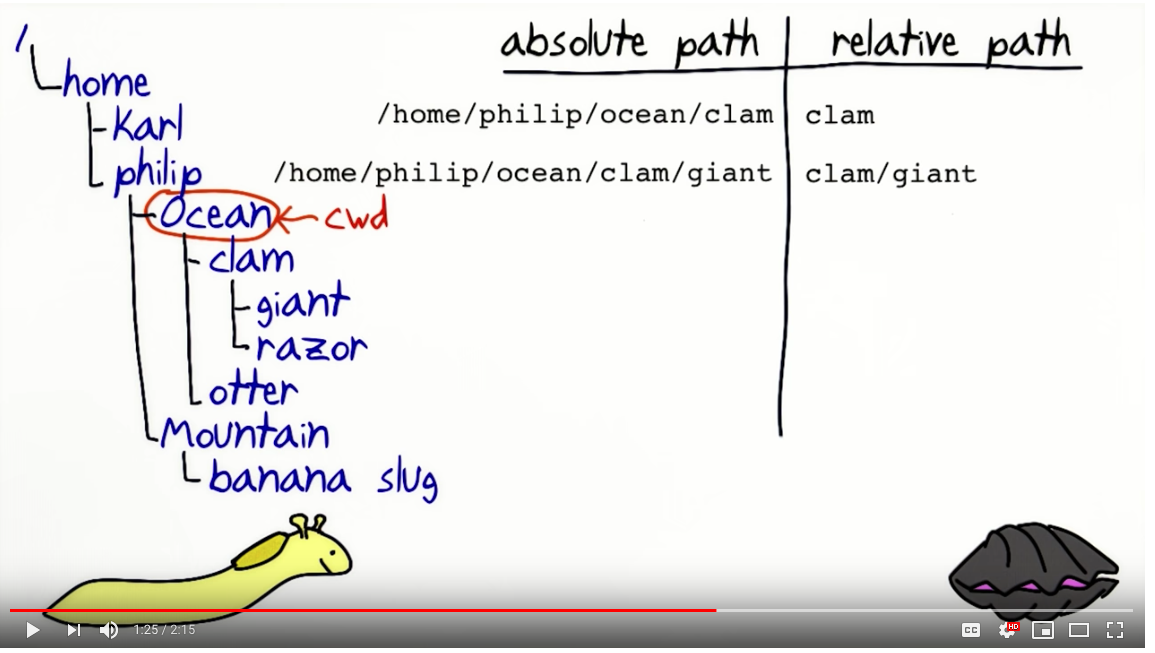
If you need a quick refresher on absolute vs. relative paths: 
- Time to explore our dataset!
Your mission: Work by yourself or with a partner to find out what the spatial coverage and resolution is for our dataset. (I.e, what is the minimum longitude? Max? Minimum latitude? Max? How many degrees between each point?).
Once you have figured this out, try to draw it on a piece of paper!
Bonus: Figure out what the temporal coverage and resolution are (i.e. how many days does it span? What is the first and last day of measurement? How many days between each measurement?). Try to draw this as well.
Hints:
-
Use the first two lines of your code to import the dataset in Atom. Try using the
printcommand on the dataset object to see what it tells you about our data. Then, explore the resources below. Try out different commands and see what your output is. -
netCDF files contain "dimensions" and "variables." Can you find out what the difference is between the two? Which type do you want for this problem? (The answer may surprise you!)
Your resources:
-
Use this tutorial and this tutorial to figure out what information our dataset contains. Make sure to write down any commands you use in your .py script file!
-
This cheat sheet may also be useful. You can also look at the documentation for the netCDF4 package and the Dataset tool.
-
Additionally, Google is your friend! Try Googling with the key words (i.e. the coding language/coding package/output you're trying to find).
