👷 If something goes wrong, checkout our most common issues and find us in slack!
First, we'll clone the debugger locally, then we'll install its dependencies with Yarn. If you don't have Yarn, you can install it here.
Also, before you start, it's helpful to make sure you have node 7. We recommend, nvm for updating the latest node.
git clone https://github.com/devtools-html/debugger.html.git
cd debugger.html
yarn install
Why Yarn and not NPM?
We like Yarn because it makes sure everyone is using the same library versions.
Next, we'll start the debugger and run it locally.
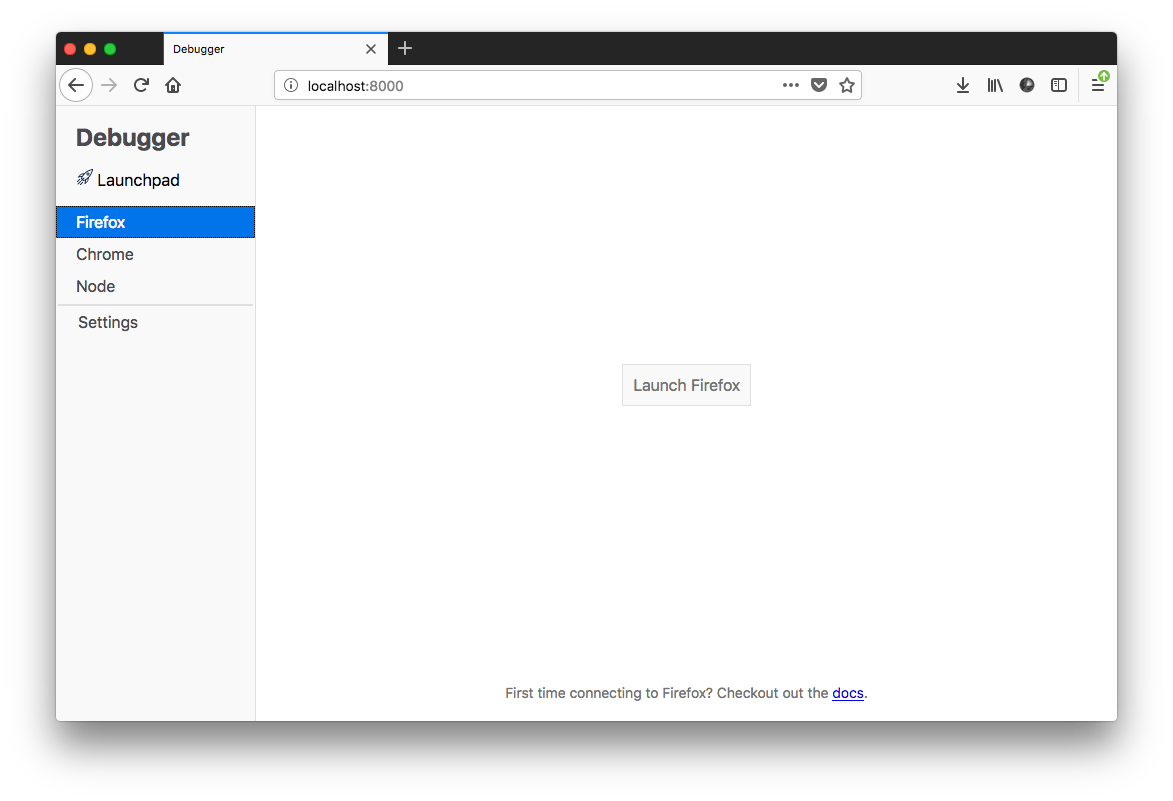
yarn startOpen http://localhost:8000 in any browser and launch
Firefox or Chrome. You should now be able to select a
tab to debug.
| Launchpad | Tabs |
|---|---|
 |
 |
Congratulations! You're now up and running. 😅
What should I do if I get an error?
Ask in our slack channel or file an issue issue here.
Here is a list of some of the most common issues
Try this first activity if you want to start debugging the debugger! 👏
This setup is for people on the DevTools team and DevTools wizards.
curl -o- -L https://yarnpkg.com/install.sh | bash -s
git clone git@github.com:devtools-html/debugger.html.git
cd debugger.html
yarn install

# close firefox if it's already running
/Applications/Firefox.app/Contents/MacOS/firefox-bin --start-debugger-server 6080 -P development

# create a new terminal tab
cd debugger.html
yarn startIf you're looking for an alternative to yarn run firefox, you have several
alternatives.
/Applications/Firefox.app/Contents/MacOS/firefox-bin --start-debugger-server 6080 -P developmentYou'll be shown a prompt to create a new "development" profile. The development profile is where your remote development user settings will be kept. It's a good thing :)
Navigate to about:config and accept any warning message. Then search for the following preferences and double click them to toggle their values to the following. example
devtools.debugger.remote-enabledtotruedevtools.chrome.enabledtotruedevtools.debugger.prompt-connectiontofalse
Close firefox and re-open it with the firefox-bin command.
- Open Firefox
- Press shift+F2 to open GCLI
- Type
listen 6080into GCLI
NOTE: This assumes that you've already set the other preferences in
about:config.
The default, traditional way to connect to Firefox uses a custom TCP protocol. However, Firefox also now supports connecting via WebSockets as well. To use this mode:
{
  "firefox": {
    "webSocketConnection": true,
    "webSocketHost": "localhost:6080"
  }
}
- With the Firefox CLI approach, add the
ws:prefix to the port:
/Applications/Firefox.app/Contents/MacOS/firefox-bin --start-debugger-server ws:6080 -P development- With the GCLI approach, enter
listen 6080 websocket
There are two ways to run chrome. Here's the easy way to run chrome
yarn run chromeHere's the slightly harder way.
/Applications/Google\ Chrome.app/Contents/MacOS/Google\ Chrome --remote-debugging-port=9222 --no-first-run --user-data-dir=/tmp/chrome-dev-profileNote that the script just automates the command :)
It's easy to start Node in a mode where DevTools will find it:
--inspect- tells node to open a debugger server--debug-brk- tells node to pause on the first statement
node --inspect --debug-brk ./node_modules/.bin/webpackNote ./node_modules/.bin/webpack could be anything. We're often debugging webpack these days so it's often appropriate 😒
Note: Currently Node.js debugging is limited in some ways, there isn't support for seeing variables or the console, but you can manage breakpoints and navigate code execution (pause, step-in, step-over, etc.) in the debugger across various sources.
Windows and Linux should just work, but unfortunately there are several edge cases.
If you find any issues on these two platforms comment on these issues:
Firefox windows command
"C:\Program Files (x86)\Mozilla Firefox\firefox.exe" -start-debugger-server 6080 -P developmentStarting Firefox or Chrome following the previous steps opens the browser on the online debugger examples.
If you want to hack the debugger even with being offline, you might want to get the repo containing those examples to run them locally.
