Stacked Bar Chart with both positive and negative groups #1207
Comments
|
I don't know of a current solution for bar charts, but #1068 presents something similar for row charts (which don't have stacking, but if you only have one positive and one negative stack it's the same thing). |
|
Apparently d3.stack supports this through stack.offset: https://bl.ocks.org/mbostock/b5935342c6d21928111928401e2c8608 Haven't tried this with stackMixin.stackLayout – anyone can help out by giving this a shot and reporting back here. |
|
Or rather, it's part of d3v4 now. d3/d3-shape#96 |
|
Hi everybody, |
|
I found a better way, instead of "iterate" use variable x and check if the d.x is a new value of a repeated: |
|
I tested a bar graph with stackOffsetDiverging, calling chart.stackLayout(d3.stack().offset(d3.stackOffsetDiverging));To make it work it is necessary to make some adjustments:
chart.on('renderlet.internal', (chart) => chart.selectAll(".bar").attr('y', (d) => chart.y()(d.y1)));
chart.yAxisMin = () => {
    const flattenStacks = Array.prototype.concat.apply([], this._dcChart.data().map((layer) => layer.domainValues));
    return dc.utils.subtract(min(flattenStacks, (p) => p.y0), this._dcChart.yAxisPadding());
};
chart.yAxisMax = () => {
    const flattenStacks = Array.prototype.concat.apply([], this._dcChart.data().map((layer) => layer.domainValues));
    return dc.utils.add(max(flattenStacks, (p) => p.y1), this._dcChart.yAxisPadding());
};
These modifications do not affect the behavior of the chart with the default stack. If a renderlet is used to modify the chart, it is important to first define the listener that modifies the In my case for example I define a renderlet to add some labels in each bar and I must execute it with the correct
I have not yet been able to verify why, but I have seen that if I hide all the stacks except the one with negative values, the height of the bars is not calculated correctly, it is zero. I have used this example as a reference: https://bl.ocks.org/mbostock/b5935342c6d21928111928401e2c8608 |
|
Thanks @frankisans, that's helpful info. TBH I am kind of surprised that it works as well as it does, given that the stack mixin was never designed to work with the new stack layouts. I take it you are saying that these changes could be pulled in without breaking the original stack functionality. That would be nice! If so, maybe someone could create a PR with tests. |
Do you have any angular code for this on stackblitz? |
Hi,
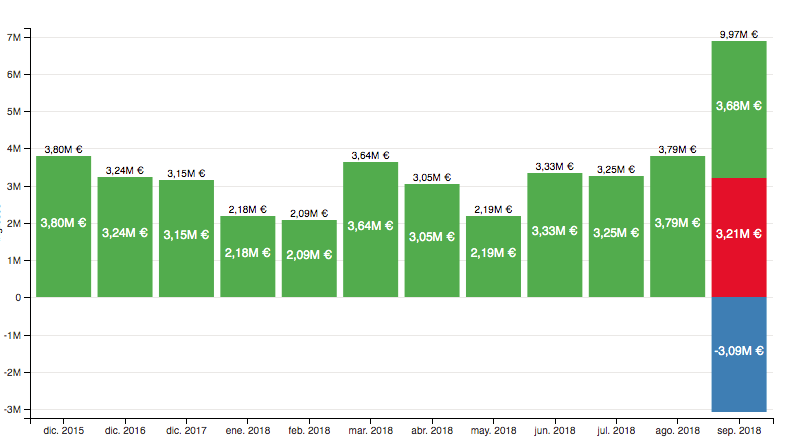
Is it possible to correctly display a stacked bar chart when you have to stack both negative and positive groups?
The problem is well described here https://groups.google.com/forum/#!topic/dc-js-user-group/CjGLKECU1II and the author provides a solution, but for 1.3. I wonder if anyone has done the same for 2.0? or if anyone could point me into right direction?
The text was updated successfully, but these errors were encountered: