Add stacked row charts #397
Comments
|
Related: #386 I'm working to expose all the stack layout options which will allow you to use "expand" for the normalized charts. |
|
I'd like to see if we can create a single barChart that will support any orientation. Then barChart will just default to vertical and rowChart will be special case with horizontal bars. See this fiddle for what I'm thinking: http://jsfiddle.net/jrideout/RWs67/ although I'd like to integrate the logic into the coordinate grid chart. We shouldn't need to switch axis, but it would swap the scales, etc ..., although the columns/rows would be rotated. |
|
+1 to stacked horizontal bar charts. I agree with jrideout on having a bar chart that can be configured to be horizontal. However, perhaps horizontal bar charts and row charts can be distinct. |
|
I've refactored the cap and stack mixins to be composable in order to build a stacked-row chart. This has required some changes to the row chart semantics:
Warning! This works for what I need (non-stacked pie, stacked row and stacked bar) and may have broken other charts which depend on cap or stack. Get it from https://github.com/RohanHart/dc.js |
|
Thank you for the fiddle example of rotating the bar chart, @jrideout! It's a really useful and comprehensible example. But it seems to only work with square charts. If you change the dimensions in the example (http://jsfiddle.net/jrideout/RWs67/) to something that's not square, anything that's outside of non-rotated area gets cut off when it's rotated. Any ideas how to fix this? |
|
@RohanHart, do you have any interest/time to contribute your changes back as a pull request? Those mostly sound like reasonable changes, and where they would break stuff we can either make them an option or perhaps enable them only when stacked. How badly do the tests fail? |
|
I've certainly the interest to reintegrate but the time may be lacking for the next month or two. Hmmm... currently 18 vows and 207 specs fail, although, from a quick scan of the errors, many are due to a few internal api changes. The essence of the changes are to allow dc.override to be stacked and separate base data generation and filtering from chart specific data by exposing both stacks and caps as special "crossfilter groups". |
|
So just to clarify, is a stacked row chart uberhaubt possible with the current master? |
|
No; I guess you would have to use @RohanHart's fork for now. I'm intrigued by this idea of using special crossfilter groups! |
|
Seems time for a progress report. Spent some time in March making tests pass but noticed that master was doing a chunk of moving tests between test libraries so paused again. I think a more gradual integration on top of the current master will be more successful in that it's proved difficult to narrow down what's causing many tests to fail, especially as it turns out that many were failing in master when I cut my branch. Haven't had any time since so pretty unlikely to be merged anytime soon unfortunately |
|
No problem, thanks both of you for the speedy update. |
|
Thanks @RohanHart, indeed we switched over to jasmine from vows back then. The test suite should be stable now. If nothing else, I will take a look at your fork for ideas. I am thinking more and more that a library of crossfilter wrappers is the proper way to deal with pivots/series/multiples. And stacked charts are really just series charts with a little more math. (That's in the post-2.0 timeframe for dc.js.) |
|
The trickiest part of the crossfilter wrappers was providing composable unwrappers for each layer so that they could get back any layer specific data which is not exposed directly. For example the cap mixin group translates a call to all() into top(n) + others if any. But it then needs a way to determine, from the resulting data which may have further layers over the cap wrapper, which is the special "others" data as it has a different raw data structure from the simple top(n) ones. It would probably have been better to drop strong crossfilter-like result data and instead provide wrappable methods on the data to do that if only to avoid tracking down the many places which made assumptions about the data structure., ie., key and value fields, and the other layers involved. |
|
@RohanHart, I take it you are saying that it becomes hard to reason about the combination of stacking and capping because there is no model for it, just things that try to look like group data. I started taking a look at your fork, but you've made really extensive changes so I didn't get very far. If you ever want to take this up again, please drop me a line. @jefffriesen, the issue remains open. I see it as a 3.0 "let's refactor everything so all these features play together nicely" kind of thing. Which (work permitting) may follow soon after 2.0. |
|
Sounds good. Thanks for al your work @gordonwoodhull |
|
@RohanHart 👍 Just integrated your fork in a project that called for stacked row chart. Works flawlessly, compatible with the other charts we were building. I would really like to see this integrated. Thanks for the hard work. |
|
Glad it worked for for you. Hopefully being a year behind the master wasn't too painful. |
|
Any news on this? I'd love to have stacked row bars :) |
|
Do you have an example or demo for the stacked row chart? |
|
bump! what happened to this? |
|
Hi @rusosnith. It would be great to have this feature, but no one has contributed it. If you want to help, you could take a look at @RohanHart's fork and see how hard it would be to bring this feature into the dc.js library. Or I think there have been other attempts, but none resulted in a PR. |
|
Hi @gordonwoodhull is it still in developement? |
|
Hi @renauld94. When I looked at @RohanHart's fork way back when, I wasn't able to piece apart the changes for this feature versus other changes he made. It has been a while but if anyone wants to figure this out, the contribution will be welcome! |
|
Damn. I got here again. To ask what happened to this. And then realize I had already asked the same thing 2 years ago |
|
Yep, no one has contributed this yet. Glad to help you out if you want to give it a try! |
|
FWIW, the normalization part of the original issue is easy to solve with a crossfilter custom reduction, see this Stack Overflow question. This issue is still about stacked rows, which still don't exist, but I wanted to point out that normalization is bread and butter for crossfilter, even nicer with reductio, and doesn't need to be implemented in dc.js. |
Nick said that doing this would probably be more than a renderlet could do.
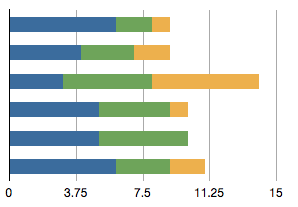
I would love this feature. Especially if you could choose between a regular row chart like this:
Or normalized (100%) row chart like this:
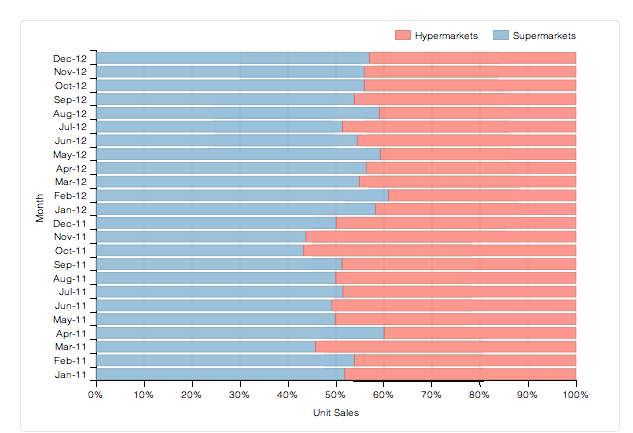
http://dimplejs.org/examples_viewer.html?id=bars_horizontal_stacked_100pct
For reference, here is a normalized vertical bar chart from Mike Bostock:
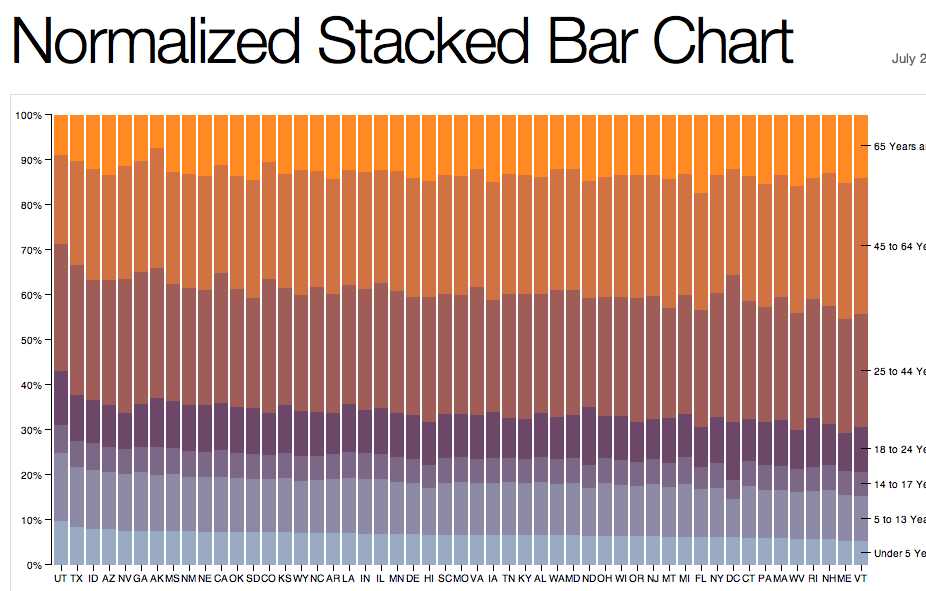
http://bl.ocks.org/mbostock/3886394
The text was updated successfully, but these errors were encountered: