In this blog, we provide the benchmarking result of EMQX message latency and response time.
This benchmark testing simulates 1000 publishers and 1000 subscribers connecting to EMQX. After all connections are established, each publisher publishes 1 message with the payload of 50 bytes per second, execute 30 mins to get the average value.
-
Concurrent connections: 1000 publishers, 1000 subscribers
-
QoS: Tests messages at the QoS 0, QoS 1, and QoS 2 levels
-
Payload: 50 bytes
-
Message Throughput: 1000/second
The test environment is configured on Alibaba Cloud, and all virtual machines are within a VPC (virtual private cloud) subnet.
| Service | Deployment | Version | OS | CPU | Memory | Cloud Host model |
|---|---|---|---|---|---|---|
| EMQX | single node | 5.0.6 | RHEL 8.5 | 2C | 4G | c6.large |
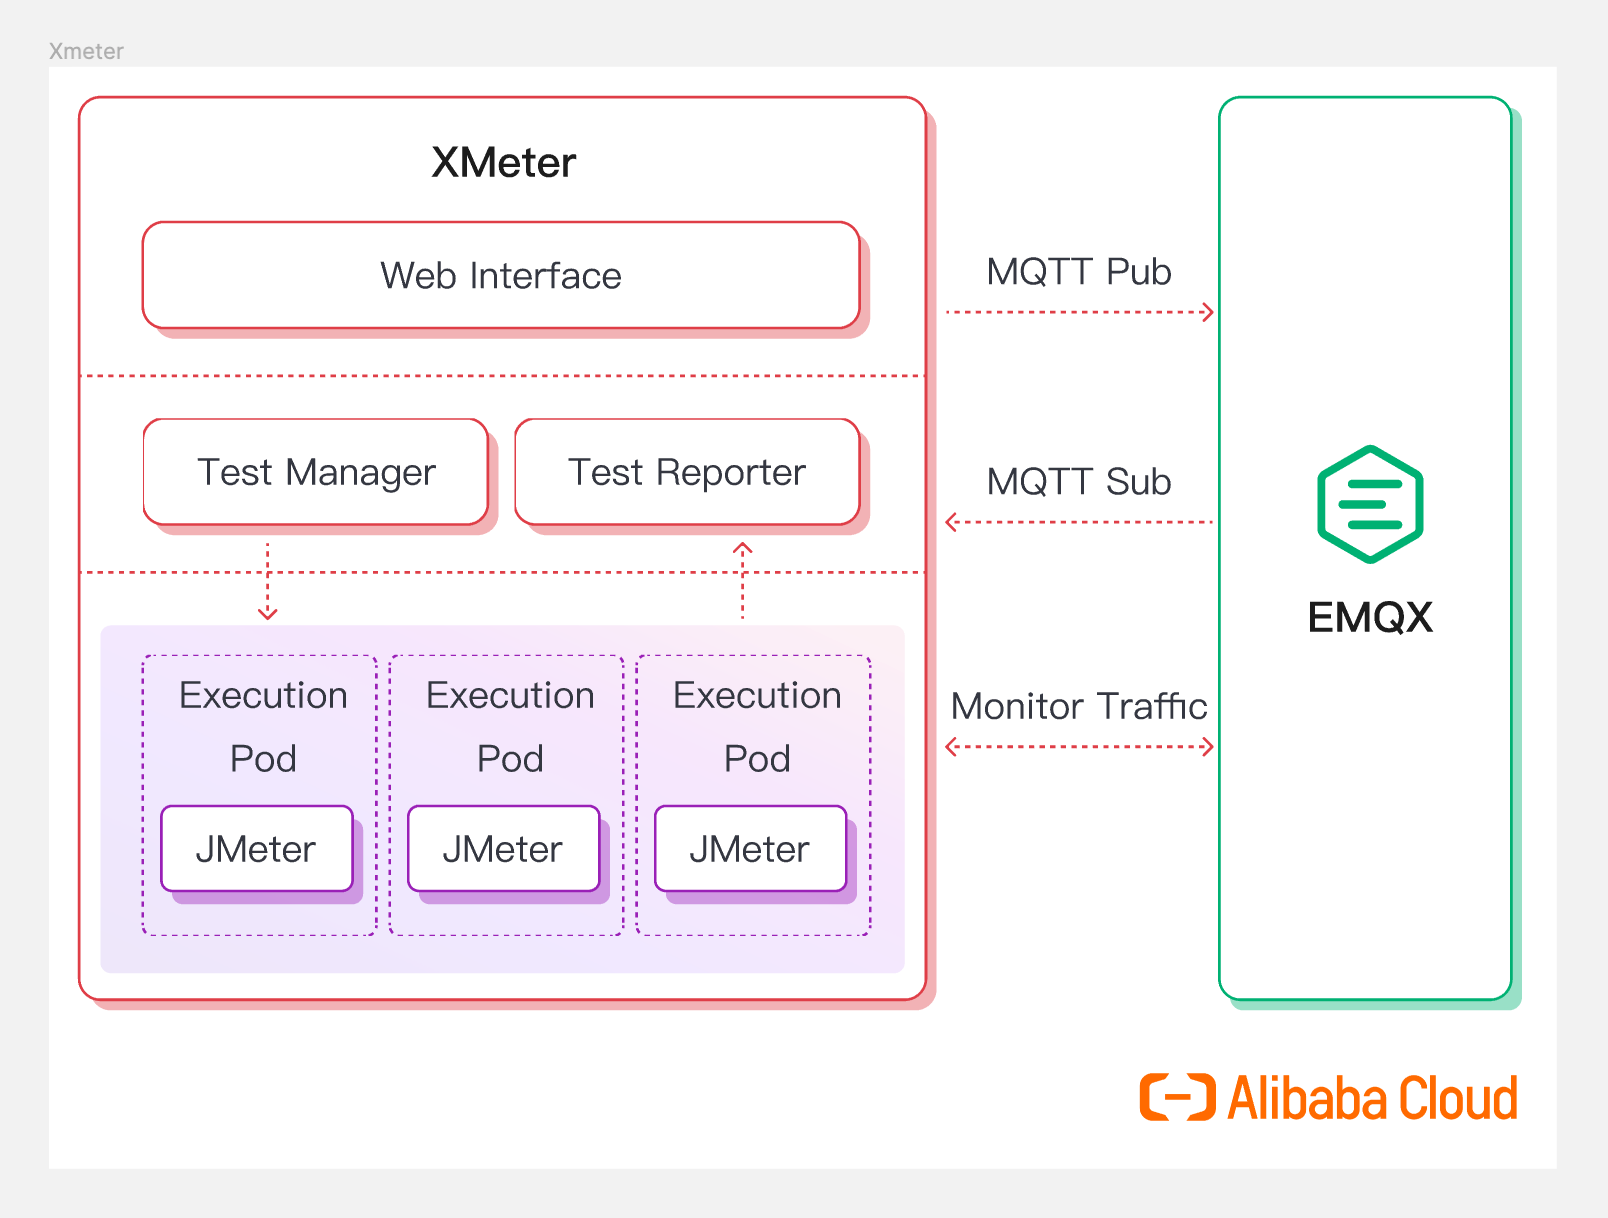
XMeter is used in this benchmark test to simulate MQTT clients. XMeter is built on top of JMeter but with enhanced scalability and more capabilities. It provides comprehensive and real-time test reports during the test. Additionally, its built-in monitoring tools are used to track the resource usage of the EMQX machines.
XMeter provides a private deployment version (on-premise) and a public cloud SaaS version. A private XMeter is deployed in the same VPC as the EMQX in this testing.
Please refer to EMQX Doc for the Linux Kernel tuning.
-
Latency: the time taken by a broker to transmit a message from a publisher to a subscriber.
-
Response time: the time difference between msg received and msg sent.
| QoS 0 | QoS 1 | QoS 2 | |
|---|---|---|---|
| Latency (ms) | 0.048 | 0.065 | 0.07 |
| response time (ms) | 1.7 | 1.7 | 1.7 |
This is a low load test and the results show that EMQX has very low message latency. In fact, EMQX is able to maintain its low latency even with a large number of messages. These results indicate that EMQX can be a valuable tool in IoT applications that require a high level of real-time responsiveness.


