Name
优化EMA黄金交叉策略Optimized-EMA-Crossover-Strategy
Author
ChaoZhang
Strategy Description
[trans]
优化EMA黄金交叉策略是一种遵循EMA指标的简单且有效的量化交易策略。它利用不同周期的EMA均线之间的交叉作为买入和卖出信号,并结合风险管理原则进行仓位管理。
该策略的名称为优化EMA黄金交叉策略。其中的“优化”二字体现了该策略在基础EMA策略的基础上进行了参数和机制的优化;“EMA”代表其核心指标为指数移动平均线;“黄金交叉”则指其交易信号的产生源自不同EMA均线的黄金交叉。
该策略的基本原理是:计算两组不同参数的EMA均线,当较短周期的EMA由下向上突破较长周期的EMA时产生买入信号;而当较短周期的EMA由上向下跌破较长周期的EMA时产生卖出信号。这里选取7周期和20周期EMA进行组合,形成快线和慢线。
代码中通过fastEMA = ema(close, fastLength)和slowEMA = ema(close, slowLength)来计算并绘制7日EMA和20日EMA。当快线上穿慢线时,即crossover(fastEMA, slowEMA)条件成立时产生买入信号;当快线下破慢线时,即crossunder(fastEMA, slowEMA)条件成立时产生卖出信号。
优化EMA黄金交叉策略具有以下几点优势:
-
操作简单。仅基于EMA均线的黄金交叉形成交易信号,容易理解和实现,适合量化交易的自动化。
-
反转捕捉能力强。EMA作为一种趋势跟踪指标,当短期和长期EMA产生交叉时,常常意味着短期趋势和长期趋势的反转,这为捕捉反转提供了时机。
-
平滑去噪效果好。EMA本身具有平滑去噪的特性,有助滤除短期市场噪音,产生高质量交易信号。
-
参数优化设计。FAST EMA和SLOW EMA的周期经过优化选择,在捕捉反转和滤波噪音之间取得平衡,从而产生稳定信号。
-
仓位管理科学。根据ATR和风险回报比优化仓位管理,有效控制单笔交易风险,确保强劲资金管理。
优化EMA黄金交叉策略也存在一些风险,主要体现在:
-
不适合趋势性市场。EMA交叉对趋势性较强的市场适应性较差,可能产生过多无效信号。
-
参数敏感性较高。FAST EMA和SLOW EMA的选择对策略效果影响显著,需要仔细测试优化。
-
信号延迟问题。EMA交叉信号本身存在一定滞后,可能错过最佳入场时点。
-
止损风险。现有代码中还未引入止损机制,存在较大回撤风险。
对应的解决方案是:
-
采用多因子模型,引入其它指标判断趋势;
-
充分回测寻找最优参数组合;
-
结合其它先行指标。如增量指标MACD的零轴交叉;
-
制定合理的止损策略。如ATR倍数止损或收市止损。
优化EMA黄金交叉策略的优化方向主要集中在以下几个方面:
-
多市场适应性优化。引入市场状态判断,在趋势行情中关闭策略,减少无效信号。
-
参数寻优。通过遗传算法等寻找最优的参数组合,提高策略稳定性。
-
止损机制引入。设置合理的止损规则。如采用ATR动态止损、移动止损或收市止损。
-
回测周期优化。解析不同时间级别的数据,确定最优的策略执行周期。
-
仓位管理优化。优化仓位算法,在风险与收益之间寻找最佳平衡。
这些优化举措将有助于减少不必要信号,控制回撤风险,提高策略的稳定性和收益率。
优化EMA黄金交叉策略是一个简单高效的量化策略。它利用EMA的优良特性形成交易信号,并在此基础上进行优化设计。该策略具有操作简便、反转捕捉能力强、参数优化、科学的仓位管理等优势;同时也存在一定的市场适应性风险和信号质量风险。未来的优化空间在于提升策略的稳定性和多市场适应性。通过不断优化实践,该策略有望成为可靠的量化解决方案。
||
The optimized EMA crossover strategy is a simple yet effective quantitative trading strategy that follows the EMA indicators. It utilizes the crossover between EMAs of different periods as buy and sell signals, combined with position sizing based on risk management principles.
The name of the strategy is Optimized EMA Golden Cross Strategy. The word "Optimized" reflects the optimization of parameters and mechanisms based on the basic EMA strategy; "EMA" represents the core indicator Exponential Moving Average; "Golden Cross" refers to the trading signals generated by the golden cross of different EMA lines.
The basic logic is: Calculate two groups of EMAs with different parameters, generate buy signals when the faster EMA crosses above the slower EMA, and generate sell signals when the faster EMA crosses below the slower EMA. The combinations of 7-period and 20-period EMAs are used here, forming the fast line and slow line.
In the code, fastEMA = ema(close, fastLength) and slowEMA = ema(close, slowLength) calculate and plot the 7-day EMA and 20-day EMA. When the fast line crosses above the slow line, i.e. the crossover(fastEMA, slowEMA) condition is true, a buy signal is generated. When the fast line crosses below the slow line, i.e. the crossunder(fastEMA, slowEMA) condition is true, a sell signal is generated.
The Optimized EMA Golden Cross Strategy has the following advantages:
-
Simple to operate. Trade signals are generated simply based on golden crosses of EMA lines, which is easy to understand and implement for automated quantitative trading.
-
Strong reversal capture capability. As a trend following indicator, crosses of short-term and long-term EMAs often imply reversals between short-term and long-term trends, providing opportunities to capture reversals.
-
Good smooth noise reduction effect. EMA itself has the feature of smoothing out noises, helping filter out short-term market noises and generate high quality trading signals.
-
Optimized parameter design. The periods of the FAST EMA and SLOW EMA are optimized to balance capturing reversals and filtering out noises, resulting in solid signals.
-
Scientific position sizing. Based on the ATR and risk-reward ratio, position sizes are optimized for effective single trade risk control and robust money management.
The Optimized EMA Golden Cross Strategy also contains some risks, mainly in:
-
Not suitable for trending markets. EMA crosses tend to underperform in strongly trending markets, potentially generating excessive invalid signals.
-
Sensitive to parameters. The choices of FAST EMA and SLOW EMA periods significantly impact strategy performance, requiring careful testing and optimization.
-
Signal lag. EMA cross signals inherently have some lag, which may result in missing best entry points.
-
No stop loss. The current code does not include stop loss mechanisms, leading to large drawdown risks.
The solutions are:
-
Adopt multi-factor models with other indicators judging trends.
-
Fully backtest to find optimal parameter sets.
-
Combine with leading indicators like MACD zero line crosses.
-
Develop reasonable stop loss strategies, e.g. ATR trailing stops or close-by stops.
The optimization directions of the Optimized EMA Golden Cross Strategy mainly focus on:
-
Enhancing multi-market adaptiveness. Introduce market regime judgments to disable strategy in trending markets, reducing invalid signals.
-
Parameter optimization. Find optimum sets via genetic algorithms to improve stability.
-
Introducing stop loss mechanisms. Apply proper stop loss rules like ATR trailing stops, moving stops or close-by stops.
-
Optimizing backtesting periods. Analyze data of different timeframes to find optimal execution cycles.
-
Improving position sizing. Refine position sizing algorithms to find the optimum balance between risk and return.
These measures will help reduce unnecessary signals, control drawdowns, and enhance the stability and profitability of the strategy.
The Optimized EMA Golden Cross Strategy is a simple yet effective quantitative strategy. It utilizes the excellent properties of EMA to generate trading signals, and optimizes further based on that. The strategy has advantages like easy operation, strong reversal capturing capability, parameter optimization and scientific position sizing; it also has some market adaptiveness risks and signal quality risks. The future optimization spaces lie in improving stability and multi-market adaptiveness. Through constant optimization practices, this strategy has the potential to become a reliable quantitative solution.
[/trans]
Strategy Arguments
| Argument | Default | Description |
|---|---|---|
| v_input_1 | 7 | Fast EMA Length |
| v_input_2 | 20 | Slow EMA Length |
| v_input_3 | 2.5 | Risk-Reward Ratio |
Source (PineScript)
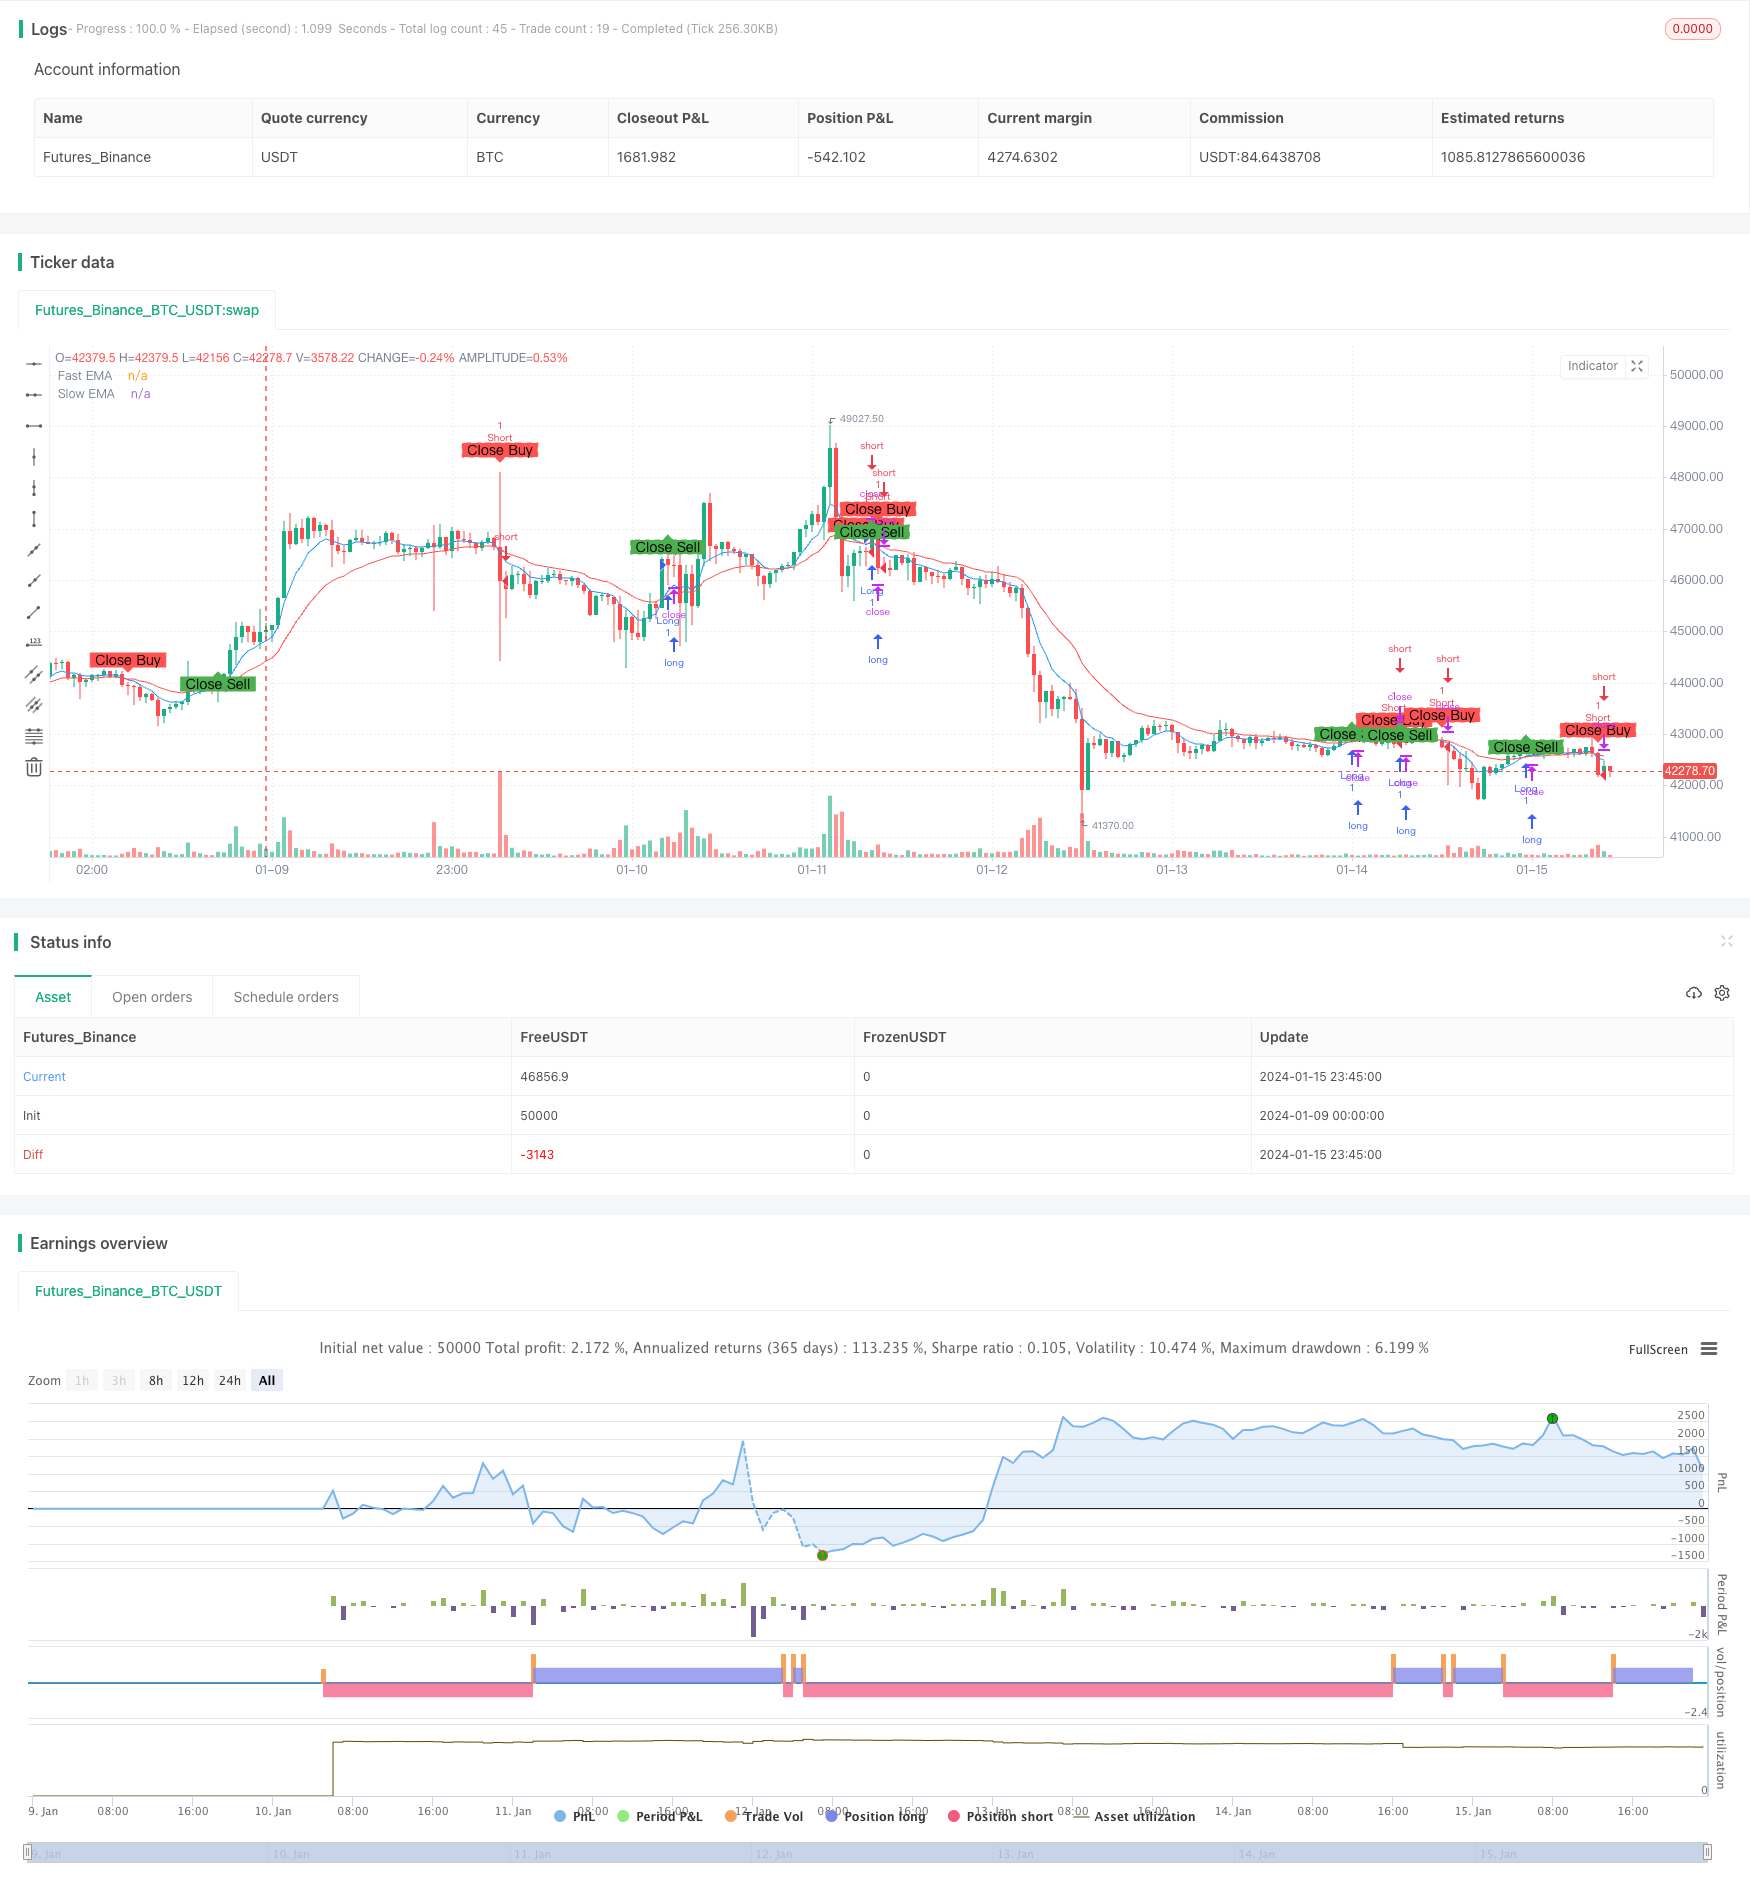
/*backtest
start: 2024-01-09 00:00:00
end: 2024-01-16 00:00:00
period: 45m
basePeriod: 5m
exchanges: [{"eid":"Futures_Binance","currency":"BTC_USDT"}]
*/

// This Pine Script™ code is subject to the terms of the Mozilla Public License 2.0 at https://mozilla.org/MPL/2.0/
// © mayurtale972
//@version=4
strategy("Optimized EMA Crossover Strategy - 15-Min", overlay=true, shorttitle="EMA15")

// Input parameters
fastLength = input(7, title="Fast EMA Length")
slowLength = input(20, title="Slow EMA Length")
riskRewardRatio = input(2.5, title="Risk-Reward Ratio")

// Calculate EMAs
fastEMA = ema(close, fastLength)
slowEMA = ema(close, slowLength)

// Plot EMAs on the chart
plot(fastEMA, color=color.blue, title="Fast EMA")
plot(slowEMA, color=color.red, title="Slow EMA")

// Entry conditions
longCondition = crossover(fastEMA, slowEMA)
shortCondition = crossunder(fastEMA, slowEMA)

// Exit conditions
closeLongCondition = crossunder(fastEMA, slowEMA)
closeShortCondition = crossover(fastEMA, slowEMA)

// Calculate position size based on risk-reward ratio
riskAmount = 1.5
positionSize = strategy.equity * riskAmount / (riskRewardRatio * atr(14))

// Execute trades with calculated position size
strategy.entry("Long", strategy.long, when=longCondition)
strategy.entry("Short", strategy.short, when=shortCondition)

// Exit trades based on conditions
strategy.close("Long", when=closeLongCondition)
strategy.close("Short", when=closeShortCondition)

// Plot entry and exit points on the chart
plotshape(series=longCondition, title="Buy Signal", color=color.green, style=shape.labelup, text="Buy")
plotshape(series=shortCondition, title="Sell Signal", color=color.red, style=shape.labeldown, text="Sell")
plotshape(series=closeLongCondition, title="Close Buy Signal", color=color.red, style=shape.labeldown, text="Close Buy")
plotshape(series=closeShortCondition, title="Close Sell Signal", color=color.green, style=shape.labelup, text="Close Sell")
Detail
https://www.fmz.com/strategy/439052
Last Modified
2024-01-17 12:01:59