Name
动态追踪止损策略Dynamic-Trailing-Stop-Loss-Strategy
Author
ChaoZhang
Strategy Description
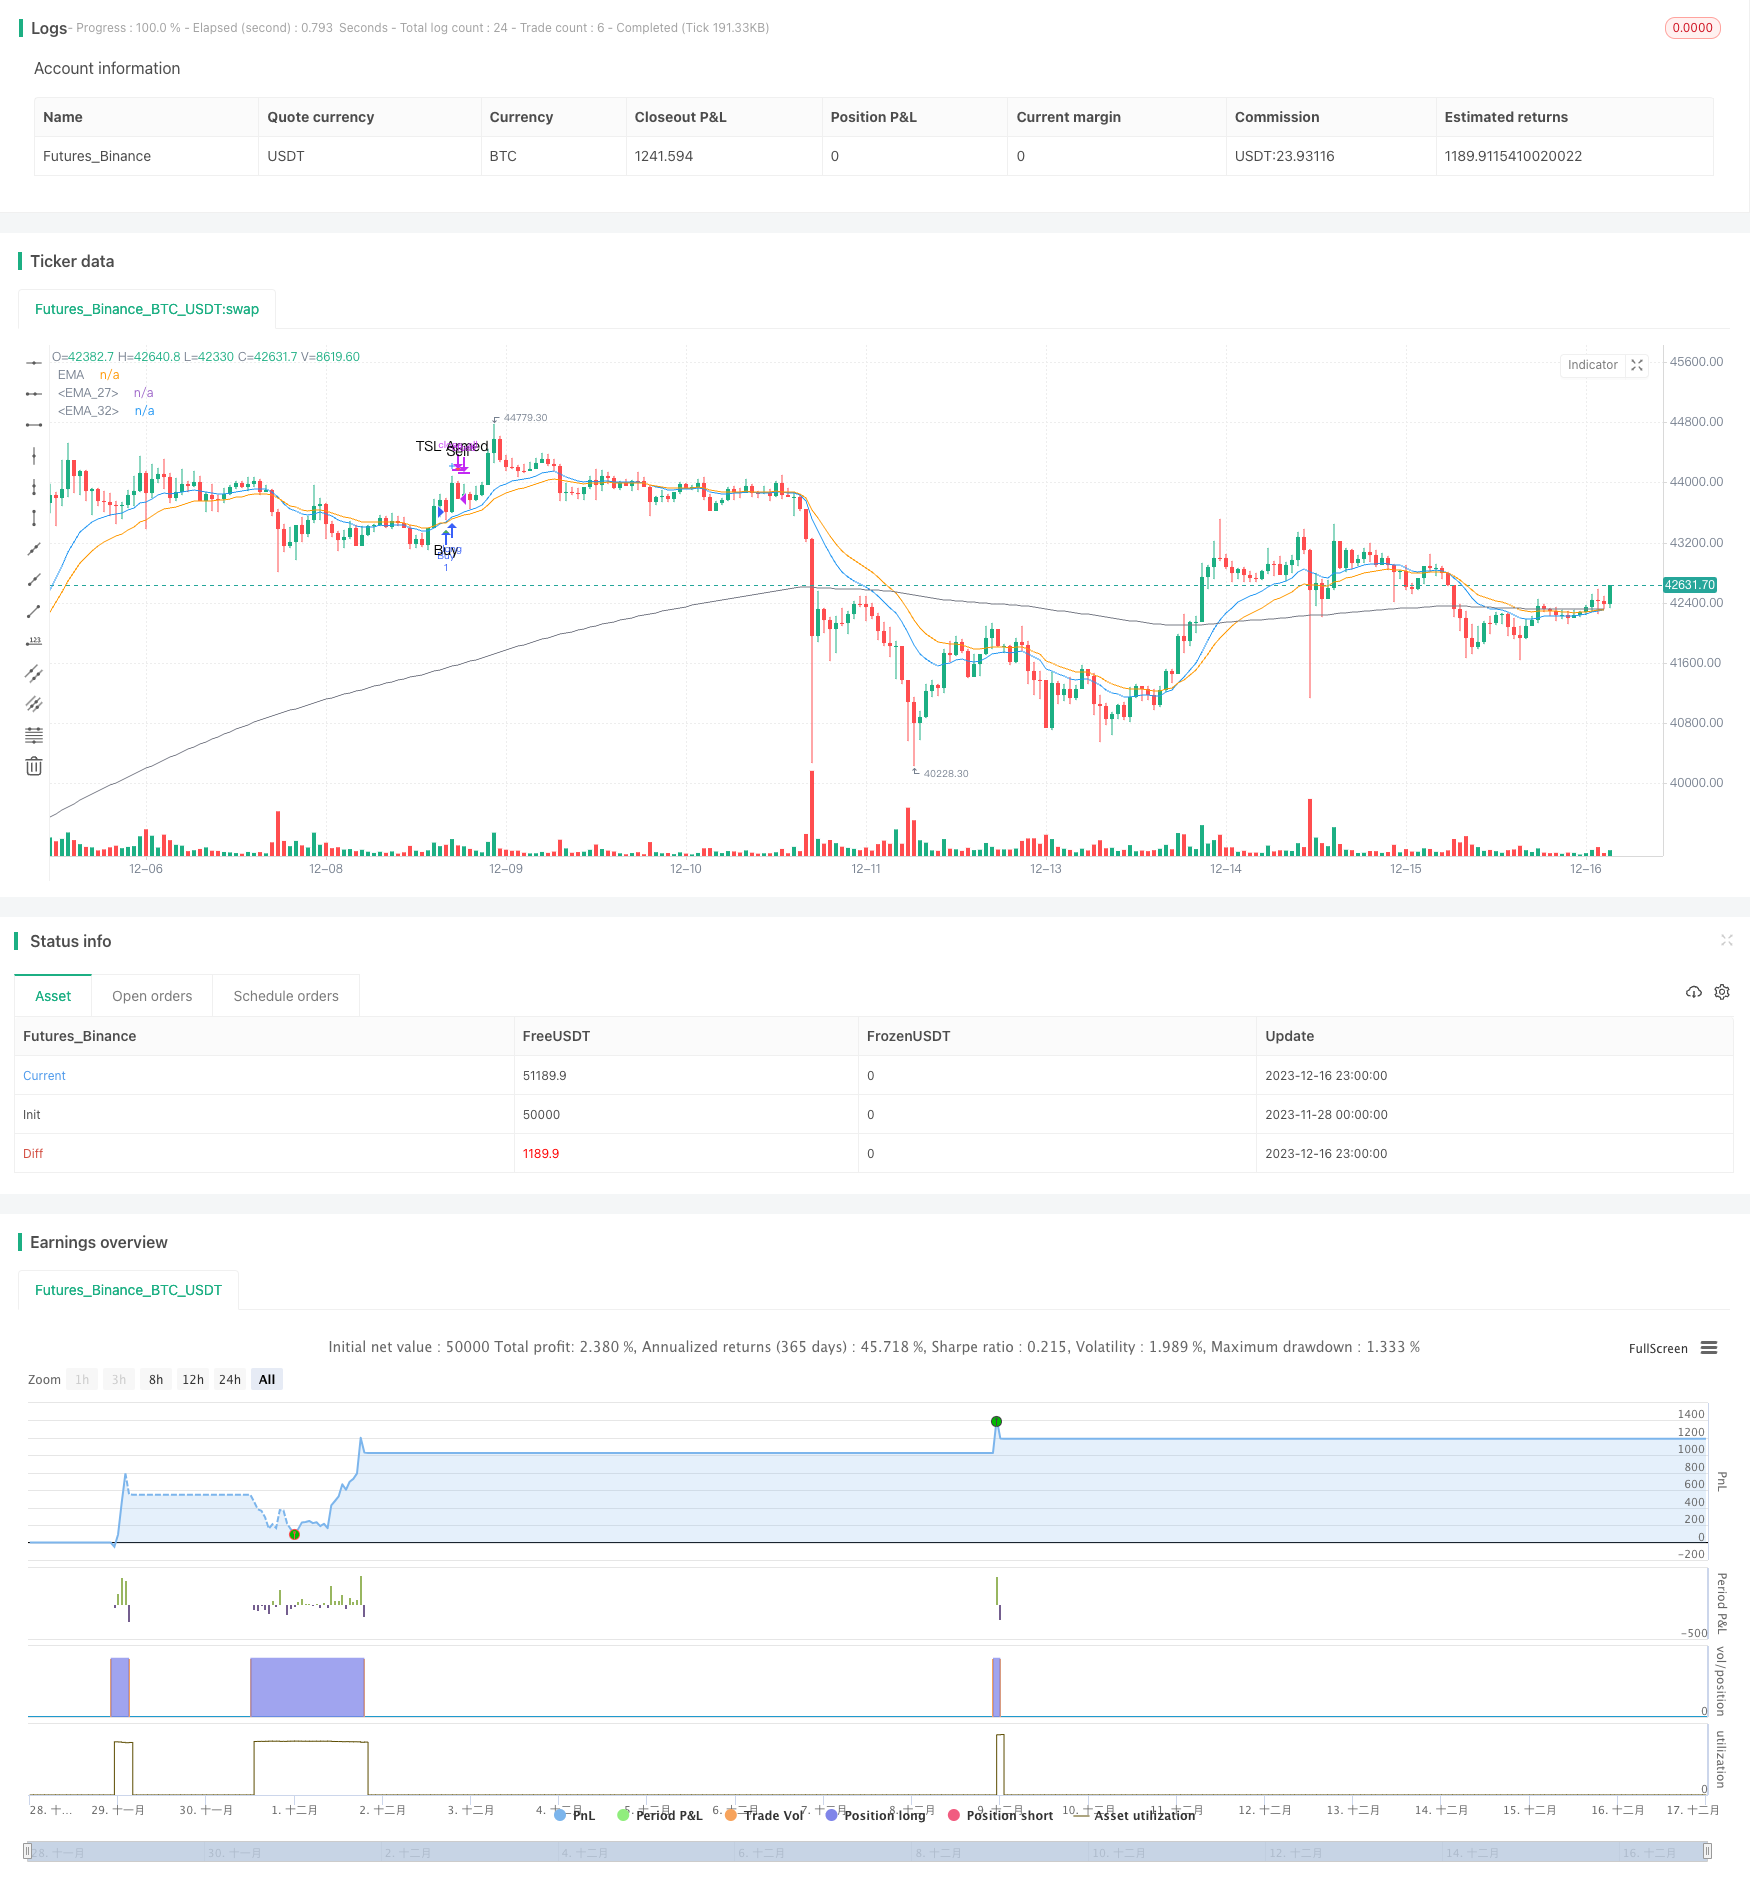
动态追踪止损策略是一个利用追踪止损机制的量化交易策略。该策略基于趋势跟踪理论,设置追踪止损线,实现止损确认和追踪止损调整。主要用于控制单笔交易的止损,最大限度锁定盈利,降低交易风险。
动态追踪止损策略的核心在于设定三个关键参数:初始止损距离、追踪止损距离和追踪止损触发距离。当买入信号触发后,根据买入价格和设定的初始止损距离计算出初始止损价。随后每根K线都会判断是否达到追踪止损触发条件,如果达到则会设置新的追踪止损价。新的追踪止损价会基于当前收盘价和追踪止损距离计算。这样,只要价格向有利方向运行,追踪止损线就会不断上调锁定盈利。当价格反转触发追踪止损线时,发出卖出信号。
该策略同时设有低位止损,无论是否启动追踪止损,如果价格跌破低位止损则会直接止损。低位止损用于防范突发事件的价格跳空。所以,动态追踪止损策略通过上下双线形式的动态止损机制,使止损线能够自动跟踪有利走势,同时防止损失过大。
-
通过追踪止损不断锁定盈利,避免给回补过多机会。
-
采用上下双线止损结构,既确保止损线能及时跟进,又防止损失过大。
-
利用持续判断机制进行止损调整,操作简单,容易实现。
-
可根据市场和个股特点,调整参数优化止损效果。
-
无需预测市场走向,跟随趋势运行即可。
-
参数设置不当可能导致止损过于宽松或过于紧迫。过于宽松则无法有效止损,过于紧迫则容易被价格普通波动击出。
-
突发事件造成价格跳空下跌时,可能导致止损无效,应配合其它防护措施。
-
交易费用和滑点可能对止损线触发后的实际卖出价格产生影响。
-
适应性并不强,在特定阶段,例如震荡区间中效果并不佳。
对策:
- 建议根据回测和实盘结果不断优化参数。
- 可设置更宽的低位止损防范跳空。
- 计算止损价时考虑交易费用和滑点影响。
- 可结合趋势和波动判断指标使用。
-
将追踪止损线调整为百分比变化方式,可以更好跟踪不同价格水平下的股价变动。
-
添加波动率指标,判断大幅波动时暂停追踪止损,避免普通波动触发止损。
-
利用机器学习方法自动优化参数。训练样本选择最近一段时间内参数组合的收益率。
-
增加开仓条件判断,结合趋势、支持阻力等指标,避免在震荡行情开仓。
动态追踪止损策略通过双线止损机制,设置追踪止损线,实现止损确认和追踪止损调整。可根据价格变化自动调整止损距离,用于锁定盈利、减少回吐和控制损失。该策略操作简单,易于实现,可根据市场情况优化参数,与其他策略组合使用效果更佳。但也存在一定局限性,建议调整完善后再投入实盘运用。
||
The dynamic trailing stop loss strategy is a quantitative trading strategy that utilizes a trailing stop loss mechanism. It sets a trailing stop loss line based on trend tracking theory to confirm stop loss and adjust trailing stop loss. It is mainly used to control the stop loss of a single trade, maximize profit locking, and reduce trading risks.
The core of the dynamic trailing stop loss strategy lies in setting three key parameters: initial stop loss distance, trailing stop loss distance and trailing stop loss trigger distance. After a buy signal is triggered, the initial stop loss price is calculated based on the entry price and the set initial stop loss distance. Then, every bar will judge whether the trailing stop loss trigger condition is met. If yes, a new trailing stop loss price will be set. The new trailing stop loss price is calculated based on the current closing price and trailing stop loss distance. Thus, as long as the price runs in a favorable direction, the trailing stop loss line will continue to move up to lock in profits. When the price reversal triggers the trailing stop loss line, a sell signal will be generated.
This strategy also has a lower stop loss. No matter whether the trailing stop loss is activated or not, if the price breaks below the lower stop loss, stop loss will be directly triggered. The lower stop loss serves to guard against price gaps caused by sudden events. Therefore, through the dynamic stop loss mechanism in the form of double-line stop loss, the stop loss line can automatically track favorable trends, while preventing excessive losses.
-
Continuously lock in profits through trailing stop loss, avoiding giving too much retracement room.
-
Adopt a double-line stop loss structure to ensure the stop loss line can promptly follow up, while preventing excessive losses.
-
Use a continuous judgment mechanism for stop loss adjustment with simple operation and easy implementation.
-
Parameters can be optimized according to market and stock characteristics to improve stop loss efficacy.
-
No need to predict market trends, just follow the trend.
-
Improper parameter settings may result in either too loose or too tight stop loss. Too loose would make stop loss ineffective, while too tight tends to get stopped out by normal price fluctuations.
-
In case of price gaps caused by sudden events, it may fail to stop loss. Other protective measures should be taken accordingly.
-
Trading costs and slippage may affect the actual selling price after the stop loss line is triggered.
-
Adaptability is not strong. It does not work well in certain stages, such as range-bound movements.
Countermeasures:
- It is recommended to continuously optimize parameters based on backtest and live results.
- Set a wider lower stop loss to guard against price gaps.
- Take trading costs and slippage into account when calculating stop loss price.
- Use in combination with trend and volatility indicators.
-
Adjust the trailing stop loss line in percentage change, which can better track price movements across different price levels.
-
Add volatility metrics to suspend trailing stop loss when facing high volatility, avoiding normal fluctuations from triggering stop loss.
-
Automatically optimize parameters via machine learning. Choose return of different parameter combinations in recent period as training samples.
-
Add open position criteria with consideration of indicators like trend, support & resistance to avoid opening positions in ranging markets.
The dynamic trailing stop loss strategy sets trailing stop loss lines through a double-line stop loss mechanism to confirm stop loss and adjust trailing stop loss based on price changes. It can automatically adjust stop loss distance to lock in profits, reduce pullbacks and control losses. With simple operation and easy implementation, this strategy can be further optimized based on market conditions and used together with other strategies for better performance. But it also has some limitations. It is advisable to improve and test it sufficiently before applying it in live trading.
[/trans]
Strategy Arguments
| Argument | Default | Description |
|---|---|---|
| v_input_float_1 | 0.035 | (?Sell Settings)Stop Loss Loss: 1% = .01 |
| v_input_float_2 | 0.0065 | Trailing Stop Arm: 1%=.01 |
| v_input_float_3 | 0.003 | Trailing Stop Trigger: 1%=.01 |
| v_input_int_1 | 14 | (?Trend Line Settings) ema 1 Length |
| v_input_1_close | 0 | ema 1 Source: close |
| v_input_int_2 | 22 | ema 2 Length |
| v_input_2_close | 0 | ema 2 Source: close |
| v_input_int_3 | 200 | ema 3 Length |
| v_input_3_close | 0 | ema 2 Source: close |
Source (PineScript)
/*backtest
start: 2023-11-28 00:00:00
end: 2023-12-17 00:00:00
period: 1h
basePeriod: 15m
exchanges: [{"eid":"Futures_Binance","currency":"BTC_USDT"}]
*/

// This source code is subject to the terms of the Mozilla Public License 2.0 at https://mozilla.org/MPL/2.0/
// © Thumpyr
//@version=5

/////////////////////////////////////////////////////////////////////////////////////////////
// Comment out Strategy Line and remove // from Indicator line to turn into Indicator  //////
// Do same for alertConidction at bottom                                               //////
/////////////////////////////////////////////////////////////////////////////////////////////
strategy("PCT Trailing Stoploss-Strategy", shorttitle="PCT Trailing Stoploss- Strategy", overlay=true)
//indicator(title="PCT Trailing Stoploss- Indicator", shorttitle="PCT Trailing Stoploss - Indicator", timeframe="", timeframe_gaps=true, overlay=true)//

sellLow=input.float(.035, minval=0, title="Stop Loss Loss: 1% = .01", group="Sell Settings")
trailStopArm=input.float(.0065, minval=0, title="Trailing Stop Arm: 1%=.01", group="Sell Settings")
trailStopPct=input.float(.003, minval=0, title="Trailing Stop Trigger: 1%=.01 ", group="Sell Settings")

/////////////////////////////////////////////////
//               Indicators                    //
/////////////////////////////////////////////////
ema1Len = input.int(14, minval=1, title=" ema 1 Length", group="Trend Line Settings")
ema1Src = input(close, title="ema 1 Source", group="Trend Line Settings")
ema1 = ta.ema(ema1Src, ema1Len)
plot(ema1, title="EMA", color=color.blue)

ema2Len = input.int(22, minval=1, title=" ema 2 Length", group="Trend Line Settings")
ema2Src = input(close, title="ema 2 Source", group="Trend Line Settings")
ema2 = ta.ema(ema2Src, ema2Len)
plot(ema2, title="EMA", color=color.orange)

ema3Len = input.int(200, minval=1, title=" ema 3 Length", group="Trend Line Settings")
ema3Src = input(close, title="ema 2 Source", group="Trend Line Settings")
ema3 = ta.ema(ema3Src, ema3Len)
plot(ema3, title="EMA", color=color.gray)


/////////////////////////////
////   Buy Conditions    ////
/////////////////////////////

alertBuy = ta.crossover(ema1,ema2) and close>ema3

////////////////////////////////////////////////////////////////////
////   Filter redundant Buy Signals if Sell has not happened    ////
////////////////////////////////////////////////////////////////////
var lastsignal = 0
showAlertBuy = 0
if(alertBuy and lastsignal !=1)
    showAlertBuy  := 1
    lastsignal      := 1
buyAlert= showAlertBuy > 0


//////////////////////////////////////////////////////////////////
////          Track Conditions at buy Signal                  ////
//////////////////////////////////////////////////////////////////

alertBuyValue = ta.valuewhen(buyAlert, close,0)
alertSellValueLow = alertBuyValue - (alertBuyValue*sellLow)

////////////////////////////////////////////////////////////
/////            Trailing Stop                         /////
////////////////////////////////////////////////////////////
var TSLActive=0         //Check to see if TSL has been activated
var TSLTriggerValue=0.0 //Initial and climbing value of TSL
var TSLStop = 0.0       //Sell Trigger
var TSLRunning =0       //Continuously check each bar to raise TSL or not

//  Check if a Buy has been triggered and set initial value for TSL //
if buyAlert
    TSLTriggerValue := alertBuyValue+(alertBuyValue*trailStopArm)
    TSLActive := 0
    TSLRunning :=1
    TSLStop := TSLTriggerValue - (TSLTriggerValue*trailStopPct)


//  Check that Buy has triggered and if Close has reached initial TSL//
//  Keeps from setting Sell Signal before TSL has been armed w/TSLActive//
beginTrail=TSLRunning==1 and TSLActive==0 and close>alertBuyValue+(alertBuyValue*trailStopArm) and ta.crossover(close,TSLTriggerValue)
if beginTrail
    TSLTriggerValue :=close
    TSLActive :=1
    TSLStop :=TSLTriggerValue - (TSLTriggerValue*trailStopPct)

//  Continuously check if TSL needs to increase and set new value //
runTrail= TSLActive==1 and (ta.crossover(close,TSLTriggerValue) or close>=TSLTriggerValue)
if runTrail
    TSLTriggerValue :=close
    TSLStop :=TSLTriggerValue - (TSLTriggerValue*trailStopPct)

//  Verify that TSL is active and trigger when close cross below TSL Stop//
TSL=TSLActive==1 and (ta.crossunder(close,TSLStop) or (close[1]>TSLStop and close<TSLStop))

// Plot point of inital arming of TSL//
TSLTrigger=TSLActive==1 and TSLActive[1]==0
plotshape(TSLTrigger, title='TSL Armed', location=location.abovebar, color=color.new(color.blue, 0), size=size.small, style=shape.cross, text='TSL Armed')


////////////////////////////////////////////////////////////
// Plots used for troubleshooting and verification of TSL //
////////////////////////////////////////////////////////////
//plot(TSLActive,"Trailing Stop", color=#f48fb1)
//plot(TSLRunning,"Trailing Stop", color=#f48fb1)
//plot(TSLTriggerValue,"Trailing Stop Trigger", color.new(color=#ec407a, transp = TSLRunning==1 ? 0 : 100))
//plot(TSLStop,"Trailing Stop", color.new(color=#f48fb1, transp = TSLRunning==1 ? 0 : 100))//


////////////////////////////////////////////////////////////
/////             Sell Conditions                    ///////
////////////////////////////////////////////////////////////
Sell1 = TSL
Sell2 = ta.crossunder(close,alertSellValueLow)

alertSell= Sell1 or Sell2
////////////////////////////////////////////////////////////

////////////////////////////////////////////////////////////
////        Remove Redundant Signals                    ////
////////////////////////////////////////////////////////////
showAlertSell = 0
if(alertSell and lastsignal != -1)
    showAlertSell := 1
    lastsignal      := -1
sellAlert= showAlertSell > 0

if sellAlert
    TSLActive :=0
    TSLRunning :=0

/////////////////////////////////////////
//  Plot Buy and Sell Shapes on Chart  //
/////////////////////////////////////////
plotshape(buyAlert, title='Buy', location=location.belowbar, color=color.new(color.green, 0), size=size.small, style=shape.triangleup, text='Buy')
plotshape(sellAlert, title='Sell', location=location.abovebar, color=color.new(color.red, 0), size=size.small, style=shape.triangledown, text='Sell')

/////////////////////////////////////////////////////////////////////////////////////////////
//                        Remove // to setup for Indicator                                 //
/////////////////////////////////////////////////////////////////////////////////////////////
//Alerts
//alertcondition(title='Buy Alert', condition=buyAlert, message='Buy Conditions are Met')
//alertcondition(title='Sell Alert', condition=sellAlert, message='Sell Conditions are Met')
/////////////////////////////////////////////////////////////////////////////////////////////


////////////////////////////////////////////////////////////
////  Comment out this section if setup as Indicator    ////
////////////////////////////////////////////////////////////
longCondition = buyAlert
if (longCondition)
    strategy.entry("Buy", strategy.long)
    alert(message='Buy', freq=alert.freq_once_per_bar_close)

shortCondition = sellAlert
if (shortCondition)
    strategy.close_all(sellAlert,"Sell")
    alert(message='Sell', freq=alert.freq_once_per_bar_close)
/////////////////////////////////////////////////////////////
Detail
https://www.fmz.com/strategy/436984
Last Modified
2023-12-29 10:42:27