Name
动量指标交叉策略Momentum-Indicator-Crossover-Strategy
Author
ChaoZhang
Strategy Description
[trans]
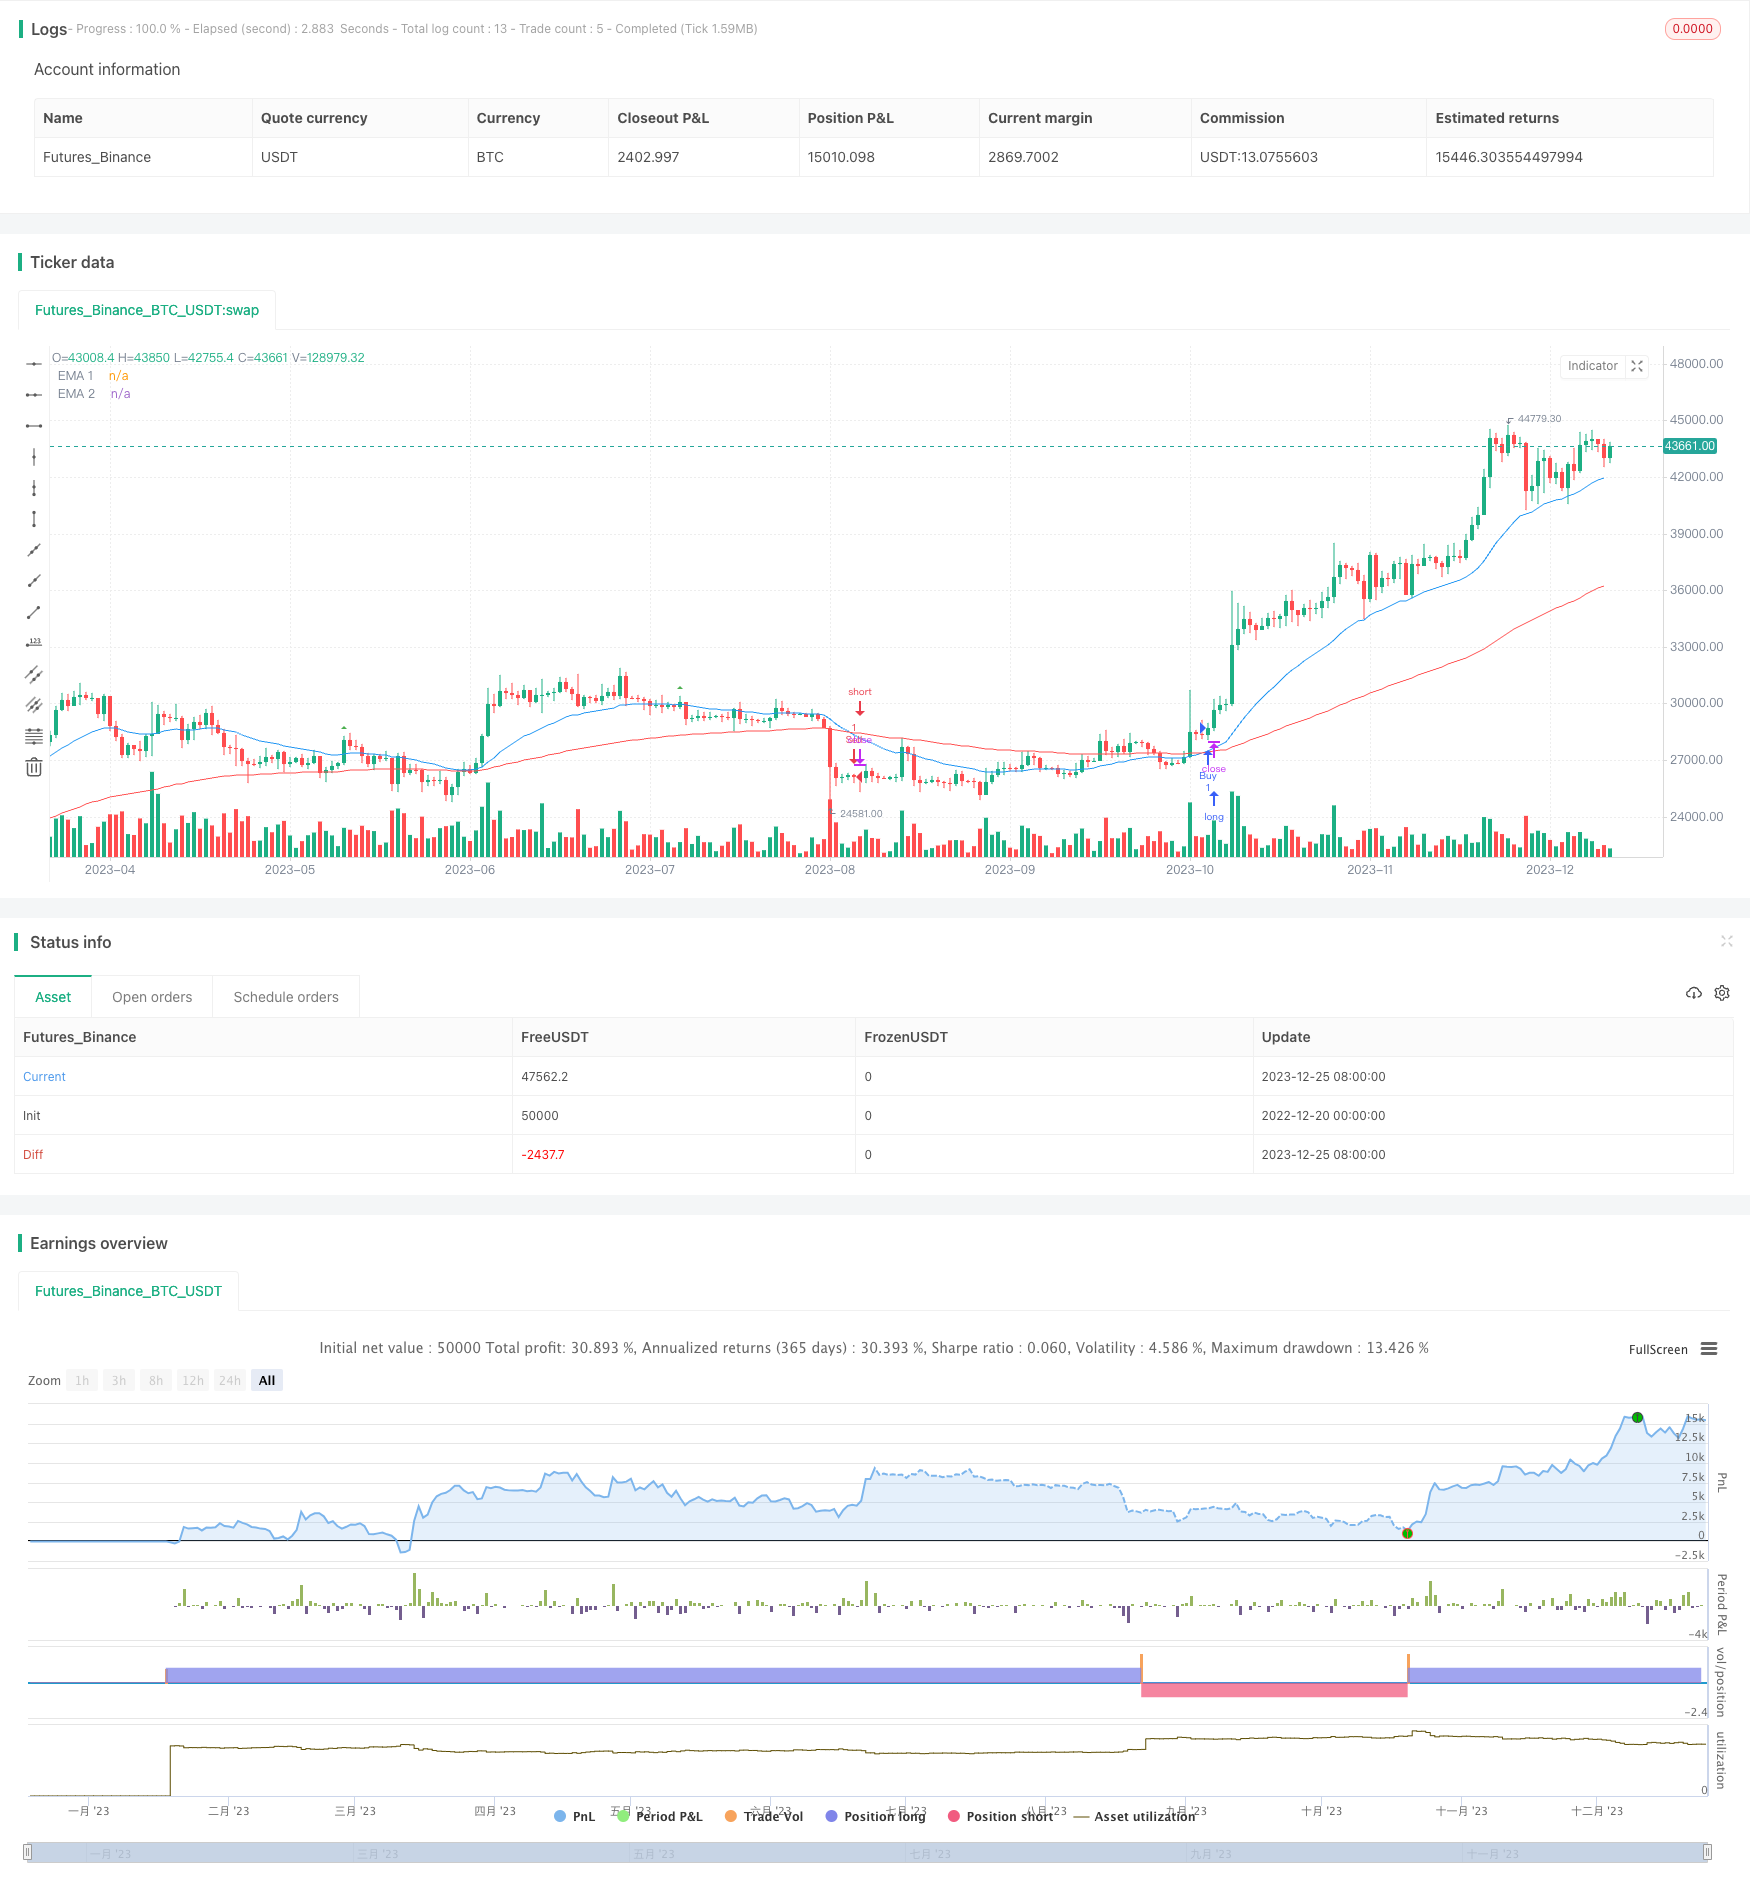
动量指标交叉策略(Momentum Indicator Crossover Strategy)是一个结合指数移动平均线(Exponential Moving Average,EMA)和相对强弱指标(Relative Strength Index,RSI)信号的交易方法。该策略旨在利用两条EMA线的交叉产生买入和卖出信号,从而在金融市场中进行交易。
该策略的核心是EMA的快慢线交叉系统。策略中定义了三条不同参数的EMA线:ema1、ema2和ema3。其中,ema1代表短期趋势,ema2代表中期趋势,ema3代表长期趋势。当短期趋势上穿中期趋势时,产生买入信号;当短期趋势下穿中期趋势时,产生卖出信号。
为过滤错诊信号,策略还定义了两个附加条件:bodybar1 > bodybar2和close > entrybar(买入信号)或close < entrybar(卖出信号)。这确保最近两根K线的实体 길度关系符合信号方向,并且价格突破入场点,避免重复入场。
另外,策略结合RSI指标evalue,RSI高位区域用于定义超买信号,RSI低位区域用于定义超卖信号。这有助于避免在价格过热和过冷的市场中产生错误信号。
该策略具有以下优势:
- 使用方法简单易行,用户无需掌握复杂指标就可以使用。
- 可以根据投入资金的百分比灵活调整仓位大小。
- EMA交叉结合RSI过滤,可以提高信号的可靠性。
- 交易逻辑清晰,易于理解和调整。
该策略也存在以下风险:
- EMA交叉并不能完全过滤市场噪音,容易产生假信号。
- 固定参数的EMA线无法实时适应市场变化。
- 没有止损逻辑,无法控制单笔损失。
- RSI过滤条件单一,可能错过部分机会。
该策略可以从以下几个方向进行优化:
- 基于市场波动率和交易品种设定自适应EMA参数,提高参数的实时性。
- 结合其他指标如MACD、布林带等进行多重过滤,减少假信号。
- 增加跟踪止损、获利止盈功能,控制交易风险。
- 优化RSI的过滤逻辑,提高策略整体稳定性。
- 结合机器学习技术动态优化策略参数。
动量指标交叉策略整合了EMA和RSI的优势,基于指标交叉形成交易信号。该策略简单实用,适合初学者使用,也可根据实际需要进行扩展和优化,提升策略效果。通过严格的风险管理,该策略有望取得稳定的超额收益。
||
The Momentum Indicator Crossover Strategy is a trading approach based on the combination of Exponential Moving Average (EMA) and Relative Strength Index (RSI) signals. Designed to leverage buy and sell signals based on the crossover of two EMA lines, this strategy offers simplicity and effectiveness in managing trades in the financial markets.
The core of this strategy is the crossover system of fast and slow EMA lines. The strategy defines three EMA lines with different parameters: ema1, ema2 and ema3. Among them, ema1 represents short-term trend, ema2 represents medium-term trend, and ema3 represents long-term trend. When the short-term trend crosses above the medium-term trend, a buy signal is generated. When the short-term trend falls below the medium-term trend, a sell signal is generated.
To filter false signals, the strategy also defines two additional conditions: bodybar1 > bodybar2 and close > entrybar (for buy signal) or close < entrybar (for sell signal). This ensures that the recent two candlesticks meet the direction of the signal, and the price breaks through the entry point to avoid redundant entry.
In addition, the strategy incorporates the RSI indicator to evaluate overbought and oversold conditions. The overbought area of RSI is used to define excessive buying signals, while the oversold area is used to define excessive selling signals. This helps avoid wrong signals in overheated and over-cooled markets.
The advantages of this strategy include:
- Simple and easy to use. Users do not need to grasp complex indicators.
- Flexible position sizing based on percentage of invested capital.
- EMA crossover combined with RSI filter improves signal reliability.
- Clear trading logic, easy to understand and adjust.
The risks of this strategy include:
- EMA crossovers cannot fully filter market noise and can easily generate false signals.
- Fixed parameter EMA lines cannot adapt to market changes in real time.
- No stop loss logic cannot control single loss.
- RSI filter conditions are too simple, possibly missing opportunities.
The strategy can be optimized in the following aspects:
- Set adaptive EMA parameters based on market volatility and trading products to improve parameter timeliness.
- Incorporate multiple filters such as MACD, Bollinger Bands, etc. to reduce false signals.
- Add tracking stop loss, take profit functions to control trading risks.
- Optimize RSI filter logic to improve overall strategy stability.
- Dynamically optimize strategy parameters with machine learning techniques.
The Momentum Indicator Crossover Strategy integrates the strengths of EMA and RSI and forms trading signals based on indicator crossovers. The strategy is simple and practical, suitable for beginners, and can also be expanded and optimized according to actual needs to improve strategy performance. With strict risk management, the strategy promises stable excess returns.
[/trans]
Strategy Arguments
| Argument | Default | Description |
|---|---|---|
| v_input_1 | true | Position Size (%) |
| v_input_int_1 | 25 | EMA 1 |
| v_input_2_close | 0 | Source: close |
| v_input_int_2 | 100 | EMA 2 |
| v_input_3_close | 0 | Source: close |
| v_input_int_3 | 200 | EMA 3 |
| v_input_4_close | 0 | Source: close |
| v_input_5 | 14 | RSI length |
Source (PineScript)
/*backtest
start: 2022-12-20 00:00:00
end: 2023-12-26 00:00:00
period: 1d
basePeriod: 1h
exchanges: [{"eid":"Futures_Binance","currency":"BTC_USDT"}]
*/

//@version=5
strategy('EMA Crossover Strategy', shorttitle='EMA Crossover', overlay=true)


// Define input for position size as a percentage of equity
position_size_pct = input(1, title='Position Size (%)') / 100

//Input EMA
len1 = input.int(25, minval=1, title='EMA 1')
src1 = input(close, title='Source')
ema1 = ta.ema(src1, len1)
len2 = input.int(100, minval=1, title='EMA 2')
src2 = input(close, title='Source')
ema2 = ta.ema(src2, len2)
len3 = input.int(200, minval=1, title='EMA 3')
src3 = input(close, title='Source')
ema3 = ta.ema(src3, len3)
//End of format

//Format RSI
lenrsi = input(14, title='RSI length')
outrsi = ta.rsi(close,lenrsi)
//plot(outrsi, title='RSI', color=color.new(color.blue, 0), linewidth=1)

//hline(70, 'Overbought', color=color.red)
//hline(30, 'Oversold', color=color.green)
//End of format


bodybar1 = math.abs(close - open)
bodybar2 = math.abs(close[1] - open[1])
// Plot the EMAs
plot(ema1, color=color.new(color.blue, 0), title='EMA 1')
plot(ema2, color=color.new(color.red, 0), title='EMA 2')
//plot(ema3, color=color.new(#ffffff, 0), title='EMA 3')

// EMA Crossover conditions
emaCrossoverUp = ta.crossover(ema1, ema2)
emaCrossoverDown = ta.crossunder(ema1, ema2)

var entrybar = close  // Initialize entrybar with the current close


// Calculate crossovers outside of the if statements
emaCrossoverUpOccured = ta.crossover(close, ema1) and ema1 > ema2 and bodybar1 > bodybar2 and close > entrybar
emaCrossoverDownOccured = ta.crossunder(close, ema1) and ema1 < ema2 and bodybar1 > bodybar2 and close < entrybar

plotshape(series=emaCrossoverUpOccured, location=location.abovebar, color=color.new(color.green, 0), style=shape.triangleup, title='New Buy Order', size=size.tiny)
plotshape(series=emaCrossoverDownOccured, location=location.belowbar, color=color.new(color.red, 0), style=shape.triangledown, title='New Sell Order', size=size.tiny)

// Define trading logic with custom position size and RSI conditions
if emaCrossoverUp or emaCrossoverUpOccured
    strategy.entry('Buy', strategy.long)
    entrybar := close  // Update entrybar when entering a new buy position
    entrybar

if emaCrossoverDown or emaCrossoverDownOccured
    strategy.entry('Sell', strategy.short)
    entrybar := close  // Update entrybar when entering a new sell position
    entrybar
Detail
https://www.fmz.com/strategy/436787
Last Modified
2023-12-27 17:04:33
