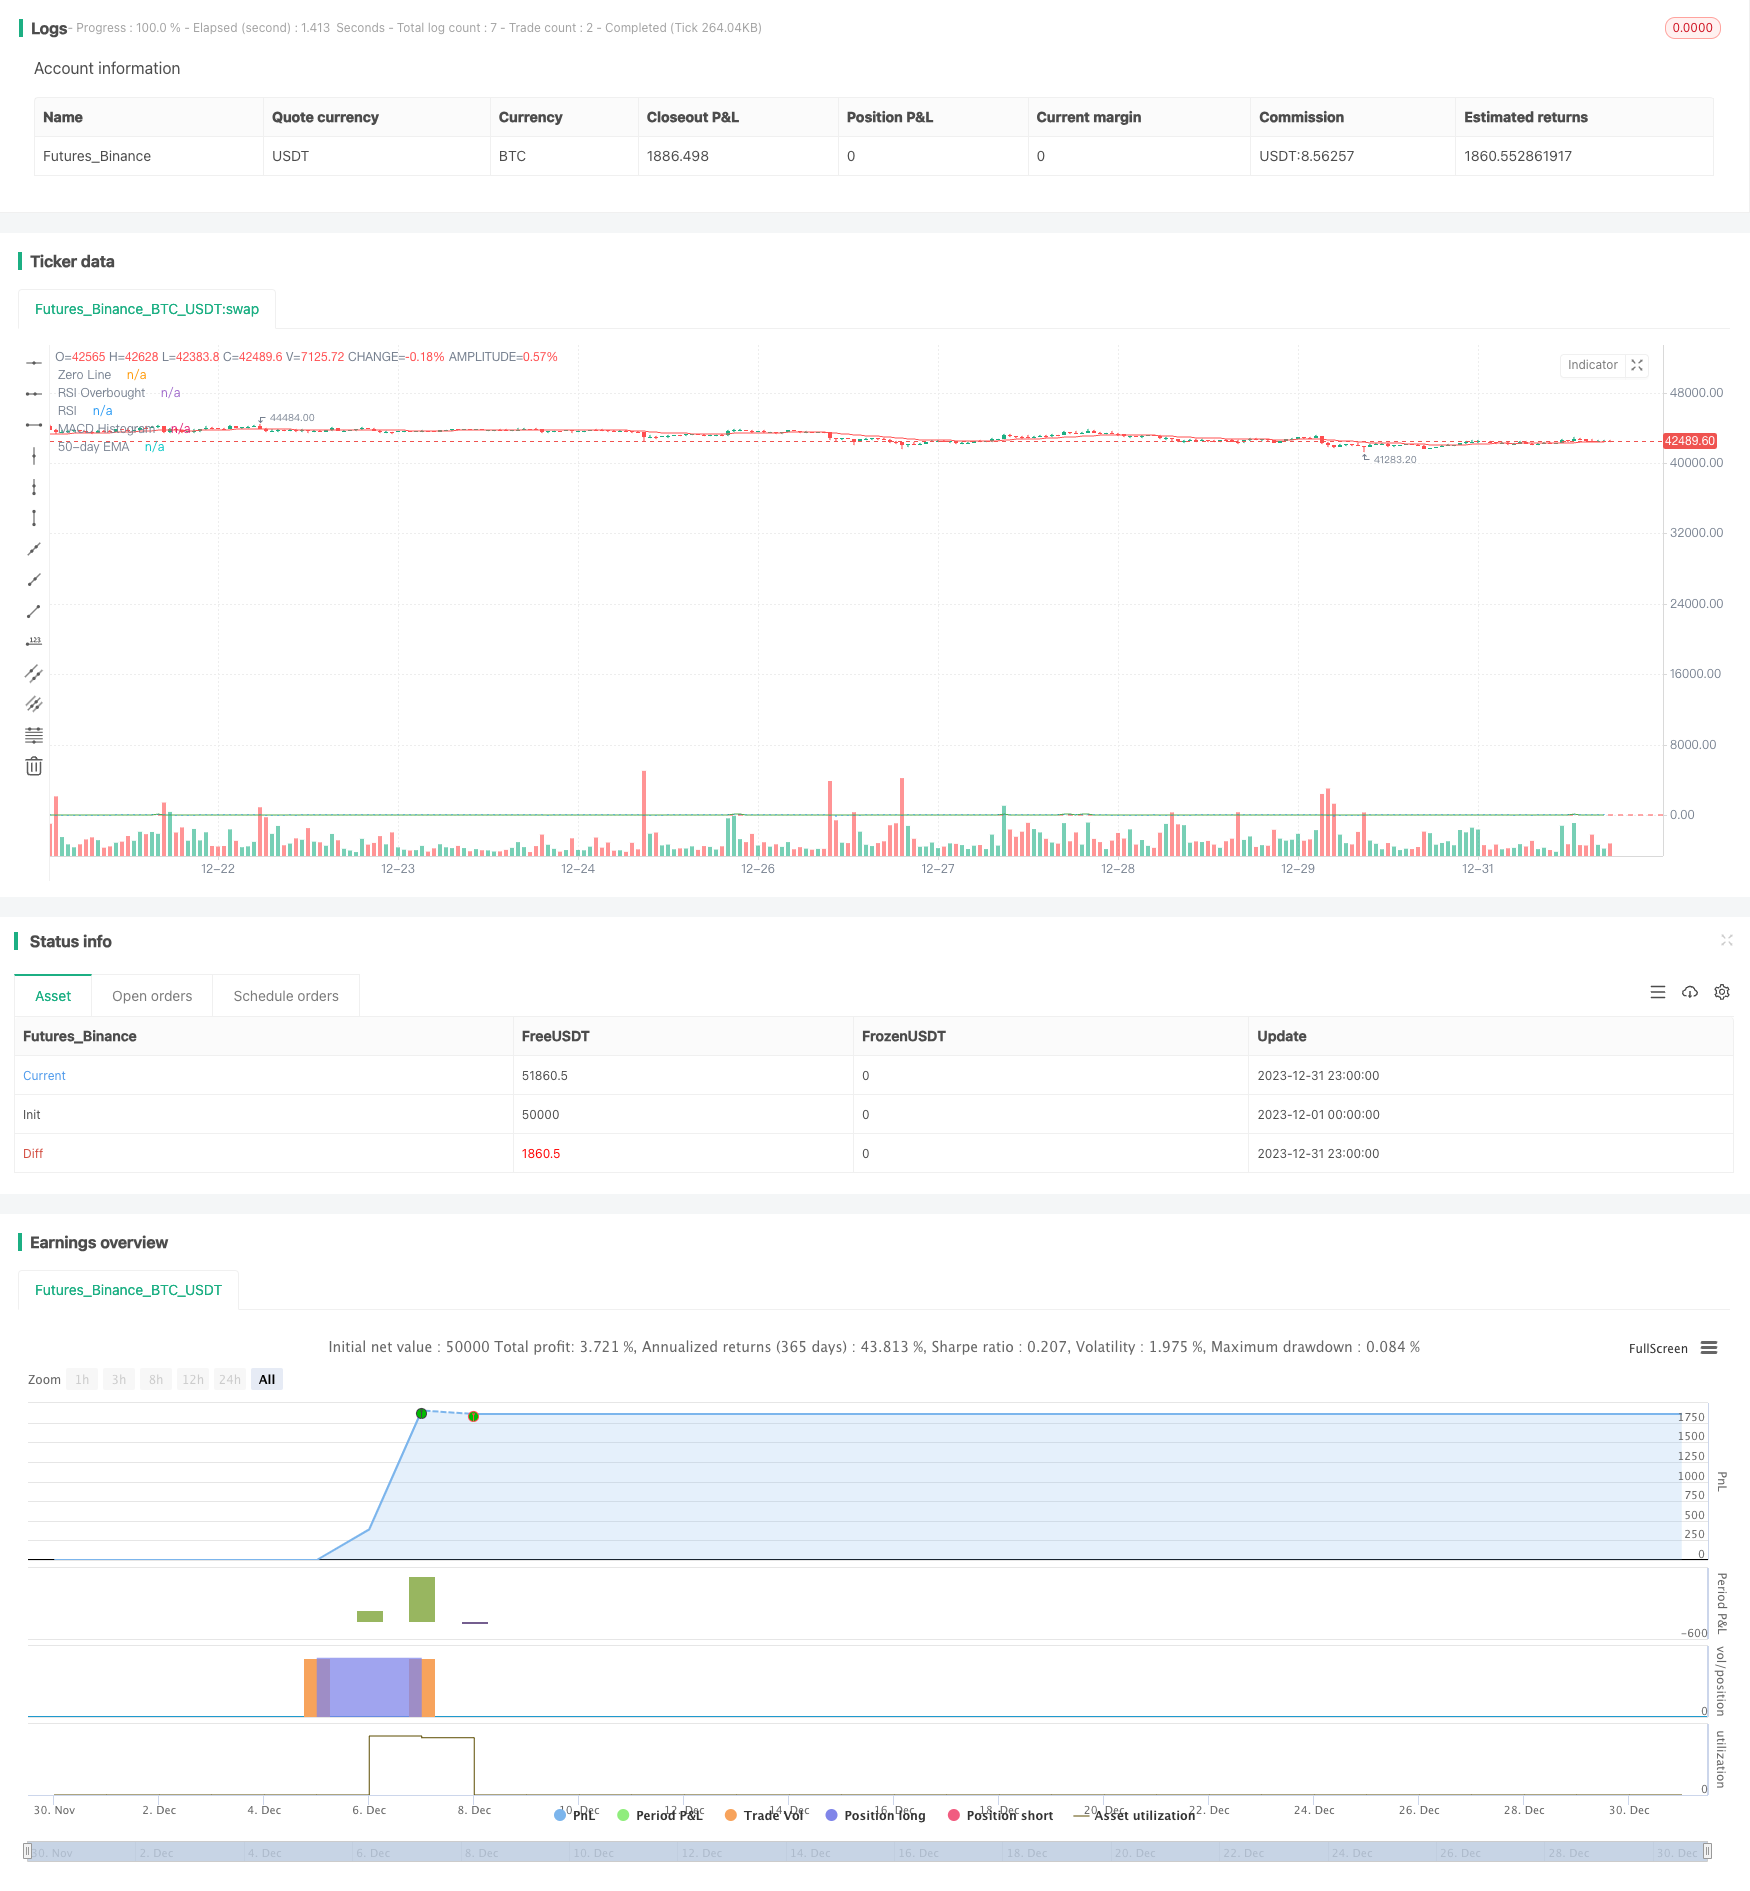
Name
动量突破金叉策略Momentum-Breakthrough-Golden-Cross-Strategy
Author
ChaoZhang
Strategy Description
这是一个结合MACD,RSI和EMA移动平均线的量化交易策略。它利用MACD金叉做多,RMSI高位反转和价格跌破EMA移动平均线作为止损退出的方式,实现追踪市场中长线趋势的效果。
该策略主要基于以下三个指标进行交易信号判断和策略实现:
-
MACD:计算快线,慢线和MACD柱。策略通过快慢线金叉来判断买入时机。
-
RSI:计算14周期的RSI值,并设置超买超卖线。策略利用周线RSI高位反转来避免超买的风险。
-
EMA:计算50日EMA均线。策略通过价格跌破该均线来设置止损点,控制亏损风险。
在 MACD 快线从下方向上突破慢线形成金叉时产生买入信号。同时要求此时的周线 RSI 指标高于 50,即表示处于超买的状态,这有利于把握本轮行情的上涨趋势。最后,价格高于 50 日 EMA 移动平均线时才会真正执行买入操作。
若价格跌破 50 日 EMA 移动平均线或 MACD 快慢线发生死叉时,则执行止损平仓操作。
这套策略结合 MACD、RSI 和 EMA 三个指标的优势,实现了较好的突破追踪功能。
-
MACD 金叉具有一定的提前性,可以较早捕捉到市场的买入时机。
-
基于周线 RSI 可以有效过滤掉短期的超买现象,把握本轮中长线上涨的趋势。
-
EMA 止损可以对 sudong 行情作出及时止损,有效控制 DD。
-
整体来说,该策略可以顺利捕捉中长线上的突破机会,在行情向上突破后可以获得不错的收益。
需要注意如下风险:
-
MACD 金叉具有一定的滞后性,可能会错过行情最佳买入点。
-
RSI 和 EMA 的参数设置需要反复测试优化,否则可能失效。
-
突破行情最好的买点并不一定出现在金叉时刻,存在一定的时点风险。
-
止损设置过于宽松可能带来更大的 DD,设置过于严格则容易被突破性阳线突破。
该策略还存在以下几个优化的方向:
-
可以测试优化 MACD 参数组合,找到更佳的平衡点。
-
RSI 周期和超买超卖线也可以进行参数优化。
-
EMA 的移动周期也可以作适当调整,找到更优参数。
-
可以基于高级技术指标对买入时机进行二次确认,例如KDJ指标等的组合。
-
可以测试止损离场策略,采用百分比移动止损或量化止损策略,让止损更加智能化。
本策略总体来说是一个较为典型的追踪型中长线策略。它结合 MACD、RSI 和 EMA 等多个指标对买入时机进行判断,以期获得较优的入场时点。同时也会采取止损措施来控制交易风险。该策略适合中长线追踪型投资者,也还有进一步优化空间。如果参数调整得当,也可以获得较为可观的收益。
||
This is a quantitative trading strategy that combines MACD, RSI and EMA moving average. It uses MACD golden cross for long entry, RMSI overbought reversal and price breakout below EMA as stop loss exit to track the middle-to-long term trends in the market.
The strategy mainly uses the following three indicators for trading signal judgment and strategy implementation:
-
MACD: Calculate fast line, slow line and MACD histogram. The strategy judges the timing of entry by the golden cross of fast and slow lines.
-
RSI: Calculate the 14-period RSI and set the overbought/oversold line. The strategy utilizes the RSI overbought reversal on weekly timeframe to avoid overbought risk.
-
EMA: Calculate the 50-day EMA line. The strategy sets the stop loss point by the price breakout below this line to control the risk of loss.
A buy signal is generated when the MACD fast line crosses above the slow line from below forming a golden cross. At the same time, require the weekly RSI indicator to be above 50, indicating an overbought state, which helps to grasp the upward trend of this round of market. Finally, a long entry will only be executed when the price is above the 50-day EMA line.
If the price breaks below the 50-day EMA or a MACD dead cross occurs, a stop loss exit will be executed.
The advantage of this strategy combines MACD, RSI and EMA indicators to achieve good breakthrough tracking capability:
-
MACD golden cross has some lead characteristic that can capture the buy timing of the market earlier.
-
Based on weekly RSI, it can effectively filter out short-term overbought scenarios and grasp the middle-to-long term uptrend.
-
The EMA stop loss can make timely stop losses on sudden down trends, effectively controlling DD.
-
Overall, this strategy can smoothly capture middle-to-long term breakthrough opportunities and gain decent returns after the market breaks out upwards.
Pay attention to the following risks:
-
MACD golden cross has some lagging properties that may miss the optimal entry point of the market.
-
The parameter settings of RSI and EMA need repeated testing and optimization, otherwise they may become invalid.
-
The best buying point of a breakthrough market does not necessarily appear at the moment of golden cross, there is some timing risk.
-
A stop loss set too loose may lead to larger DD, while a stop loss set too tight may easily be broken by breakthrough yang line.
There are still several optimization directions for this strategy:
-
Test and optimize the MACD parameter combination to find a better balance point.
-
The RSI cycle and overbought/oversold line can also be optimized.
-
The moving cycle of EMA can also be adjusted appropriately to find better parameters.
-
Secondary confirmation of the entry timing can be made based on advanced technical indicators, such as the KDJ indicator.
-
Test stop loss exit strategies by adopting percentage-based moving stop loss or quantitative stop loss to make the stop loss smarter.
In general, this strategy is a typical mid-to-long term tracking strategy. It combines multiple indicators such as MACD, RSI and EMA to judge the timing of entry in order to obtain a better entry point. It also adopts stop loss measures to control trading risks. The strategy suits middle-to-long term tracking investors, and there is still room for further optimization. With proper parameter tuning, decent returns can also be obtained.
[/trans]
Strategy Arguments
| Argument | Default | Description |
|---|---|---|
| v_input_1 | 5 | Fast Length |
| v_input_2 | 13 | Slow Length |
| v_input_3 | 9 | Signal Length |
| v_input_4 | 21 | EMA Length |
| v_input_5 | 14 | RSI Length |
| v_input_6 | 50 | RSI Overbought Level |
Source (PineScript)
/*backtest
start: 2023-12-01 00:00:00
end: 2023-12-31 23:59:59
period: 1h
basePeriod: 15m
exchanges: [{"eid":"Futures_Binance","currency":"BTC_USDT"}]
*/

//@version=5
strategy("MACD, EMA, and RSI Strategy", overlay=true)

// Input for MACD
fastLength = input(5, title="Fast Length")
slowLength = input(13, title="Slow Length")
signalLength = input(9, title="Signal Length")

// Input for EMA
emaLength = input(21, title="EMA Length")

// Input for RSI
rsiLength = input(14, title="RSI Length")
rsiOverbought = input(50, title="RSI Overbought Level")

// Calculate MACD on the weekly timeframe
[macdLine, signalLine, _] = ta.macd(close, fastLength, slowLength, signalLength)

// Calculate 50-day EMA
ema50 = ta.ema(close, emaLength)

// Calculate RSI on the weekly timeframe
rsi = ta.rsi(close, rsiLength)

// Condition for Buy Entry
buyCondition = ta.crossover(macdLine, 0) and dayofweek == dayofweek.monday and rsi > rsiOverbought

// Condition for Sell Exit
sellCondition = ta.crossunder(close, ema50) or ta.crossunder(macdLine, 0)

// Execute Buy Entry on the next day's open
if buyCondition
    strategy.entry("My Long Entry Id", strategy.long)

// Execute Sell Exit on the next day's open
if sellCondition
    strategy.close("My Long Entry Id")

// Plotting MACD and EMA
plot(macdLine - signalLine, title="MACD Histogram", color=color.blue, style=plot.style_histogram)
hline(0, "Zero Line", color=color.gray)
plot(ema50, title="50-day EMA", color=color.red)

// Plotting RSI
hline(rsiOverbought, "RSI Overbought", color=color.red)
plot(rsi, title="RSI", color=color.green)
Detail
https://www.fmz.com/strategy/440313
Last Modified
2024-01-29 11:27:31
