Name
动量突破银线策略Momentum-Breakthrough-Silver-Line-Strategy
Author
ChaoZhang
Strategy Description
该策略是一个基于价格动量指标MACD和均线的突破买入策略,适用于白银(XAG/USD, XAG/EUR)的1小时时间周期。关键点在于结合价格趋势和动量指标判断趋势反转的时机。
当MACD柱状线由负转正且连续上升突破信号线时,表示短期涨势较强;同时如果收盘价突破上升趋势的均线,则产生多头信号。类似的,MACD柱状线由正转负且跌破信号线,并且收盘价跌破下降趋势的均线时,产生空头信号。
具体来说,该策略判断长仓入场信号的条件是:
- MACD柱状线为正
- 当前柱状线高于上一根柱状线
- 收盘价高于均线
- 收盘价高于近3根K线的最高价
判断短仓入场信号的条件则刚好相反。
一旦开仓,在下一根K线收盘时无条件平仓。该策略不设置止盈止损点,追求捕捉趋势爆发的始动点。
该策略结合了价格和动量指标,能较为准确地判断趋势反转的时机,胜率较高。无条件下一根K线收盘平仓的方式,可以有效规避反转失败后的再次损失。
不设置止盈止损,全仓开仓,满足追求高收益的投资者的需求。
无止损设置容易被套牢,亏损风险大。若反转信号失败,无法及时止损,可能面临较大的资金损失。
无条件下一根K线收盘就平仓的方式,很难持续捕捉趋势行情的利润。
可以考虑在胜率较高的突破买入基础上,增加适当的止损策略,降低亏损风险。
也可以结合高级技巧,在平仓后设置再开仓的机制,尝试持续捕捉趋势利润。
该策略总体来说属于积极进攻型的高风险策略,由于无止损设置,需要投资者承受较大的亏损风险。但相对的,成功反转后第一时间全仓开仓也可以获得高额收益。适合有较强心理承受能力的积极投资者。
||
This strategy is a breakout strategy based on the price momentum indicator MACD and moving average, suitable for 1-hour timeframe on silver (XAG/USD, XAG/EUR). The key is to combine price trends and momentum indicators to determine the timing of trend reversals.
When the MACD histogram changes from negative to positive and continuously breaks through the signal line, it indicates that the short-term uptrend is stronger. At the same time, if the closing price breaks through the rising trend of the moving average, it generates a long signal. Similarly, when the MACD histogram changes from positive to negative and falls below the signal line, and the closing price falls below the downward trend of the moving average, it generates a short signal.
Specifically, the conditions for determining the long entry signal of this strategy are:
- The MACD histogram is positive
- The current histogram bar is higher than the previous one
- The closing price is higher than the moving average
- The closing price is higher than the highest price of the recent 3 K-lines
The conditions for determining the short entry signal are just the opposite.
Once the position is opened, it is closed unconditionally when the next K-line closes. This strategy does not set profit taking or stop loss points, aiming to capture the starting point of trend outbreaks.
This strategy combines price and momentum indicators to determine the timing of trend reversals more accurately with a higher winning rate. The way of unconditional closing in the next K line can effectively avoid the loss again after the reversal fails.
No setting of profit taking and stop loss meets the needs of investors pursuing high returns.
Lack of stop loss can easily lead to loss fixation and higher risk of loss. If the reversal signal fails, loss may mount due to the inability to stop loss in time.
The way of unconditional closing in the next K line makes it difficult to continuously capture trend profits.
It’s possible to consider adding appropriate stop-loss strategies on the basis of high-win breakthrough buys to reduce risk of loss.
It’s also possible to combine advanced techniques to re-enter positions after closing, attempting to continuously capture trend profits.
In general, this strategy belongs to an aggressive high-risk strategy. Due to no stop loss setting, investors need to bear greater risk of loss. But if the reversal is successful, the opportunity to open positions with full lots in the first place can also result in high returns. It is suitable for aggressive investors with relatively strong psychological endurance.
[/trans]
Strategy Arguments
| Argument | Default | Description |
|---|---|---|
| v_input_1 | true | From Day |
| v_input_2 | true | From Month |
| v_input_3 | 2020 | From Year |
| v_input_4 | 31 | To Day |
| v_input_5 | 12 | To Month |
| v_input_6 | 2020 | To Year |
| v_input_7 | 10 | Length |
| v_input_8_close | 0 | Source: close |
| v_input_9 | 12 | Fast Length |
| v_input_10 | 26 | Slow Length |
| v_input_11 | 9 | Signal Smoothing |
| v_input_12 | false | Simple MA(Oscillator) |
| v_input_13 | false | Simple MA(Signal Line) |
| v_input_14 | true | option1 |
| v_input_15 | true | option2 |
Source (PineScript)
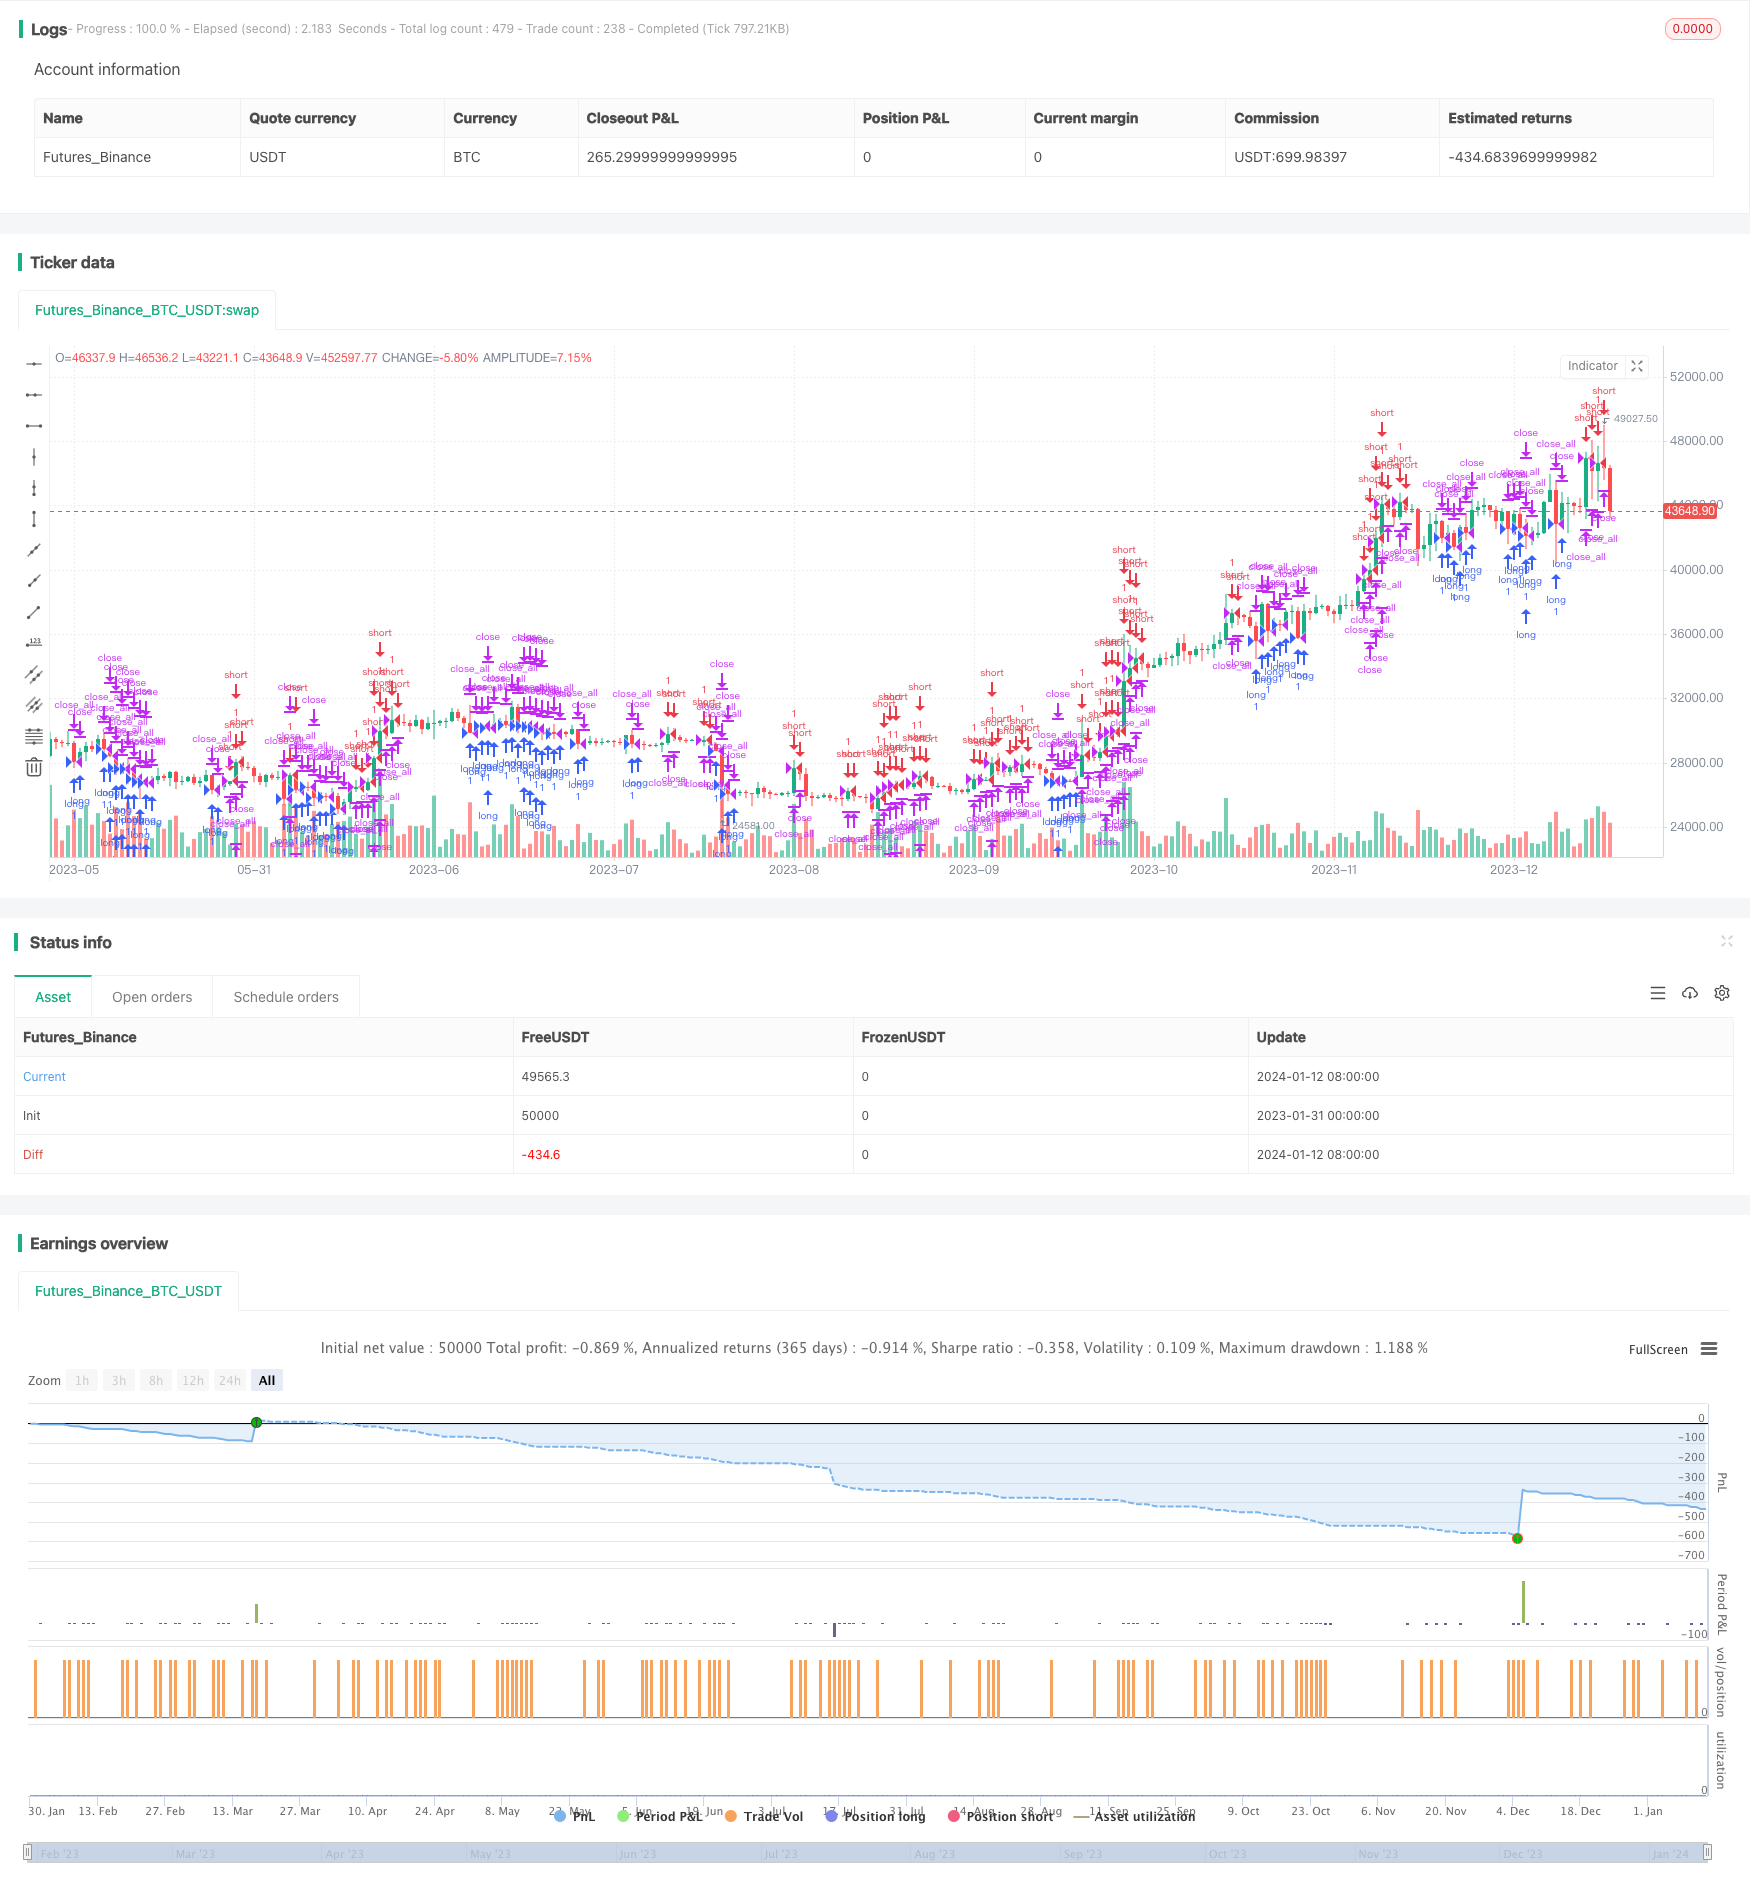
/*backtest
start: 2023-01-31 00:00:00
end: 2024-01-13 05:20:00
period: 1d
basePeriod: 1h
exchanges: [{"eid":"Futures_Binance","currency":"BTC_USDT"}]
*/

// This source code is subject to the terms of the Mozilla Public License 2.0 at https://mozilla.org/MPL/2.0/
// © SoftKill21

//@version=4
strategy("XAG strategy 1h",overlay=true)
fromDay = input(defval = 1, title = "From Day", minval = 1, maxval = 31)
fromMonth = input(defval = 1, title = "From Month", minval = 1, maxval = 12)
fromYear = input(defval = 2020, title = "From Year", minval = 1970)
var gica = 0
var marcel = gica+2
 //monday and session
// To Date Inputs
toDay = input(defval = 31, title = "To Day", minval = 1, maxval = 31)
toMonth = input(defval = 12, title = "To Month", minval = 1, maxval = 12)
toYear = input(defval = 2020, title = "To Year", minval = 1970)

startDate = timestamp(fromYear, fromMonth, fromDay, 00, 00)
finishDate = timestamp(toYear, toMonth, toDay, 00, 00)
time_cond = true
len = input(10, minval=1, title="Length")
src = input(close, title="Source")
out = sma(src, len)

//distanta = input(1.004)

fast_length = input(title="Fast Length", type=input.integer, defval=12)
slow_length = input(title="Slow Length", type=input.integer, defval=26)
signal_length = input(title="Signal Smoothing", type=input.integer, minval = 1, maxval = 50, defval = 9)
sma_source = input(title="Simple MA(Oscillator)", type=input.bool, defval=false)
sma_signal = input(title="Simple MA(Signal Line)", type=input.bool, defval=false)
// Plot colors
col_grow_above = #26A69A
col_grow_below = #FFCDD2
col_fall_above = #B2DFDB
col_fall_below = #EF5350
col_macd = #0094ff
col_signal = #ff6a00
// Calculating
fast_ma = sma_source ? sma(src, fast_length) : ema(src, fast_length)
slow_ma = sma_source ? sma(src, slow_length) : ema(src, slow_length)
macd = fast_ma - slow_ma
signal = sma_signal ? sma(macd, signal_length) : ema(macd, signal_length)
hist = macd - signal

option1=input(true)
option2=input(true)

long2 =  close > open  and time_cond and close > out and hist > 0 and hist > hist[1]
short2 =  close < open  and time_cond and close < out and hist < 0 and hist < hist[1]

long1 = (close > open ) and time_cond and close > out and hist > 0 and  hist > hist[1] and high > high[1] and high[1] > high[2] and close > high[1] and close > high[2] and close > high[3]
short1 = (close < open)  and time_cond and close < out and hist < 0 and  hist < hist[1] and low < low[1] and low[1] < low[2]  and close < low[1] and close < low[2] and close < low[3]

if(option1)
    strategy.entry("long",1,when= short1)
    strategy.entry("short",0,when=long1)
    strategy.close_all()

if(option2)

    strategy.entry("long",1,when= short2)
    strategy.entry("short",0,when=long2)
    strategy.close_all()

// if(strategy.openprofit < 0)
//     strategy.close_all()
// if(strategy.openprofit>0)
//     strategy.close("long",when = close < open )
//     strategy.close("short",when = close > open)
//     strategy.close("long",when= close < open)
//     strategy.close("short",when= close> open)


// tp = input(0.0003)
// sl = input(0.005)
// strategy.exit("closelong", "long" , profit = close * tp / syminfo.mintick, loss = close * sl / syminfo.mintick, alert_message = "closelong")
// strategy.exit("closeshort", "short" , profit = close * tp / syminfo.mintick, loss = close * sl / syminfo.mintick, alert_message = "closeshort")
Detail
https://www.fmz.com/strategy/440727
Last Modified
2024-02-01 15:01:55