Name
动量绝对值指标策略Absolute-Momentum-Indicator-Strategy
Author
ChaoZhang
Strategy Description
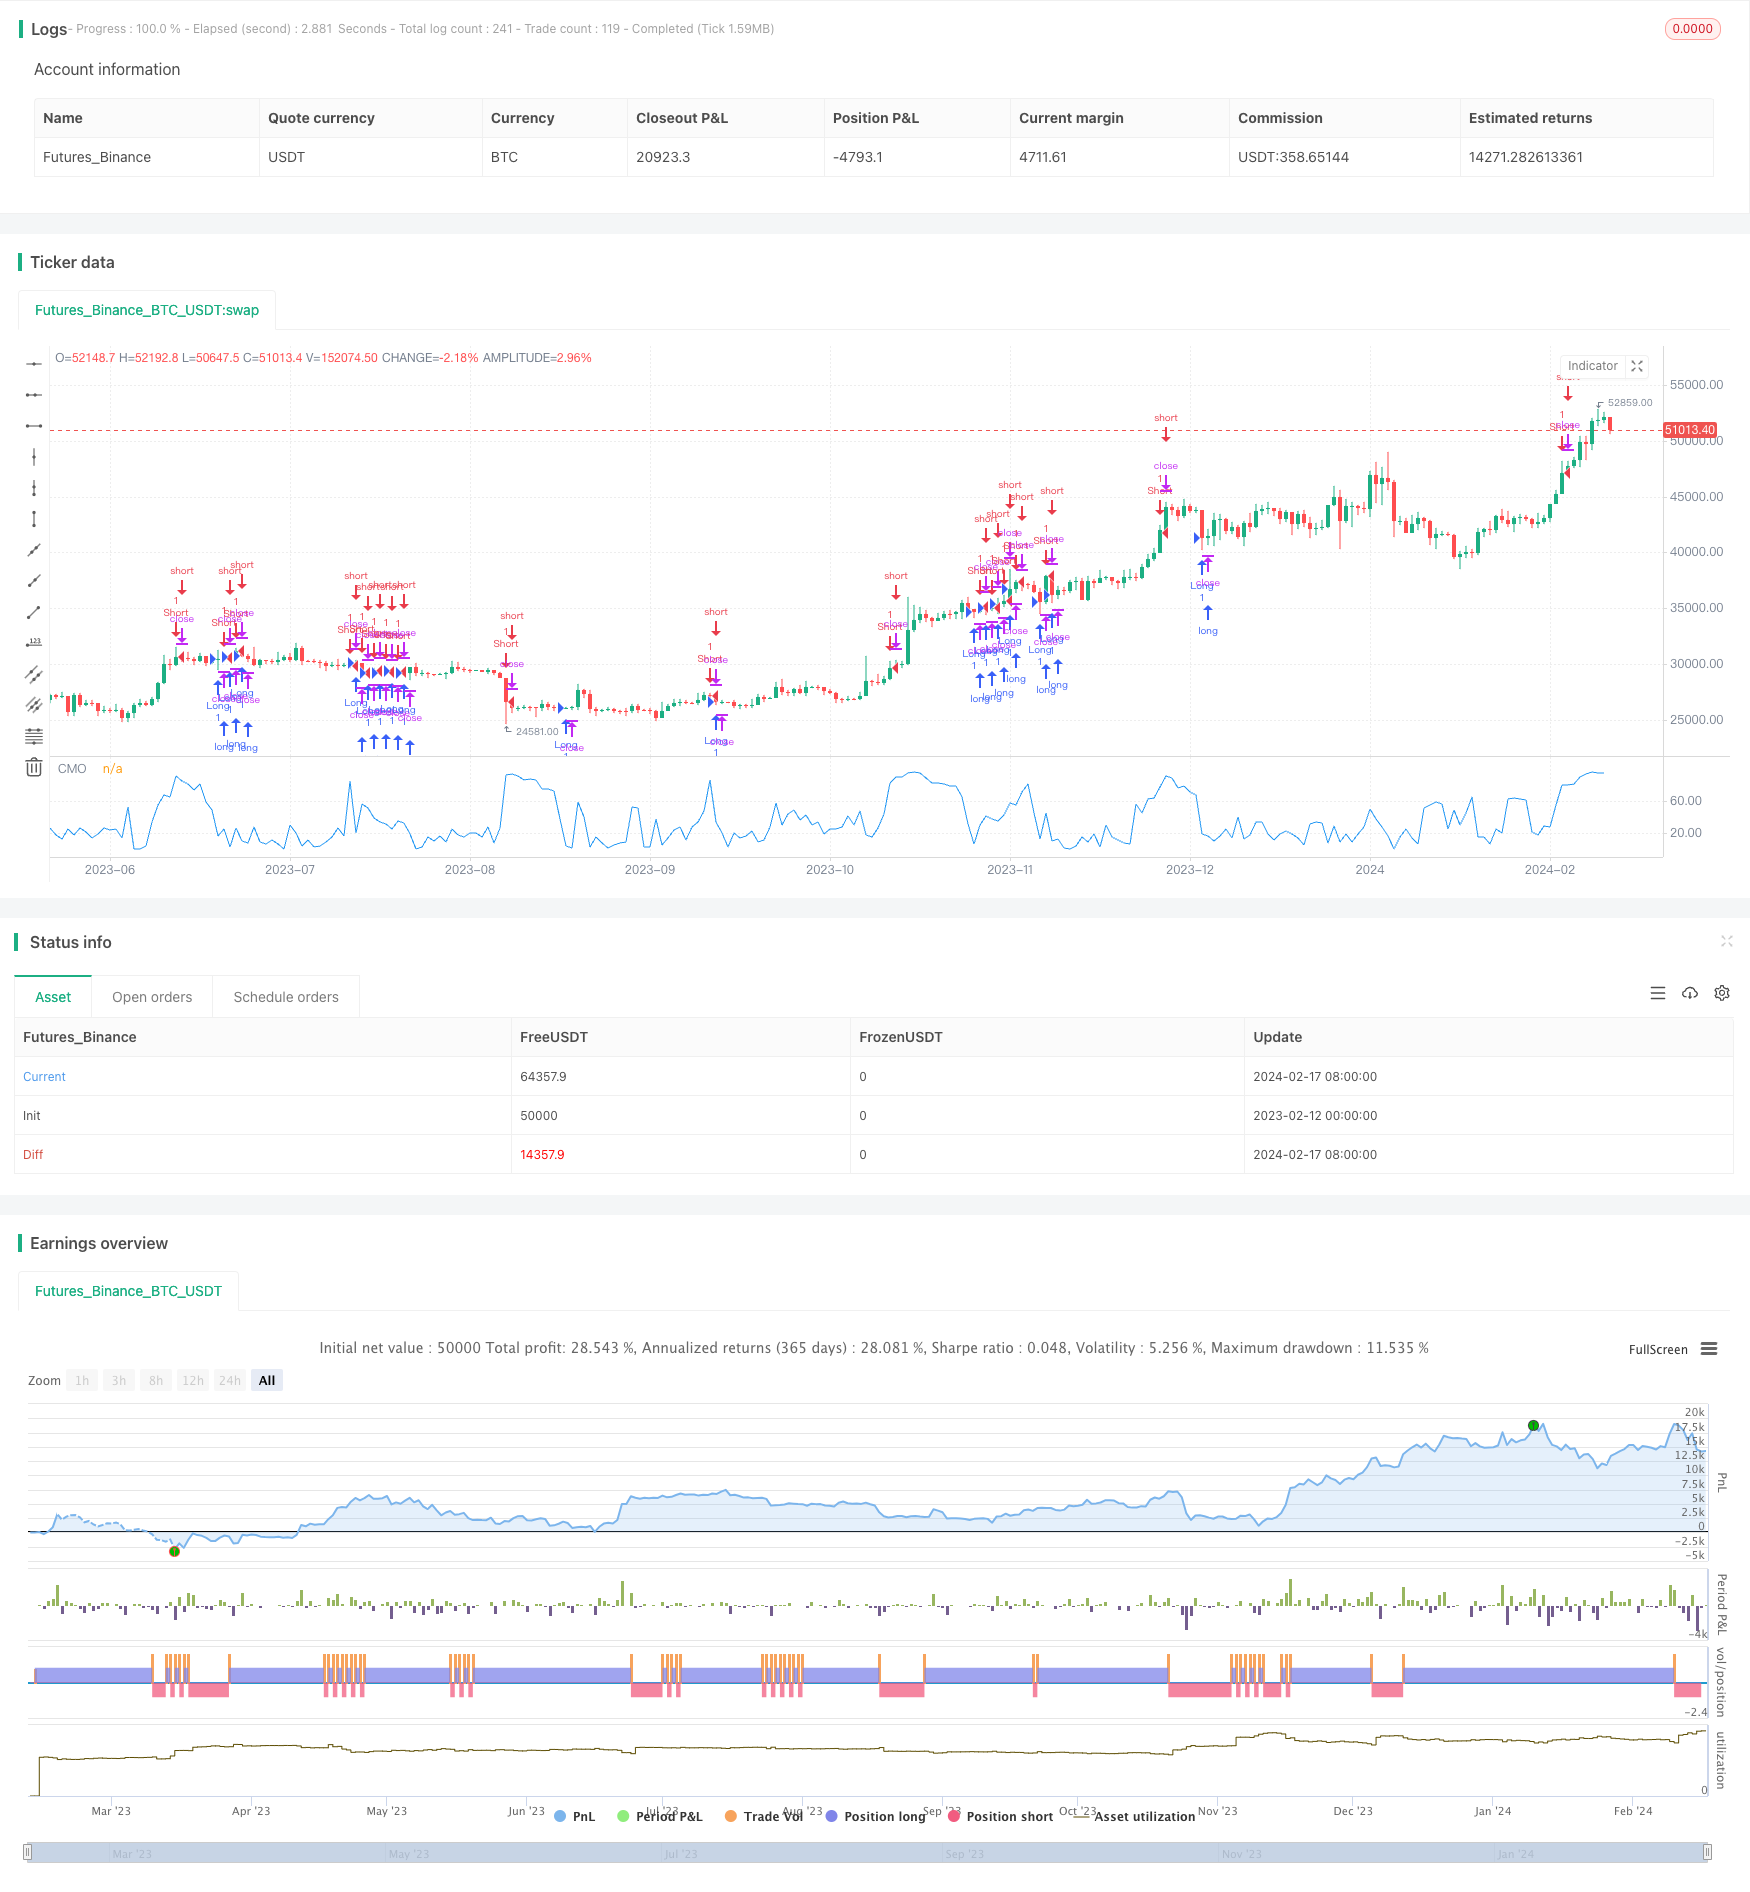
动量绝对值指标策略是基于Tushar Chande开发的动量指标CMO的改进版本。该策略通过计算价格的绝对动量值,判断市场目前是否处于超买或超卖状态,以捕捉市场中期的价格波动。
该策略的核心指标是经过改进的CMO指标,称为AbsCMO。AbsCMO的计算公式为:
AbsCMO = abs(100 * (最新收盘价 - Length周期前的收盘价) / (Length周期内价格波动绝对值的简单移动平均 * Length))
其中,Length代表平均期间长度。AbsCMO值区间为0至100。该指标结合了动量方向性和强度 monumentality,能清晰判断市场中期趋势和超买超卖区域。
当AbsCMO上穿指定的上轨(默认70)时,表示市场步入超买,做空;当AbsCMO下穿指定的下轨(默认20)时,表示市场步入超卖,做多。
与其他动量指标相比,AbsCMO指标具有如下优势:
- 反映价格绝对动量,判断市场中期趋势更加准确;
- 结合方向性和强度,识别超买超卖更为明确;
- 限定范围在0-100,更适合多个品种之间比较;
- 对于短期剧烈波动不敏感,反应市场中期趋势;
- 可自定义参数,适应性强。
该策略主要存在以下风险:
- 中期指标,对短期波动反应不够灵敏;
- 默认参数可能不适合全部品种,需要优化;
- 长期持仓可能带来较大的回撤。
可以通过适当缩短持仓周期,优化参数,或与其他指标组合使用来减少风险。
该策略可从以下几个方面进行优化:
- 优化AbsCMO的参数,适应更多品种;
- 结合其他指标过滤假信号;
- 制定止损和止盈规则,控制风险;
- 结合深度学习等技术寻找更佳入场点。
动量绝对值指标策略整体来说是一个比较实用的中期交易策略。它反应价格中期绝对动量特性,判断市场中期趋势的判断力较强。但该策略对短期剧烈波动不敏感,存在一定的风险。通过参数优化、指标过滤、止损机制等进一步完善,可以使该策略的实盘表现更加稳定可靠。
||
The Absolute Momentum Indicator Strategy is an improved version based on the momentum indicator CMO developed by Tushar Chande. This strategy judges whether the market is currently overbought or oversold by calculating the absolute value of price momentum to capture medium-term price fluctuations in the market.
The core indicator of this strategy is the improved CMO indicator, called AbsCMO. The calculation formula of AbsCMO is:
AbsCMO = abs(100 * (latest closing price - closing price Length periods ago) / (simple moving average of absolute price fluctuations over Length period * Length))
Where Length represents the length of averaging period. The range of AbsCMO values is from 0 to 100. This indicator combines directionality and strength of momentum monumentality to clearly determine medium-term market trends and overbought/oversold areas.
When AbsCMO breaks through the specified upper rail (default 70), it indicates the market has entered overbought territory and goes short; when AbsCMO breaks through the specified lower rail (default 20), it indicates the market has entered oversold territory and goes long.
Compared with other momentum indicators, the AbsCMO indicator has the following advantages:
- It reflects the absolute momentum of price and judges medium-term trends more accurately;
- It identifies overbought/oversold conditions more clearly by incorporating directionality and strength;
- Its range is limited between 0-100, making it more suitable for comparison across different products;
- It is less sensitive to short-term volatility, reflecting medium-term trends;
- Customizable parameters make it highly adaptable.
The main risks of this strategy are:
- As a medium-term indicator, it is less sensitive to short-term fluctuations;
- The default parameters may not suit all products and need to be optimized;
- Long holding periods can lead to large drawdowns.
These risks could be reduced by shortening holding periods, optimizing parameters, or incorporating other indicators.
This strategy can be optimized from the following aspects:
- Optimize the parameters of AbsCMO to adapt to more products;
- Incorporate other indicators to filter false signals;
- Set stop loss and take profit rules to control risks;
- Leverage technologies like deep learning to find better entry points.
In summary, the Absolute Momentum Indicator Strategy is a useful medium-term trading strategy. It reflects the absolute momentum characteristics of price over the medium term and has strong predictive power of medium-term trends. However, this strategy is less sensitive to short-term fluctuations and carries certain risks. Further improvements like parameter optimization, indicator filters, stop loss mechanisms can make its live performance more steady and reliable.
[/trans]
Strategy Arguments
| Argument | Default | Description |
|---|---|---|
| v_input_1 | 9 | Length |
| v_input_2 | 70 | TopBand |
| v_input_3 | 20 | LowBand |
| v_input_4 | false | Trade reverse |
Source (PineScript)
/*backtest
start: 2023-02-12 00:00:00
end: 2024-02-18 00:00:00
period: 1d
basePeriod: 1h
exchanges: [{"eid":"Futures_Binance","currency":"BTC_USDT"}]
*/

//@version=2
////////////////////////////////////////////////////////////
//  Copyright by HPotter v1.0 17/02/2017
//    This indicator plots the absolute value of CMO. CMO was developed by Tushar
//    Chande. A scientist, an inventor, and a respected trading system developer,
//    Mr. Chande developed the CMO to capture what he calls "pure momentum". For
//    more definitive information on the CMO and other indicators we recommend the
//    book The New Technical Trader by Tushar Chande and Stanley Kroll.
//    The CMO is closely related to, yet unique from, other momentum oriented indicators
//    such as Relative Strength Index, Stochastic, Rate-of-Change, etc. It is most closely
//    related to Welles Wilder`s RSI, yet it differs in several ways:
//        - It uses data for both up days and down days in the numerator, thereby directly
//          measuring momentum;
//        - The calculations are applied on unsmoothed data. Therefore, short-term extreme
//          movements in price are not hidden. Once calculated, smoothing can be applied to
//          the CMO, if desired;
//        - The scale is bounded between +100 and -100, thereby allowing you to clearly see
//          changes in net momentum using the 0 level. The bounded scale also allows you to
//          conveniently compare values across different securities.
//
// You can change long to short in the Input Settings
// Please, use it only for learning or paper trading. Do not for real trading.
////////////////////////////////////////////////////////////

strategy(title="CMOabs", shorttitle="CMOabs")
Length = input(9, minval=1)
TopBand = input(70, minval=1)
LowBand = input(20, minval=0)
reverse = input(false, title="Trade reverse")
// hline(0, color=gray, linestyle=dashed)
// hline(TopBand, color=red, linestyle=line)
// hline(LowBand, color=green, linestyle=line)
xMom = abs(close - close[1])
xSMA_mom = sma(xMom, Length)
xMomLength = close - close[Length]
nRes = abs(100 * (xMomLength / (xSMA_mom * Length)))
pos = iff(nRes > TopBand, -1,
	     iff(nRes < LowBand, 1, nz(pos[1], 0)))
possig = iff(reverse and pos == 1, -1,
          iff(reverse and pos == -1, 1, pos))
if (possig == 1)
    strategy.entry("Long", strategy.long)
if (possig == -1)
    strategy.entry("Short", strategy.short)
barcolor(possig == -1 ? red: possig == 1 ? green : blue )
plot(nRes, color=blue, title="CMO")
Detail
https://www.fmz.com/strategy/442108
Last Modified
2024-02-19 14:13:01
