Name
双均线策略360Dual-Moving-Average-Strategy-360
Author
ChaoZhang
Strategy Description
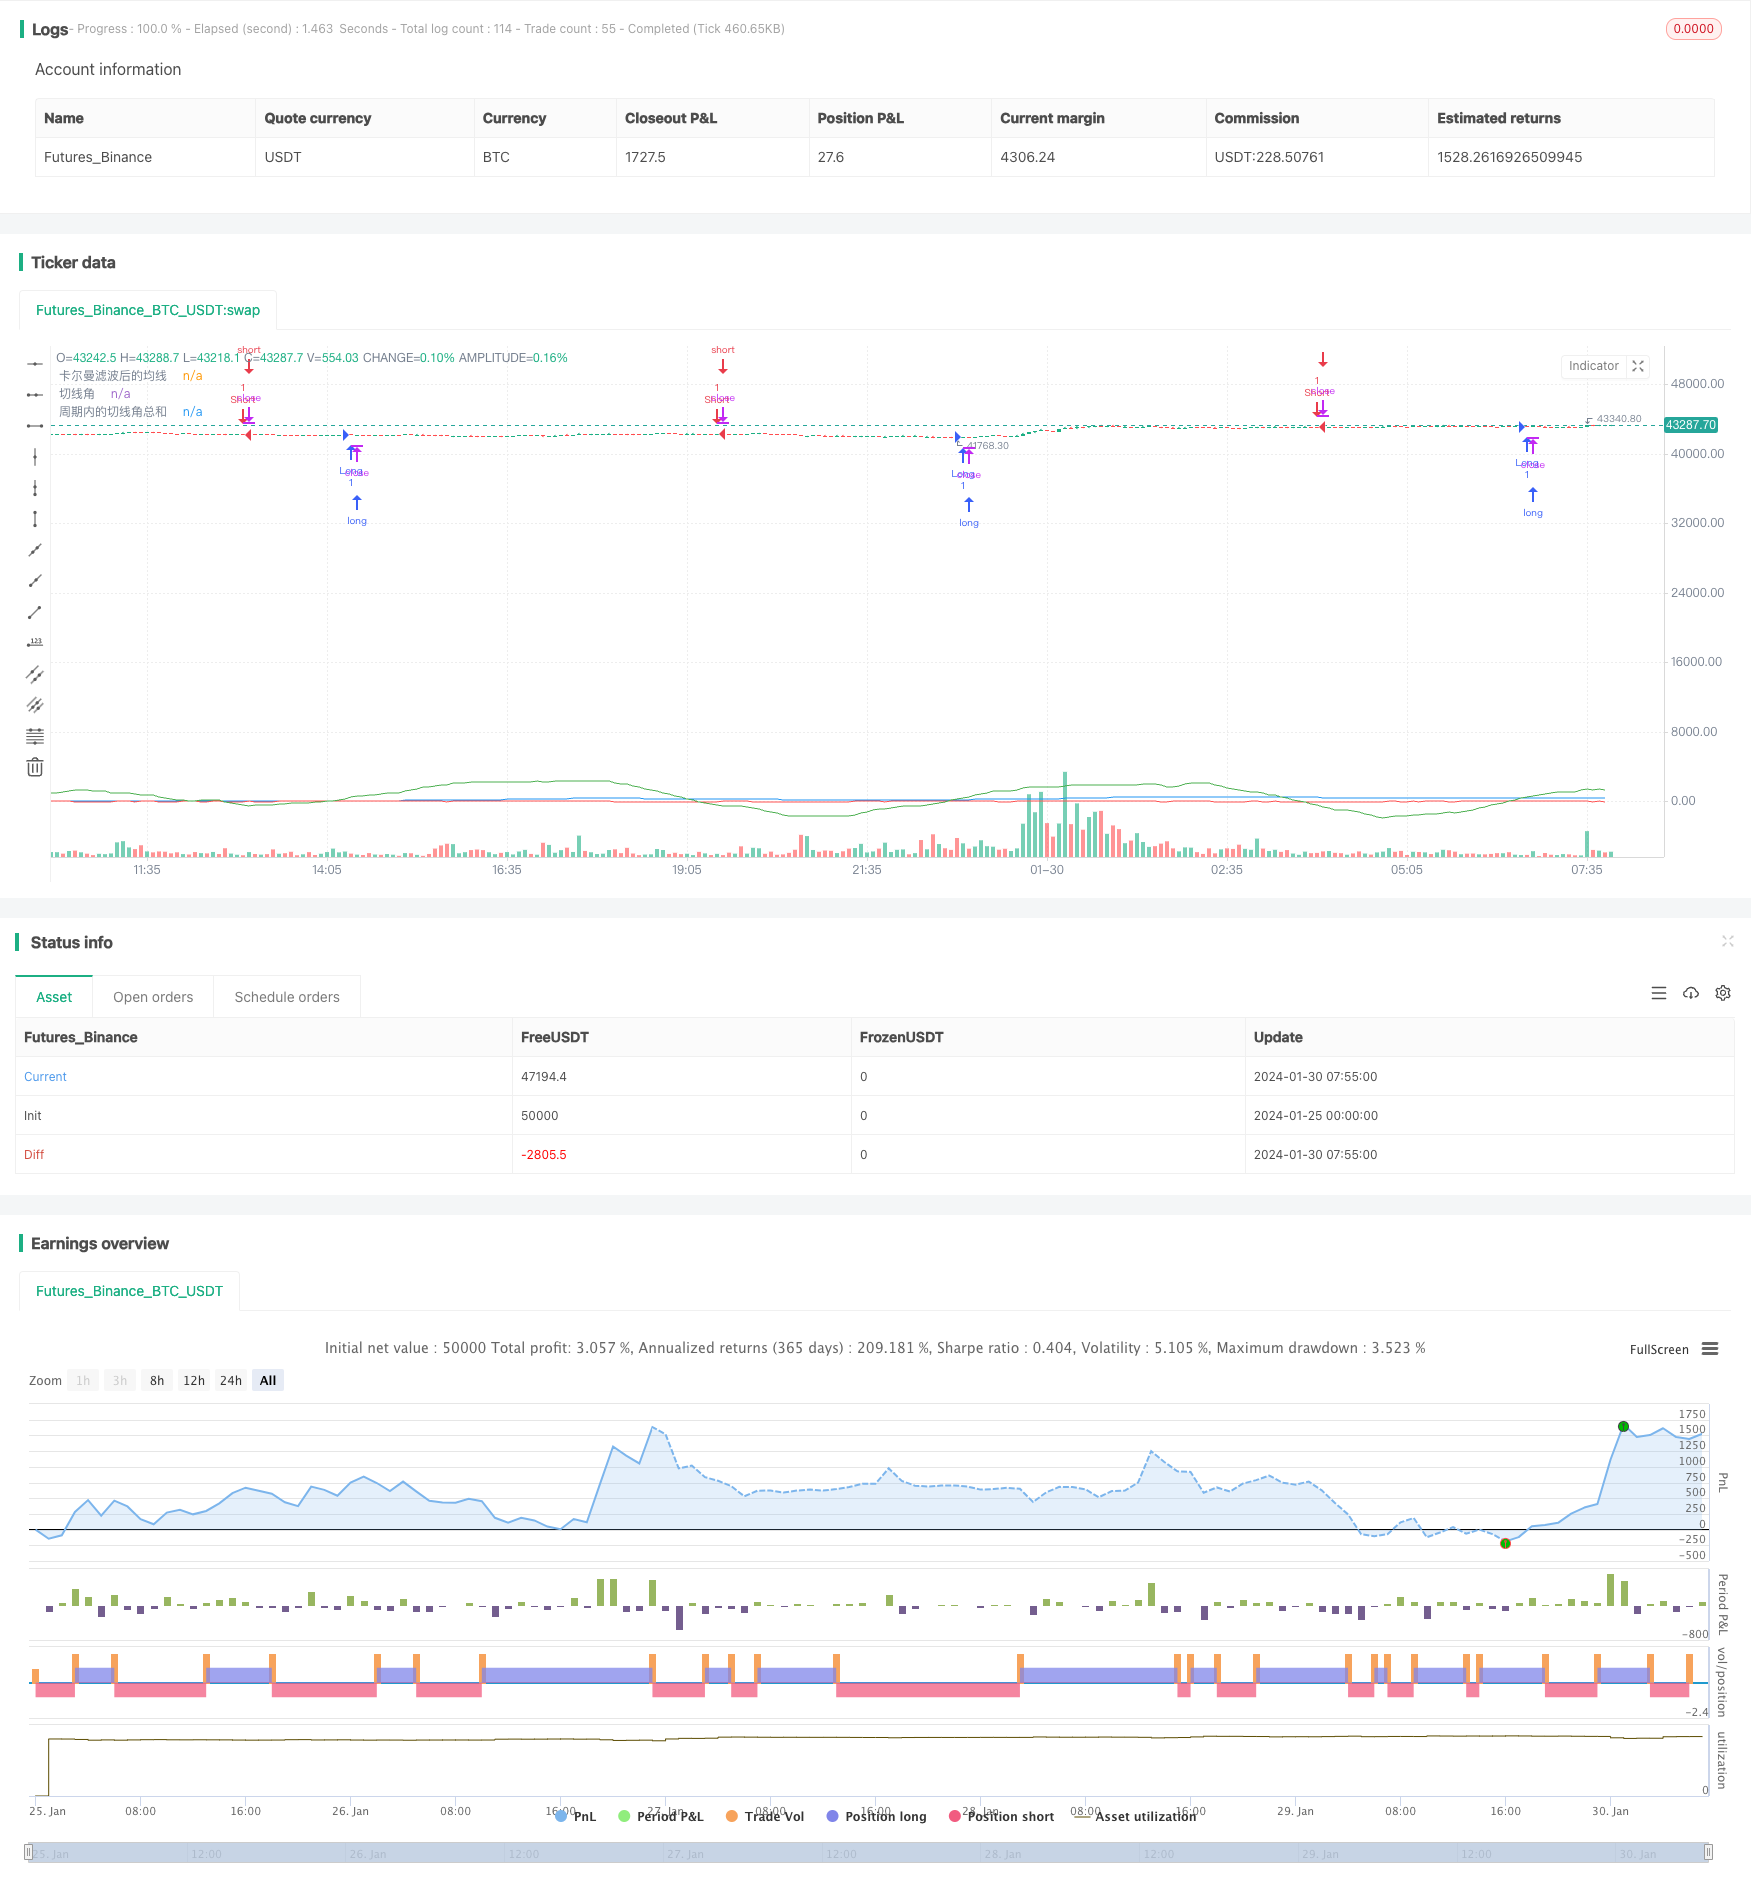
双均线策略360°是一种融合双均线和趋势强弱判定的量化交易策略。该策略通过计算不同周期的均线,判断价格趋势;同时结合切线角累加判定趋势强弱,实现了更准确的买入卖出时机选择。
双均线策略360°的核心逻辑是:
- 计算1分钟和经过卡尔曼滤波之后的均线;
- 通过两个均线的价差计算切线角;
- 累加切线角,得到趋势强弱信号;
- 根据累加切线角是否超过设定阈值发出交易信号。
具体而言,策略中定义了1分钟原始均线和经过卡尔曼滤波后的均线。卡尔曼滤波可以去除均线中的部分噪声,使其更加平滑。然后计算两个均线的切线角,该角度反映了价格的趋势变化。例如当切线角为正时,表示价格在上升;反之则表示下降。
策略选择30分钟作为计算周期,real summed该周期内所有正负切线角。当切线角和超过360度时,表示趋势十分强劲,发出做多信号;反之当切线角和小于-360度时,表示趋势反转,发出做空信号。
双均线策略360°的主要优势有:
- 均线过滤了短期市场噪音,使交易决策更稳定可靠;
- 切线角量化了趋势强度,避免了仅凭均线形态判断的主观性;
- 选取多个切线角累加具有更好的去噪效果,发出的交易信号更加可靠;
- 相比单一均线策略,双均线结合趋势强度判断使策略更加全面和稳健。
双均线策略360°也存在一些风险:
- 均线具有滞后性,可能错过短期趋势转折点;
- 仅依赖数量积累的趋势强度信号容易受到市场震荡的影响;
- 参数设置(如计算周期长度)不当可能导致错失交易机会或产生错误信号。
为降低上述风险,可以缩短均线周期、优化参数组合、增加止损机制等。
双均线策略360°还有进一步优化的空间:
- 增加自适应均线,根据市场波动率调整均线参数;
- 增加多个均线周期参考,形成优化的参数组合;
- 增加基于波动率、交易量等的动态趋势判断模块;
- 结合机器学习模型辅助调整参数或做出交易决策。
双均线策略360°综合运用均线过滤和切线角量化判断趋势,实现了较为稳健的量化交易策略。相比单一技术指标,该策略形成了更全面的考量,具有较强的实用性。但仍需注意参数调整与风险控制,未来可继续优化,使策略效果更佳。
||
The Dual Moving Average Strategy 360° is a quantitative trading strategy that incorporates dual moving averages and trend strength determination. By calculating moving averages over different periods, it determines price trends; meanwhile, by accumulating tangent angles, it judges the strength of trends and achieves more accurate entries and exits.
The core logic of the Dual Moving Average Strategy 360° is:
- Calculate the 1-minute and Kalman-filtered moving averages;
- Calculate the tangent angle based on the price difference between the two moving averages;
- Accumulate tangent angles to determine trend strength signals;
- Issue trading signals based on whether the accumulated tangent angles exceed preset thresholds.
Specifically, the strategy defines the raw 1-minute moving average and the Kalman-filtered moving average. The Kalman filter eliminates some noise from the moving average to make it smoother. The tangent angle between the two moving averages reflects price trend changes. For example, when the tangent angle is positive, it indicates an upward trend; conversely, a negative angle represents a downward trend.
The strategy chooses 30 minutes as the calculation period to sum all positive and negative tangent angles within that period. When the sum exceeds 360 degrees, it signals an extremely strong trend and issues a long signal; conversely, when the sum is below -360 degrees, it indicates a trend reversal and issues a short signal.
The main advantages of the Dual Moving Average Strategy 360° are:
- Moving averages filter out short-term market noise for more reliable trading decisions;
- Tangent angles quantify trend strength, avoiding the subjectivity of judging by moving average patterns alone;
- Summing multiple tangent angles has better noise reduction effects, resulting in more reliable trading signals;
- Compared to single moving average strategies, the dual moving averages combined with trend strength determinations make the strategy more comprehensive and robust.
The Dual Moving Average Strategy 360° also carries some risks:
- Moving averages lag price changes and may miss short-term trend turning points;
- Relying solely on the accumulated trend strength signal can be disrupted by market volatility;
- Improper parameter settings (such as calculation period lengths) may lead to missing trades or generating incorrect signals.
To mitigate the above risks, measures like shortening the moving average period, optimizing parameter combinations, adding stop-loss mechanisms can be adopted.
The Dual Moving Average Strategy 360° can be further optimized by:
- Incorporating adaptive moving averages that adjust parameters based on market volatility;
- Referencing multiple moving average periods to form optimized parameter combinations;
- Adding dynamic trend determination modules based on volatility, trading volumes, etc.;
- Assisting parameter tuning or trade decisions with machine learning models.
The Dual Moving Average Strategy 360° utilizes moving average filtering and quantitative tangent angle trend judgments to achieve a relatively robust quantitative trading strategy. Compared to single technical indicators, this strategy forms a more comprehensive consideration and has stronger practicality. But parameter tuning and risk control are still vital, and the strategy can be further optimized for even better results going forward.
[/trans]
Source (PineScript)
/*backtest
start: 2024-01-25 00:00:00
end: 2024-01-30 08:00:00
period: 5m
basePeriod: 1m
exchanges: [{"eid":"Futures_Binance","currency":"BTC_USDT"}]
*/

//@version=5
//@library=math
strategy("策略360°(测试)", overlay=true)

// 定义1分钟均线
ma1 = request.security(syminfo.tickerid, "1", ta.sma(close, 1)) // 在这里使用了 math.sma() 函数
//plot(ma1, color=color.yellow, title="原始均线")

// 定义卡尔曼滤波函数,参考了[1](https://www.tradingview.com/pine-script-docs/en/v5/language/Methods.html)和[2](https://www.tradingview.com/pine-script-docs/en/v5/language/Operators.html)的代码
kalman(x, g) =>
    kf = 0.0
    dk = x - nz(kf[1], x) // 在这里使用了 nz() 函数
    smooth = nz(kf[1], x) + dk * math.sqrt(g * 2) // 在这里使用了 math.sqrt() 函数
    velo = 0.0
    velo := nz(velo[1], 0) + g * dk // 在这里使用了 nz() 函数
    kf := smooth + velo
    kf

// 定义卡尔曼滤波后的均线
ma2 = kalman(ma1, 0.01)
plot(ma2, color=color.blue, title="卡尔曼滤波后的均线")

// 定义切线角
angle = math.todegrees(math.atan(ma2 - ma2[1])) // 在这里使用了 math.degrees() 和 math.atan() 函数

// 定义累加的切线角
cum_angle = 0.0
cum_angle := nz(cum_angle[1], 0) + angle // 在这里使用了 nz() 函数

// 定义30分钟周期
period = 30 // 您可以根据您的需要修改这个参数

// 定义周期内的切线角总和
sum_angle = 0.0
sum_angle := math.sum(angle, period) // 在这里使用了 math.sum() 函数,把周期内的切线角总和改成简单地把 5 个切线角相加

// 定义买入和卖出条件
buy = sum_angle > 360// 在这里使用了 math.radians() 函数
sell = sum_angle < -360

// 执行买入和卖出操作
strategy.entry("Long", strategy.long, when=buy)
strategy.close("Short", when=buy)
strategy.entry("Short", strategy.short, when=sell)
strategy.close("Long", when=sell)

// 绘制曲线图
plot(sum_angle, color=color.green, title="周期内的切线角总和")
plot(angle, color=color.red, title="切线角") // 这是我为您添加的代码,用于显示实时计算的切线角
Detail
https://www.fmz.com/strategy/440827
Last Modified
2024-02-02 14:29:59