Name
埃勒斯-费希尔相对活力指数策略Ehlers-Fisher-Stochastic-Relative-Vigor-Index-Strategy
Author
ChaoZhang
Strategy Description
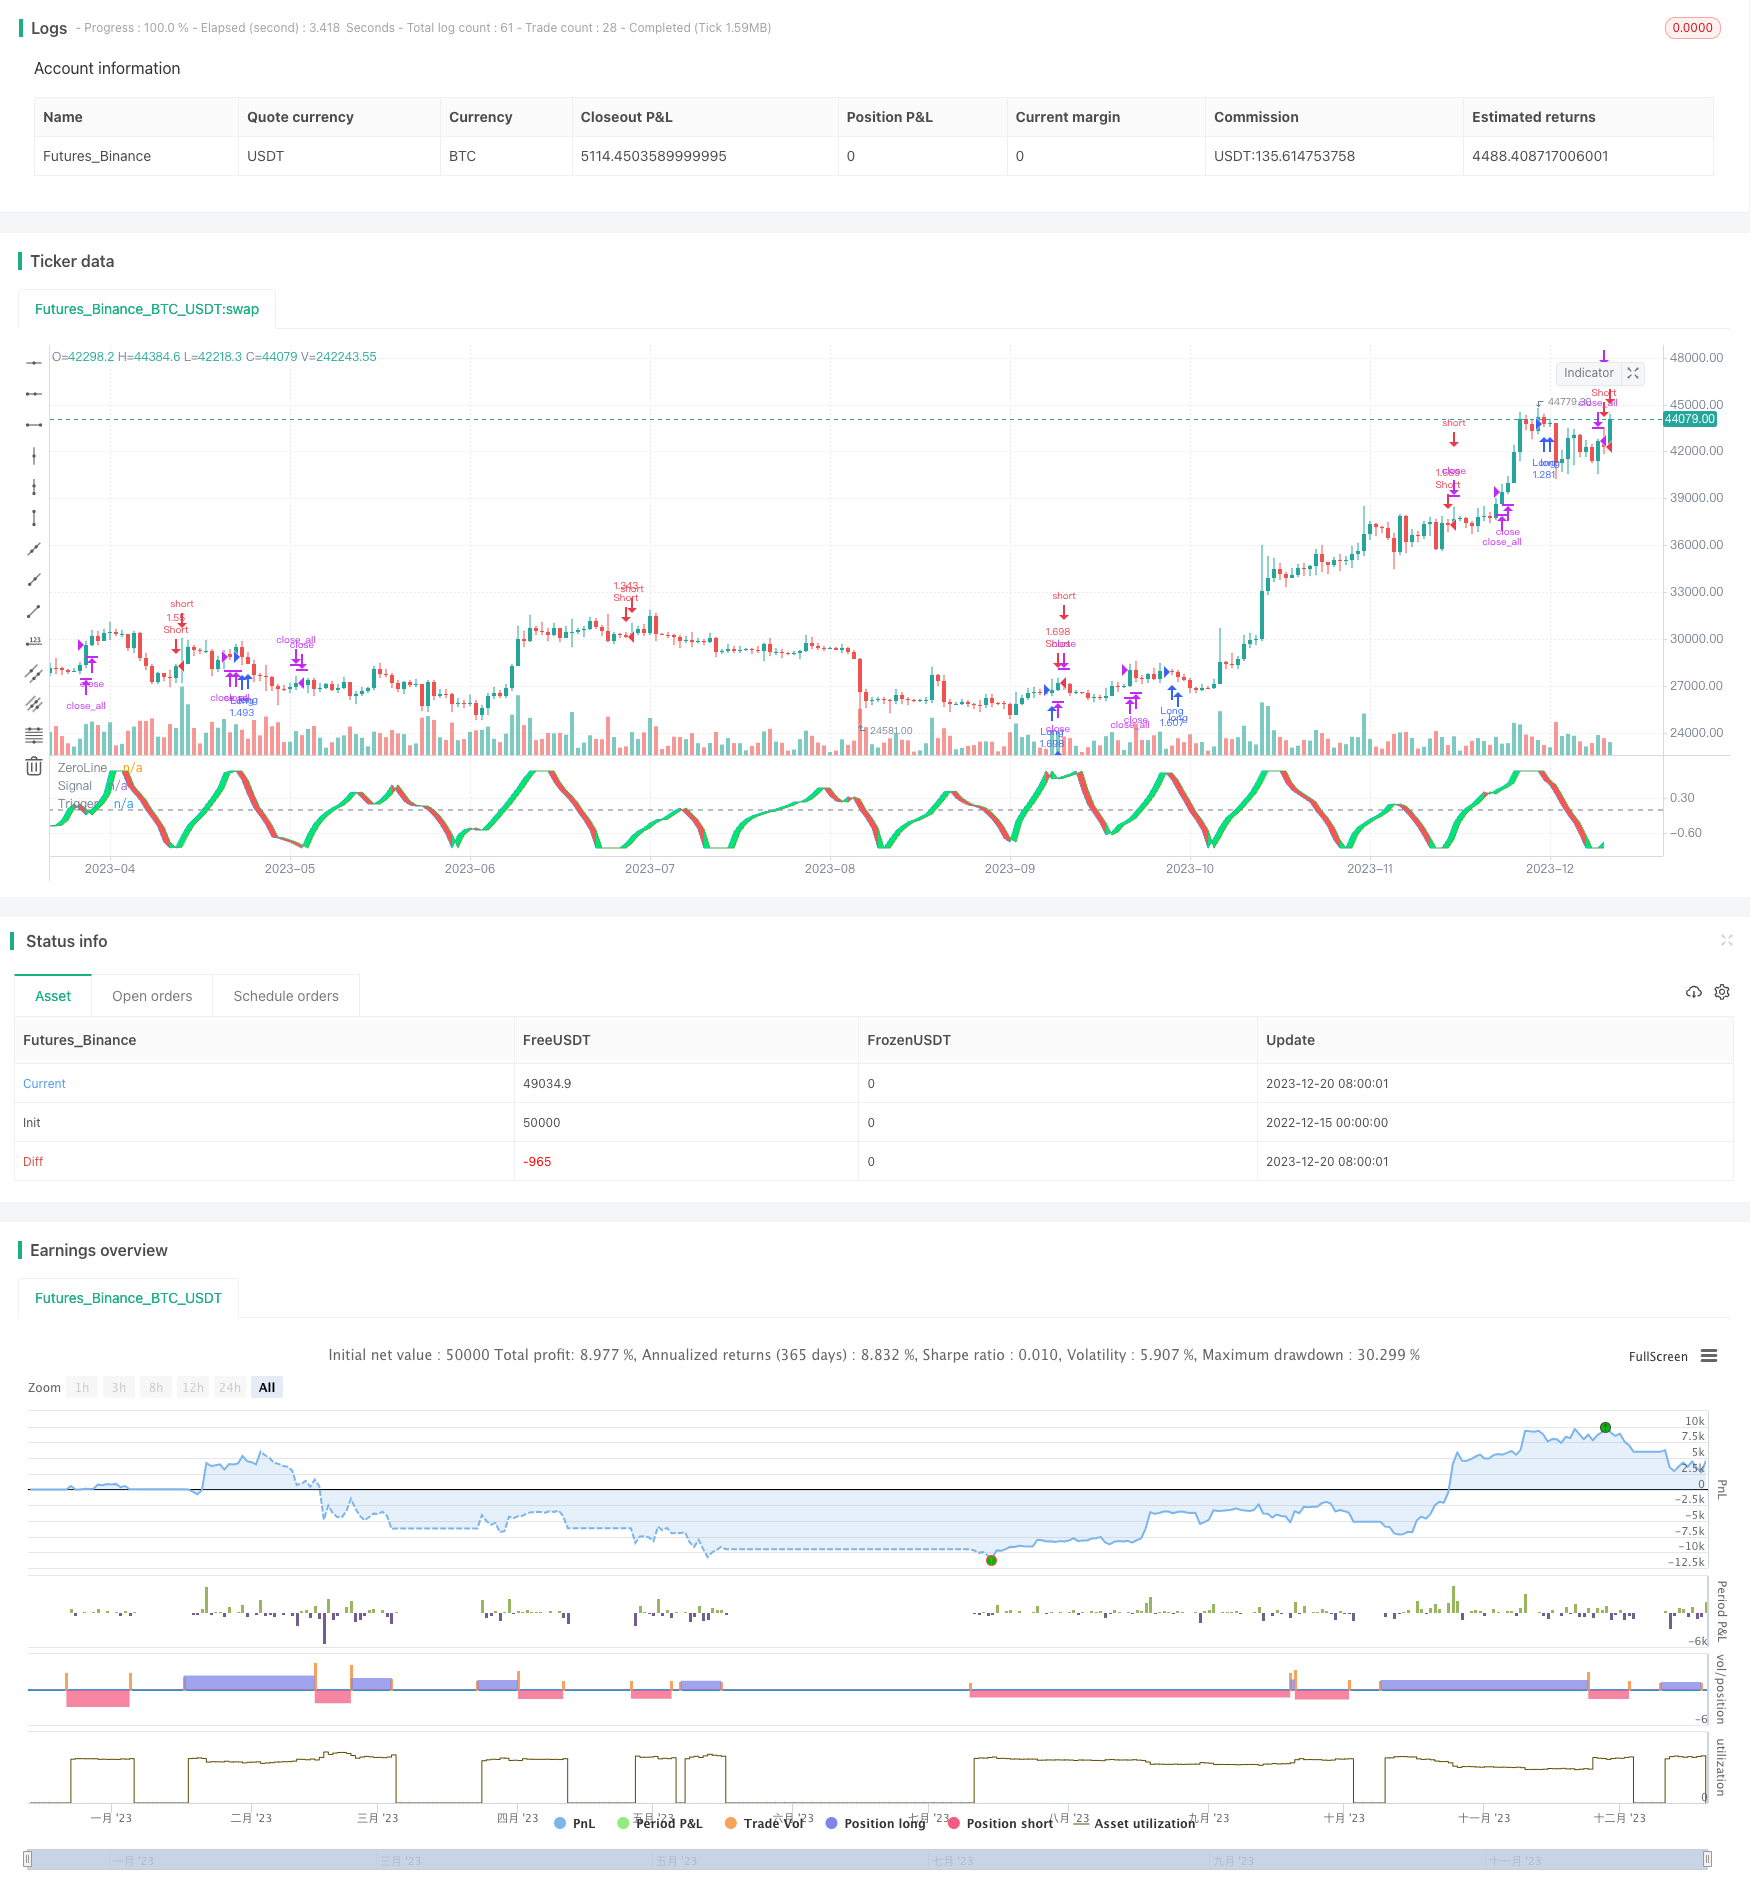
该策略是根据约翰·埃勒斯在他的书《股票和期货的控制分析》中提出的埃勒斯-费希尔随机相对活力指数指标来制定的。该策略利用埃勒斯-费希尔指标来判断股票的相对强弱,并结合定制的交易规则来进行买入和卖出。
该策略首先计算出closing price - opening price,也就是股票的实体部分。再计算出high price - low price,也就是股票的影线部分。通过分别对这两个部分求和取平均来计算出股票的动量。然后利用这个动量值除以股票的波动性来得到相对活力指数(RVI)。
接着,对RVI应用埃勒斯-费希尔指标的计算公式,得到信号值。当信号值上穿触发值时做多,下穿时做空。此外,还设置了固定止损和追踪止损来控制风险。
该策略综合利用了股票的动量特征和随机指标,可以有效判断市场的相对强弱。埃勒斯-费希尔指标的设计可以减小噪音的影响,生成较为可靠的交易信号。活力指数反映了股票自身的趋势性和波动性,是ynamic indicator。
相比单一使用动量指标或随机指标,该策略进行了指标和模型的有机结合,可以提高信号质量。通过严格的止损规则也使得该策略在保证盈利能力的前提下可控制风险。
该策略主要依赖埃勒斯-费希尔指标,当市场突发重大变化时,指标参数需要进行优化以适应新的环境。如果指标参数设置不当,会产生错误信号或信号滞后。
另外,策略本身也存在一定程度的曲线拟合风险。如果测试和实盘中的市场环境发生较大变化时,策略表现可能会产生较大的偏差。此时需要调整策略参数或优化交易规则以适应新的市场状况。
该策略可以从以下几个方面进行进一步优化:
-
对埃勒斯-费希尔指标的参数进行优化,使其更加灵敏或过滤噪音。
-
利用机器学习算法如LSTM等对指标进行建模,生成更可靠的交易信号。
-
结合市场波动率指标如ATR来动态调整止损距离。
-
增加对多因子模型的支持,综合其他技术指标和基本面指标来提升信号质量。
-
优化开平仓逻辑,设置动态出入场条件。引入自适应止损和止盈技术。
该策略利用埃勒斯-费希尔随机相对活力指数指标判断市场趋势和强弱,设置合理的止损机制控制风险。相比单一指标,该策略进行了多指标和模型的有机结合,可以过滤噪音提供高质量信号。通过参数优化、模型融合、自适应调整等手段,策略表现还有进一步提升的空间。
||
This strategy is based on the Ehlers Fisher Stochastic Relative Vigor Index indicator proposed by John Ehlers in his book "Cybernetic Analysis for Stocks and Futures". The strategy utilizes the Ehlers Fisher indicator to judge the relative strength of stocks and combines it with custom trading rules for entries and exits.
The strategy first calculates the closing price - opening price, which is the body of the candlestick. Then it calculates the high price - low price, which is the shadow of the candlestick. By taking sum and average of these two parts respectively, it obtains the momentum of the stock. Then by dividing the momentum with the volatility of the stock, it gets the Relative Vigor Index (RVI).
Next, the Ehlers Fisher formula is applied on RVI to get the signal value. It goes long when signal crosses over trigger, and goes short when signal crosses below trigger. In addition, fixed stop loss and trailing stop loss are implemented to control risks.
This strategy integrates the momentum characteristics and stochastic indicator of stocks, which can effectively determine the relative strength in the market. The design of Ehlers Fisher indicator can reduce the impact of noise and generate relatively reliable trading signals. The vigor index reflects the trending quality and volatility of a stock itself, making it a dynamic indicator.
Compared with using a single momentum indicator or stochastic indicator, this strategy combines indicators and models organically, which can improve the quality of signals. The strict stop loss rules also enable the strategy to control risks while ensuring profitability.
This strategy mainly relies on the Ehlers Fisher indicator. When there are drastic changes in the market, the parameters of the indicator need to be optimized to adapt to the new environment. If the parameters are set improperly, it may generate incorrect signals or lagging signals.
In addition, there is some degree of curve fitting risk intrinsically in the strategy itself. If the market environment in backtesting and live trading changes greatly, the performance of the strategy may deviate largely. In this case, strategy parameters need to be adjusted and trading rules require optimization for fitting the new market conditions.
This strategy can be further optimized in the following aspects:
-
Optimize the parameters of the Ehlers Fisher indicator for higher sensitivity or noise filtering.
-
Model the indicator with machine learning algorithms like LSTM to generate more reliable trading signals.
-
Incorporate market volatility indicators like ATR to dynamically adjust the stop loss distance.
-
Add support for multi-factor models, combining other technical and fundamental indicators to improve signal quality.
-
Optimize the open/close positions logic with dynamic entry/exit criteria. Introduce adaptive stop loss and take profit techniques.
This strategy utilizes the Ehlers Fisher Stochastic RVI indicator to determine market trend and strength, and sets reasonable stop loss mechanisms to control risks. Compared with single indicators, this strategy combines multiple indicators and models organically, which can filter out noise and provide high quality signals. There is still room for further improvement in strategy performance through parameters optimization, model fusion, adaptive adjustment and other means.
[/trans]
Strategy Arguments
| Argument | Default | Description |
|---|---|---|
| v_input_1 | 10 | Length |
| v_input_2 | true | oppositeTrade |
Source (PineScript)
/*backtest
start: 2022-12-15 00:00:00
end: 2023-12-21 00:00:00
period: 1d
basePeriod: 1h
exchanges: [{"eid":"Futures_Binance","currency":"BTC_USDT"}]
*/

//@version=3
strategy("Ehlers Fisher Stochastic Relative Vigor Index Strategy", overlay = false, default_qty_type = strategy.percent_of_equity, default_qty_value = 100.0, pyramiding = 1, commission_type = strategy.commission.percent, commission_value = 0.1)
p = input(10, title = "Length")
FisherStoch(src, len) =>
    val1 = stoch(src, src, src, len) / 100
    val2 = (4 * val1 + 3 * val1[1] + 2 * val1[2] + val1[3]) / 10
    FisherStoch = 0.5 * log((1 + 1.98 * (val2 - 0.5)) / (1 - 1.98 * (val2 - 0.5))) / 2.64

CO = close - open
HL = high - low

value1 = (CO + 2 * CO[1] + 2 * CO[2] + CO[3]) / 6
value2 = (HL + 2 * HL[1] + 2 * HL[2] + HL[3]) / 6

num = sum(value1, p)
denom = sum(value2, p)

RVI = denom != 0 ? num / denom : 0

signal = FisherStoch(RVI, p)
trigger = signal[1]
oppositeTrade = input(true)
barsSinceEntry = 0
barsSinceEntry := nz(barsSinceEntry[1]) + 1
if strategy.position_size == 0
    barsSinceEntry := 0
if ((crossover(signal, trigger) and not oppositeTrade) or (oppositeTrade and crossunder(signal, trigger))) and abs(signal) > 2 / 2.64
    strategy.entry("Long", strategy.long)
    barsSinceEntry := 0
if ((crossunder(signal, trigger) and not oppositeTrade) or (oppositeTrade and crossover(signal, trigger))) and abs(signal) > 2 / 2.64
    strategy.entry("Short", strategy.short)
    barsSinceEntry := 0
if strategy.openprofit < 0 and barsSinceEntry > 8
    strategy.close_all()
    barsSinceEntry := 0

hline(0, title="ZeroLine", color=gray)
signalPlot = plot(signal, title = "Signal", color = blue)
triggerPlot = plot(trigger, title = "Trigger", color = green)
fill(signalPlot, triggerPlot, color = signal < trigger ? red : lime, transp = 50)
Detail
https://www.fmz.com/strategy/436218
Last Modified
2023-12-22 12:04:23
