Name
基于双时间框架趋势追踪策略An-Advanced-Dual-Timeframe-Trend-Tracking-Strategy-for-a-Hot-Stock
Author
ChaoZhang
Strategy Description
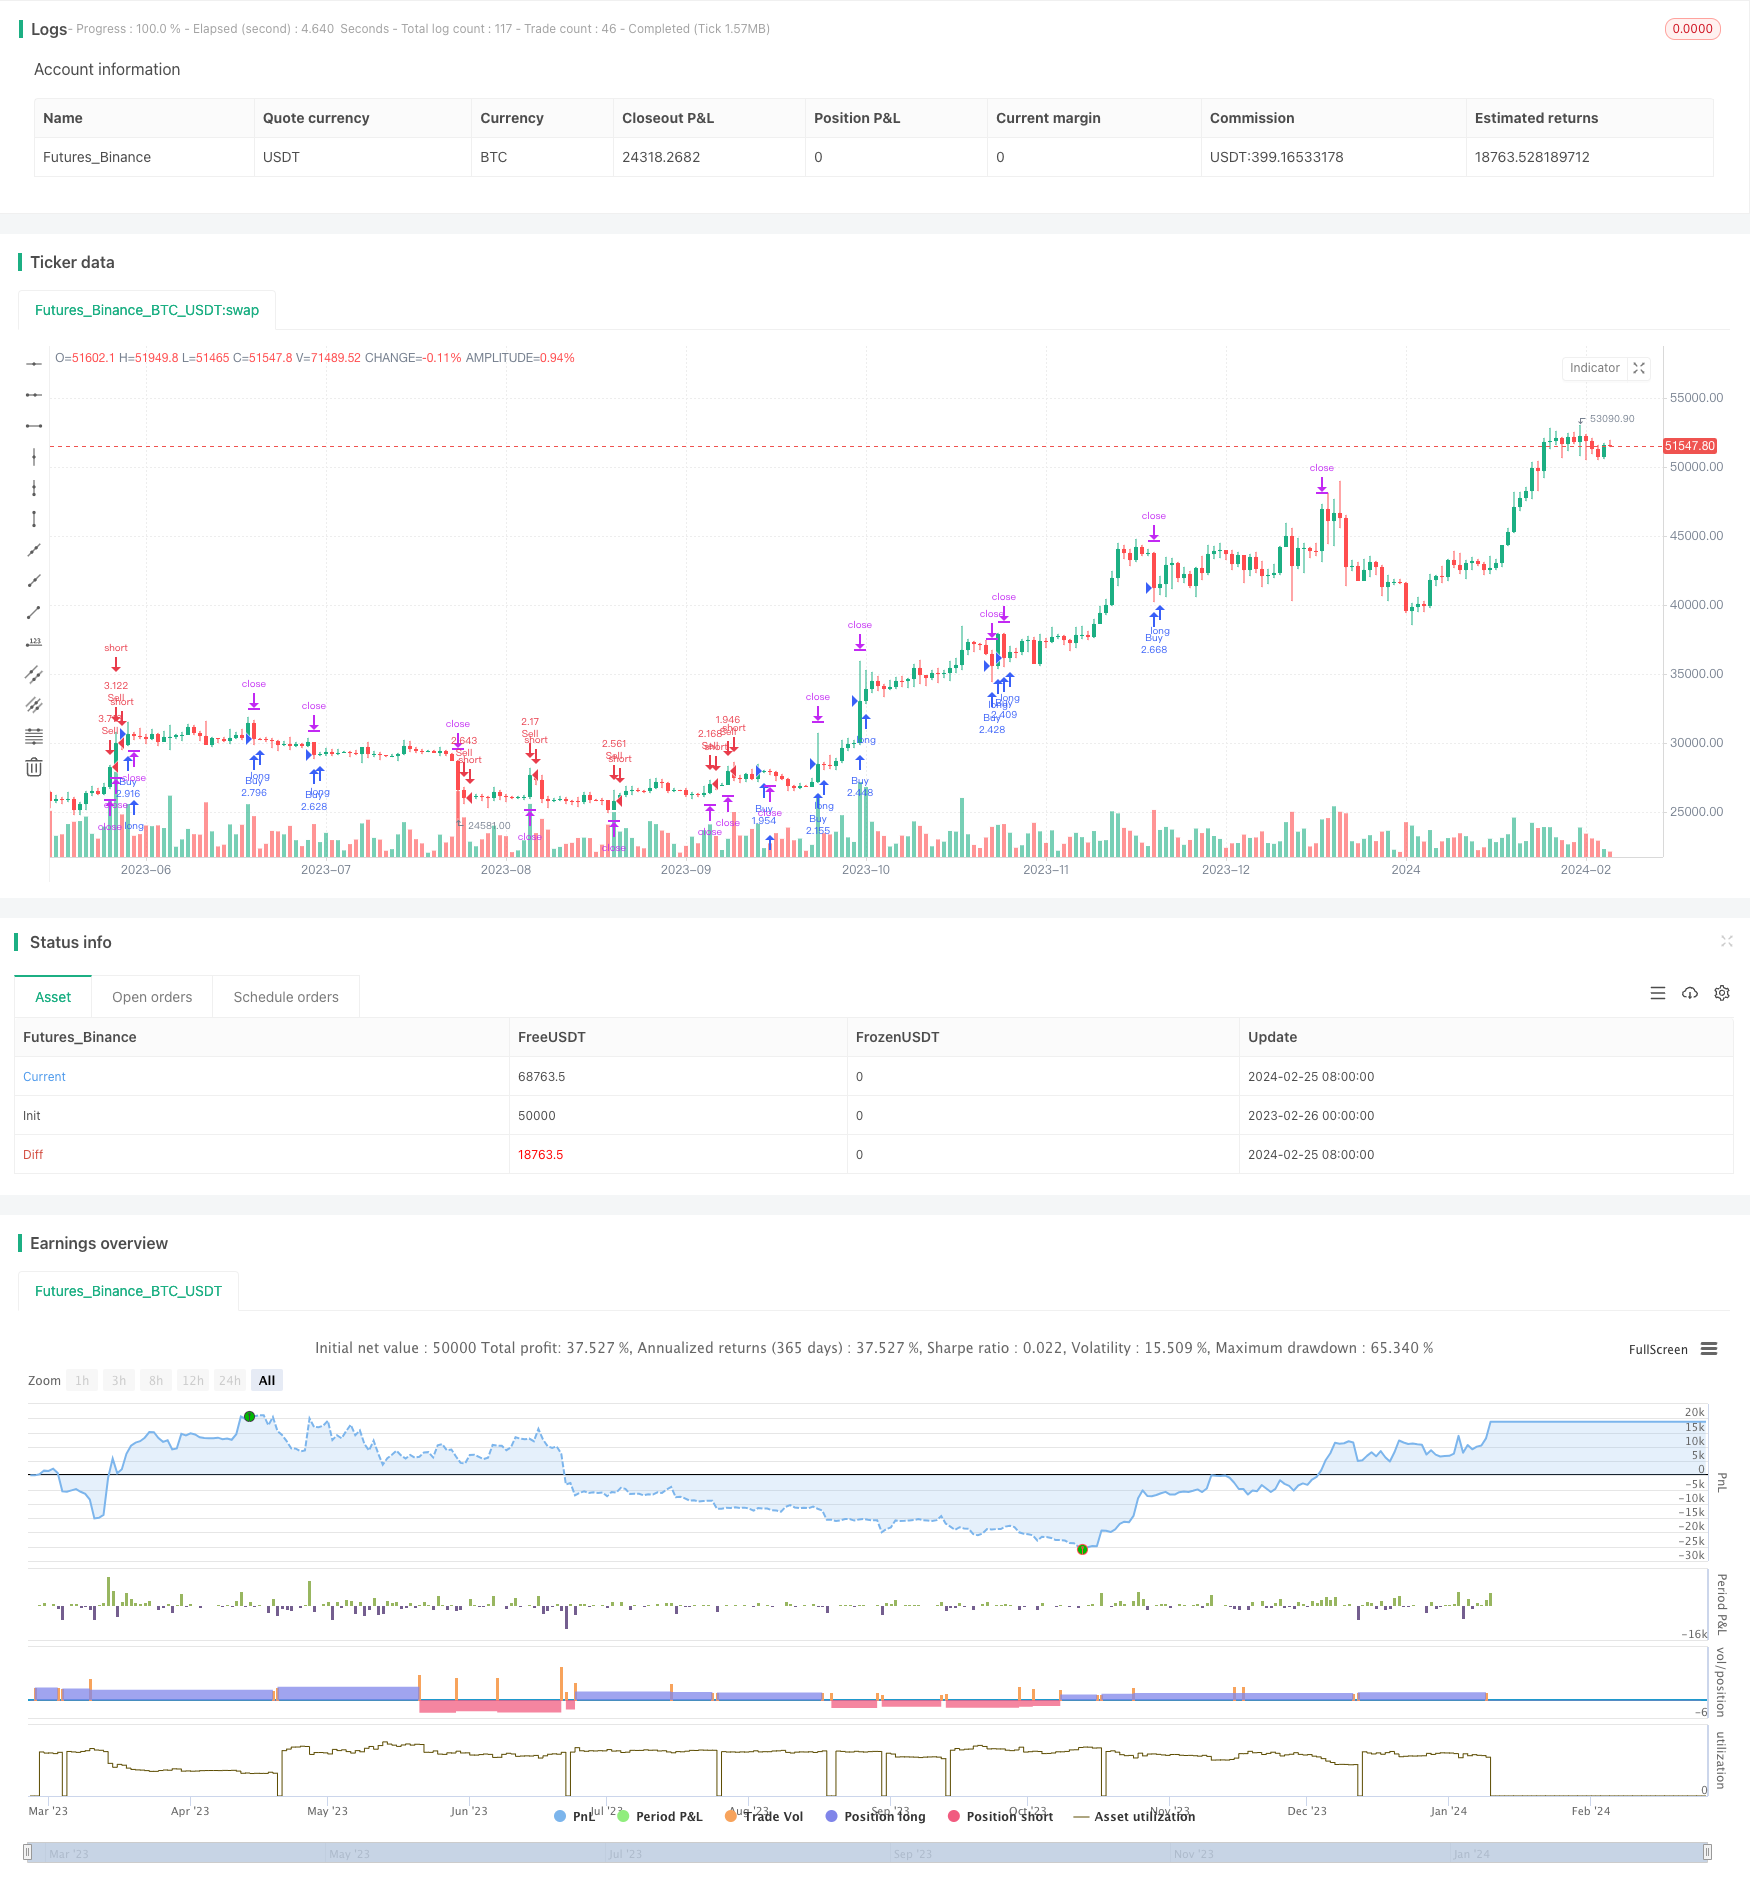
“基于股票的双时间框架趋势追踪策略”是一个高级的算法交易策略,旨在捕捉并跟踪2023年某只热门股票的趋势。该策略运用日线和1小时线的指标组合识别交易信号,实现风险管理优化的动态止损止盈,致力于在控制风险的前提下获取稳定收益。
本策略使用20周期和50周期的指数移动平均线(EMA)判断日线和1小时线上的趋势方向。当日线和1小时线上的20日EMA均上穿50日EMA时产生买入信号;当日线和1小时线上的20日EMA均下穿50日EMA时产生卖出信号。这样的组合过滤可以有效识别中长线趋势的启动。
同时,本策略使用平均真实波幅(ATR)指标计算动态的止损位和止盈位。止损位设置为ATR的1.5倍,止盈位设置为3倍。这可以根据市场波动度造成的风险水平,实时调整止损止盈参数,实现风险管理的优化。
该策略具有以下优势:
-
多时间框架指标组合过滤,可以有效识别趋势的启动。
-
动态止损止盈设定让风险管理更加智能化,避免止损止盈参数静态设置带来的问题。
-
明确判断买卖点可以更清晰地把握趋势机会。
-
严格控制单笔交易风险,有助于获取持续稳定的投资回报。
本策略也存在一些风险:
-
仅针对2023年某只股票优化,对其他股票或其他年份可能不适用。
-
无法完全避免极端大幅波动带来的亏损风险。
-
多时间框架判断信号可能存在误判风险。
-
市场系统性风险也会对策略造成影响。
本策略还可以从以下方面进一步优化:
-
增加对大盘指数的参考,避免在系统性风险大的时期建立仓位。
-
结合股票基本面和重要事件风险考虑止损止盈幅度。
-
测试调整EMA参数对策略效果的影响。
-
增加机器学习算法判断买卖信号。
本策略综合考虑了趋势判断、风险管理、参数优化等多个维度,在控制风险前提下,适合有经验的投资者追捧热门股票中长线趋势,获取较为稳定的投资回报。使用该策略需要投资者具备一定的编程能力和量化交易知识,并准备承担一定程度的亏损风险。总体来说,本策略是一个值得推荐的股票算法交易策略。
||
The "Dual Timeframe Trend Tracking Strategy for a Hot Stock" is a sophisticated algorithmic trading strategy designed to capture and track trends of a popular stock in 2023. It combines indicators across daily and hourly timeframes to generate trade signals while implementing dynamic stop loss and take profit for optimized risk management. The strategy aims to achieve steady profits while controlling risk.
The strategy uses 20-period and 50-period Exponential Moving Averages (EMA) to determine trend direction on both daily and hourly timeframes. A buy signal is generated when the 20-day EMA crosses above the 50-day EMA on both timeframes. A sell signal is triggered when the 20-day EMA crosses below the 50-day EMA on both daily and hourly charts. The indicator combinations effectively identify trend initiations.
In addition, the Average True Range (ATR) indicator is used to set adaptive stop loss and take profit levels. The stop loss is set at 1.5 times the ATR, while take profit is 3 times the ATR. This allows dynamic adjustments of the risk parameters based on market volatility.
The key advantages of this strategy include:
-
Combination of multi-timeframe indicators improves signal accuracy in detecting trend starts.
-
Dynamic stop loss and take profit settings enable more intelligent risk management.
-
Clear signal for entry and exit points to capitalize on trend opportunities.
-
Strict risk control for individual trades helps achieve steady returns.
There are also some risks to consider:
-
Optimized specifically for a hot stock in 2023 only. May not work for other stocks or years.
-
Extreme volatility can still cause losses.
-
Multi-timeframe signals may have occasional false signals.
-
Systemic market risk can also impact strategy performance.
Some ways to further improve the strategy:
-
Incorporate market benchmarks to avoid trades during high systemic risk events.
-
Consider fundamentals and events for stop loss and take profit sizing.
-
Test EMA parameter tuning for performance.
-
Add machine learning for signal forecasting.
In summary, this strategy comprehensively accounts for trend, risk management and optimization. With appropriate risk control, it is suitable for experienced investors to capitalize on hot stock trend trading opportunities and achieve steady returns. Proper programming skill and quant trading knowledge are required to implement this strategy, along with the willingness to undertake potential losses. Overall this is a recommended algorithmic trading approach for a hot stock.
[/trans]
Source (PineScript)
/*backtest
start: 2023-02-26 00:00:00
end: 2024-02-26 00:00:00
period: 1d
basePeriod: 1h
exchanges: [{"eid":"Futures_Binance","currency":"BTC_USDT"}]
*/

//@version=5
strategy("TSLA Enhanced Trend Master 2023", overlay=true)

// Daily timeframe indicators
ema20_daily = ta.ema(close, 20)
ema50_daily = ta.ema(close, 50)

// 1-hour timeframe indicators
ema20_hourly = request.security(syminfo.tickerid, "60", ta.ema(close, 20))
ema50_hourly = request.security(syminfo.tickerid, "60", ta.ema(close, 50))

// Check if the year is 2023
is_2023 = year(time) == 2023

// Counter for short trades
var shortTradeCount = 0

// Entry Conditions
buySignal = is_2023 and (ema20_daily > ema50_daily) and (ema20_hourly > ema50_hourly)
sellSignal = is_2023 and (ema20_daily < ema50_daily) and (ema20_hourly < ema50_hourly) and (shortTradeCount < 0.5 * ta.highest(close, 14))

// Dynamic Stop Loss and Take Profit
atr_value = ta.atr(14)
stopLoss = atr_value * 1.5
takeProfit = atr_value * 3

// Calculate Position Size based on Volatility-Adjusted Risk
riskPercent = 2
positionSize = strategy.equity * riskPercent / close

// Strategy
if (buySignal)
    strategy.entry("Buy", strategy.long, qty=positionSize)
    strategy.exit("Take Profit/Stop Loss", "Buy", stop=close - stopLoss, limit=close + takeProfit)

if (sellSignal)
    strategy.entry("Sell", strategy.short, qty=positionSize)
    strategy.exit("Take Profit/Stop Loss", "Sell", stop=close + stopLoss, limit=close - takeProfit)
    shortTradeCount := shortTradeCount + 1
Detail
https://www.fmz.com/strategy/442953
Last Modified
2024-02-27 16:01:41
