Name
基于双重趋势突破策略Dual-Trend-Breakout-Strategy
Author
ChaoZhang
Strategy Description
双重趋势突破策略综合运用了多种技术指标,主要包括趋势线、均线交叉和价格通道突破,旨在识别市场趋势变化,捕捉趋势反转机会。该策略结合趋势跟踪和突破信号,进出仓比较稳健,但也存在一定的假突破风险。
该策略首先使用枢轴高点和枢轴低点划分多空趋势,当价格突破趋势线时,表示潜在的趋势反转。计算斜率采用ATR方法,使其更贴近实际波动。
该策略采用短期5日线和长期34日线,构建快慢均线交叉策略。短均线上穿长均线为买入信号,下穿为卖出信号。利用快速均线捕捉短期趋势,慢速均线跟踪长期趋势。
该策略还设置了一个5日的价格通道,突破上轨买入,突破下轨卖出,捕捉短期价格突破。结合快慢均线决定突破的可靠性。
上述三种技术指标信号综合运用于该策略,形成稳健的双重判断机制,避免错误交易。
-
多种技术指标集成,判断信号较为稳健,减少了假突破造成的损失。
-
快速均线和价格通道能够及时抓住短期价格趋势变化。慢速均线和趋势线跟踪长期趋势,进出场比较稳定。
-
代码结构清晰,指标参数可调整,可以针对不同周期、品种进行调整优化。
-
结合了趋势判断和突破信号,在趋势牛市中,行情较为激进有利于获利;在范围整理中,突破信号交易频次会降低,有利于规避大幅震荡。
-
存在一定的假突破风险,特别是在价格震荡整理的场景,容易造成亏损。
-
均线交叉属于滞后信号,若大幅趋势反转就会存在追高买入或割低卖出的风险。
-
多种技术指标集成,在参数优化时需要大量测试和计算,较为耗时。
-
针对假突破风险,可以加入成交量指标进行过滤,例如突破时需成交量放大,或某一根K线收盘价未突破前高或前低等。
-
针对追高买入风险,可以设置超买超卖指标的过滤条件,例如RSI指标避免超买。或设置止损线,加快止损。
-
针对参数优化难题,可以采用机器学习方法辅助寻优,在大量历史数据中寻找最优参数组合。
-
加入成交量指标或者超买超卖指标判断趋势可靠性,设置严格的过滤条件,避免假突破造成亏损。
-
针对不同的交易品种,调整均线参数设置和价格通道参数使其更贴合该品种的特性。
-
增加止损策略,通过移动止损、挂单止损等手段控制单笔亏损。
-
采用适应性方法,当市场进入震荡整理阶段,降低开仓频次;趋势明显时增加交易频次。
-
利用深度学习方法训练模型判断买卖点,辅助或替代传统技术指标,利用深度学习泛化能力寻找更有效的交易策略。
本策略整合多种常用技术指标形成双重判断体系,能够有效识别趋势变化,在回测中表现出较好的稳定性。但也应该注意一定的假突破风险,通过增加过滤条件、止损策略、参数调整和运用机器学习方法进行优化,能够进一步增强策略的实盘表现。
||
The Dual Trend Breakout strategy integrates multiple technical indicators including trendlines, moving average crossovers, and price channel breakouts to identify potential turning points in the market. It aims to capture trends and capitalize on momentum shifts. This strategy combines trend tracking and breakout signals for relatively robust entries and exits, but it also carries some risk of false breakouts.
The strategy first uses pivot highs and lows to divide bullish and bearish trends. When the price breaks the trendline, it signals a potential trend reversal. The slope is calculated using ATR method to keep up with actual fluctuations.
The strategy adopts a 5-day short term moving average and a 34-day long term moving average for fast and slow crossover trading. A short MA crossing above long MA gives buy signals, while crossing below gives sell signals. The fast MA captures short-term trends and the slow MA tracks long-term trends.
A 5-day price channel is also configured in the strategy. Breaking above the upper band triggers long entry and breaking below the lower band triggers short entry to capture short-term price breakouts. It works with the MA crossover to determine the reliability of breakout signals.
The three types of technical indicators are integrated into one strategy to form a robust dual confirmation mechanism, avoiding false trades.
-
Integrates multiple indicators for relatively reliable signals, reducing losses from false breakouts.
-
Fast MA and price channel capture short-term trend changes swiftly. Slow MA and trendlines track long-term trends for steady entries and exits.
-
Clean code structure with adjustable parameters for optimization across different products and timeframes.
-
Combines trend tracking and breakout signals for profitability in strong trends, and avoiding whipsaws in range-bound markets.
-
There can be some risks of false breakouts, especially in range-bound scenarios, leading to losses.
-
Lagging nature of MA crosses carries risk of buying tops or selling bottoms after major trend reversal.
-
Multiple integrated indicators require heavy backtesting and computation for parameter tuning.
-
Volume indicators can be added for breakout validation, e.g. requiring volume expansion on breakouts.
-
Oversold/overbought indicators prevent buying/selling exhaustion scenarios.
-
Stop loss to control loss on false trades.
-
Machine learning to find optimal parameters quickly through massive historical data.
-
Add volume or RSI filters to confirm reliable trend changes, setting strict filters to avoid losses from false breakouts.
-
Tune MA and channel parameters for different products to match their characteristics.
-
Add stop loss mechanisms via trailing stop loss, stop limit orders to restrict loss per trade.
-
Adopt adaptive approaches to trade less frequently during range-bound markets and more during strong established trends.
-
Train deep learning models to generate buy/sell signals instead of just using technical indicators, leveraging neural networks' pattern recognition capabilities to find more predictive strategies.
This strategy forms a dual confirmation system by combining multiple popular technical indicators, able to effectively capture trend changes with relatively stable backtest results. But some risks of false breakouts remain, which can be further improved by adding filters, stop losses, parameter tuning, and machine learning techniques. This can strengthen the strategy’s robustness for live trading.
[/trans]
Strategy Arguments
| Argument | Default | Description |
|---|---|---|
| v_input_int_1 | 14 | Swing Detection Lookback |
| v_input_float_1 | true | Slope |
| v_input_string_1 | 0 | Slope Calculation Method: Atr |
| v_input_1 | true | backpaint_tl |
| v_input_4 | true | Show Extended Lines |
| v_input_int_2 | 5 | Channel Length |
| v_input_int_3 | 5 | Short MA Length |
| v_input_int_4 | 34 | Long MA Length |
| v_input_2 | teal | (?Style)Up Trendline Color |
| v_input_3 | red | Down Trendline Color |
Source (PineScript)
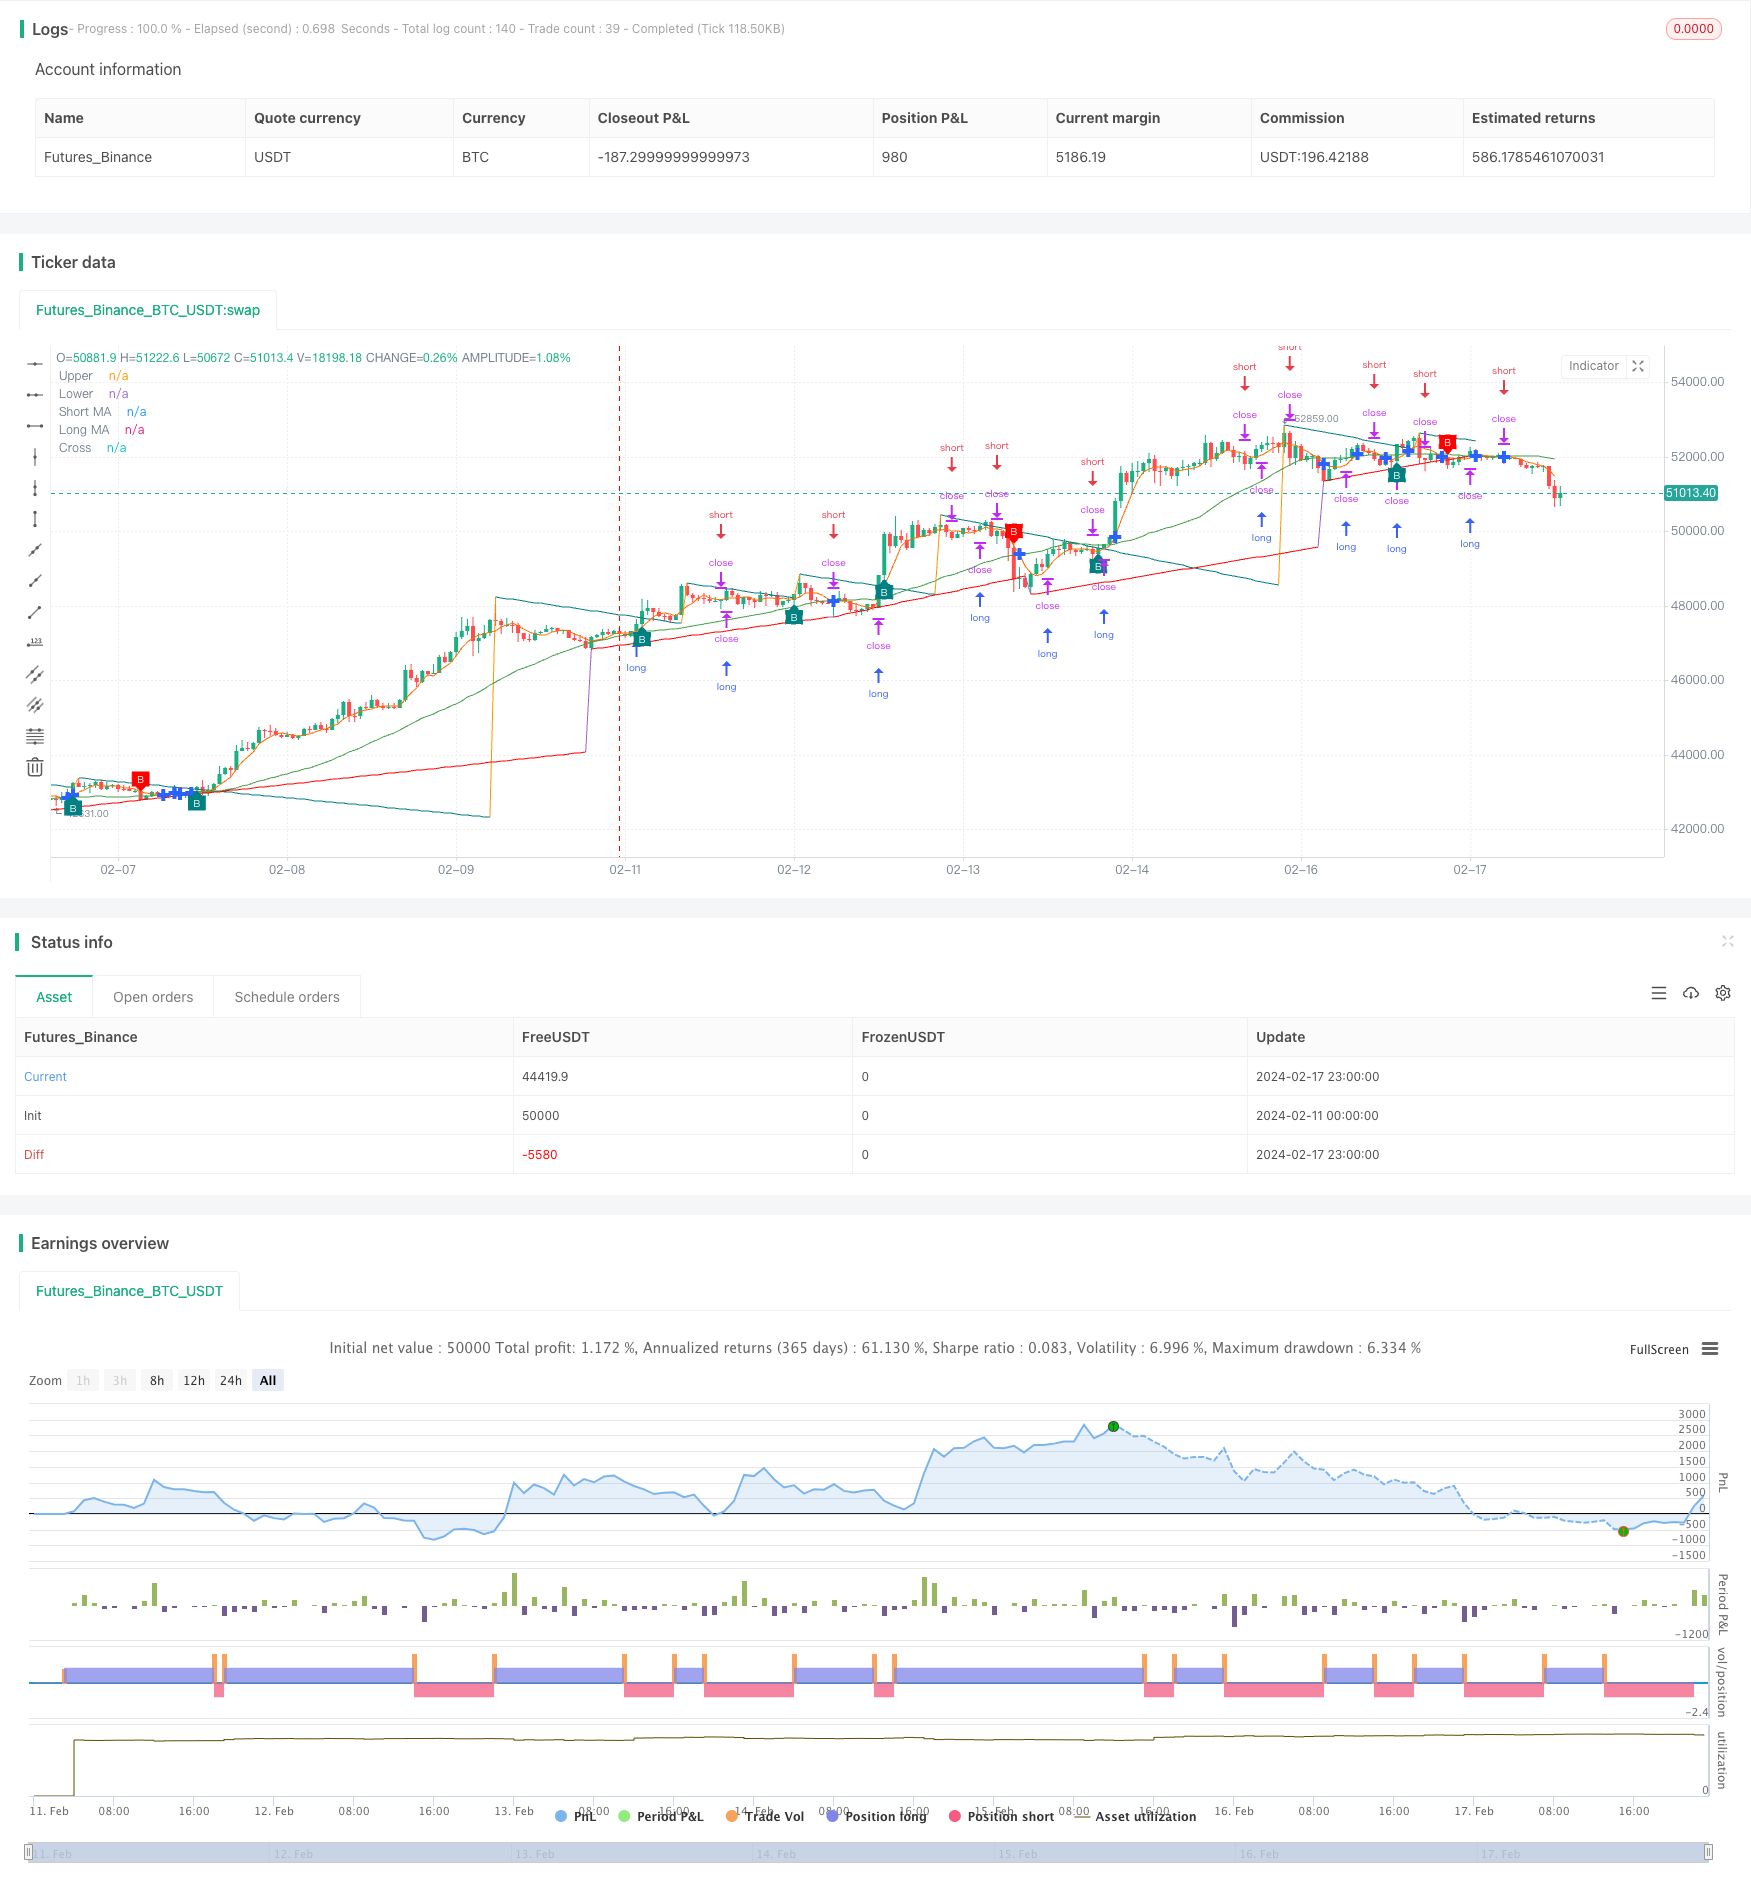
/*backtest
start: 2024-02-11 00:00:00
end: 2024-02-18 00:00:00
period: 1h
basePeriod: 15m
exchanges: [{"eid":"Futures_Binance","currency":"BTC_USDT"}]
*/

// This Pine Script™ code is subject to the terms of the Mozilla Public License 2.0 at https://mozilla.org/MPL/2.0/
// © FinanceUpPvtLtd

//@version=5
strategy("FINANCE UP FREE STRATEGY (+919665229664)", overlay=true)

// Script 01 - Trendlines
length_tl = input.int(14, 'Swing Detection Lookback')
mult_tl = input.float(1., 'Slope', minval=0, step=.1)
calcMethod_tl = input.string('Atr', 'Slope Calculation Method', options=['Atr', 'Stdev', 'Linreg'])
backpaint_tl = input(true, tooltip='Backpainting offset displayed elements in the past. Disable backpainting to see real-time information returned by the indicator.')
upCss_tl = input(color.teal, 'Up Trendline Color', group='Style')
dnCss_tl = input(color.red, 'Down Trendline Color', group='Style')
showExt_tl = input(true, 'Show Extended Lines')

var upper_tl = 0.
var lower_tl = 0.
var slope_ph_tl = 0.
var slope_pl_tl = 0.
var offset_tl = backpaint_tl ? length_tl : 0
n_tl = bar_index
src_tl = close
ph_tl = ta.pivothigh(length_tl, length_tl)
pl_tl = ta.pivotlow(length_tl, length_tl)
slope_tl = switch calcMethod_tl
    'Atr'    => ta.atr(length_tl) / length_tl * mult_tl
    'Stdev'  => ta.stdev(src_tl, length_tl) / length_tl * mult_tl
    'Linreg' => math.abs(ta.sma(src_tl * n_tl, length_tl) - ta.sma(src_tl, length_tl) * ta.sma(n_tl, length_tl)) / ta.variance(n_tl, length_tl) / 2 * mult_tl
slope_ph_tl := ph_tl ? slope_tl : slope_ph_tl
slope_pl_tl := pl_tl ? slope_tl : slope_pl_tl
upper_tl := ph_tl ? ph_tl : upper_tl - slope_ph_tl
lower_tl := pl_tl ? pl_tl : lower_tl + slope_pl_tl
var upos_tl = 0
var dnos_tl = 0
upos_tl := ph_tl ? 0 : close > upper_tl - slope_ph_tl * length_tl ? 1 : upos_tl
dnos_tl := pl_tl ? 0 : close < lower_tl + slope_pl_tl * length_tl ? 1 : dnos_tl

// var uptl_tl = line.new(na, na, na, na, color=upCss_tl, style=line.style_dashed, extend=extend.right)
// var dntl_tl = line.new(na, na, na, na, color=dnCss_tl, style=line.style_dashed, extend=extend.right)
// if ph_tl and showExt_tl
//     uptl_tl.set_xy1(n_tl - offset_tl, backpaint_tl ? ph_tl : upper_tl - slope_ph_tl * length_tl)
//     uptl_tl.set_xy2(n_tl - offset_tl + 1, backpaint_tl ? ph_tl - slope_tl : upper_tl - slope_ph_tl * (length_tl + 1))
// if pl_tl and showExt_tl
//     dntl_tl.set_xy1(n_tl - offset_tl, backpaint_tl ? pl_tl : lower_tl + slope_pl_tl * length_tl)
//     dntl_tl.set_xy2(n_tl - offset_tl + 1, backpaint_tl ? pl_tl + slope_tl : lower_tl + slope_pl_tl * (length_tl + 1))

plot(backpaint_tl ? upper_tl : upper_tl - slope_ph_tl * length_tl, 'Upper', color=ph_tl ? na : upCss_tl, offset=-offset_tl)
plot(backpaint_tl ? lower_tl : lower_tl + slope_pl_tl * length_tl, 'Lower', color=pl_tl ? na : dnCss_tl, offset=-offset_tl)

plotshape(upos_tl > upos_tl[1] ? low : na, "Upper Break", shape.labelup, location.absolute, upCss_tl, text="B", textcolor=color.white, size=size.tiny)
plotshape(dnos_tl > dnos_tl[1] ? high : na, "Lower Break", shape.labeldown, location.absolute, dnCss_tl, text="B", textcolor=color.white, size=size.tiny)

alertcondition(upos_tl > upos_tl[1], 'Upward Breakout', 'Price broke the down-trendline upward')
alertcondition(dnos_tl > dnos_tl[1], 'Downward Breakout', 'Price broke the up-trendline downward')

// Script 02 - Channel Breakout
length_channel = input.int(title="Channel Length", minval=1, maxval=1000, defval=5)
upBound_channel = ta.highest(high, length_channel)
downBound_channel = ta.lowest(low, length_channel)
if (not na(close[length_channel]))
    strategy.entry("LE-LE", strategy.long, stop=upBound_channel + syminfo.mintick, comment="LE-LE")
strategy.entry("BECH-DE", strategy.short, stop=downBound_channel - syminfo.mintick, comment="BECH-DE")

// Script 03 - MA Cross
shortlen_ma = input.int(5, "Short MA Length", minval=1)
longlen_ma = input.int(34, "Long MA Length", minval=1)
short_ma = ta.sma(close, shortlen_ma)
long_ma = ta.sma(close, longlen_ma)
plot(short_ma, color=#FF6D00, title="Short MA")
plot(long_ma, color=#43A047, title="Long MA")
plot(ta.cross(short_ma, long_ma) ? short_ma : na, color=#2962FF, style=plot.style_cross, linewidth=4, title="Cross")
Detail
https://www.fmz.com/strategy/442099
Last Modified
2024-02-19 11:52:40