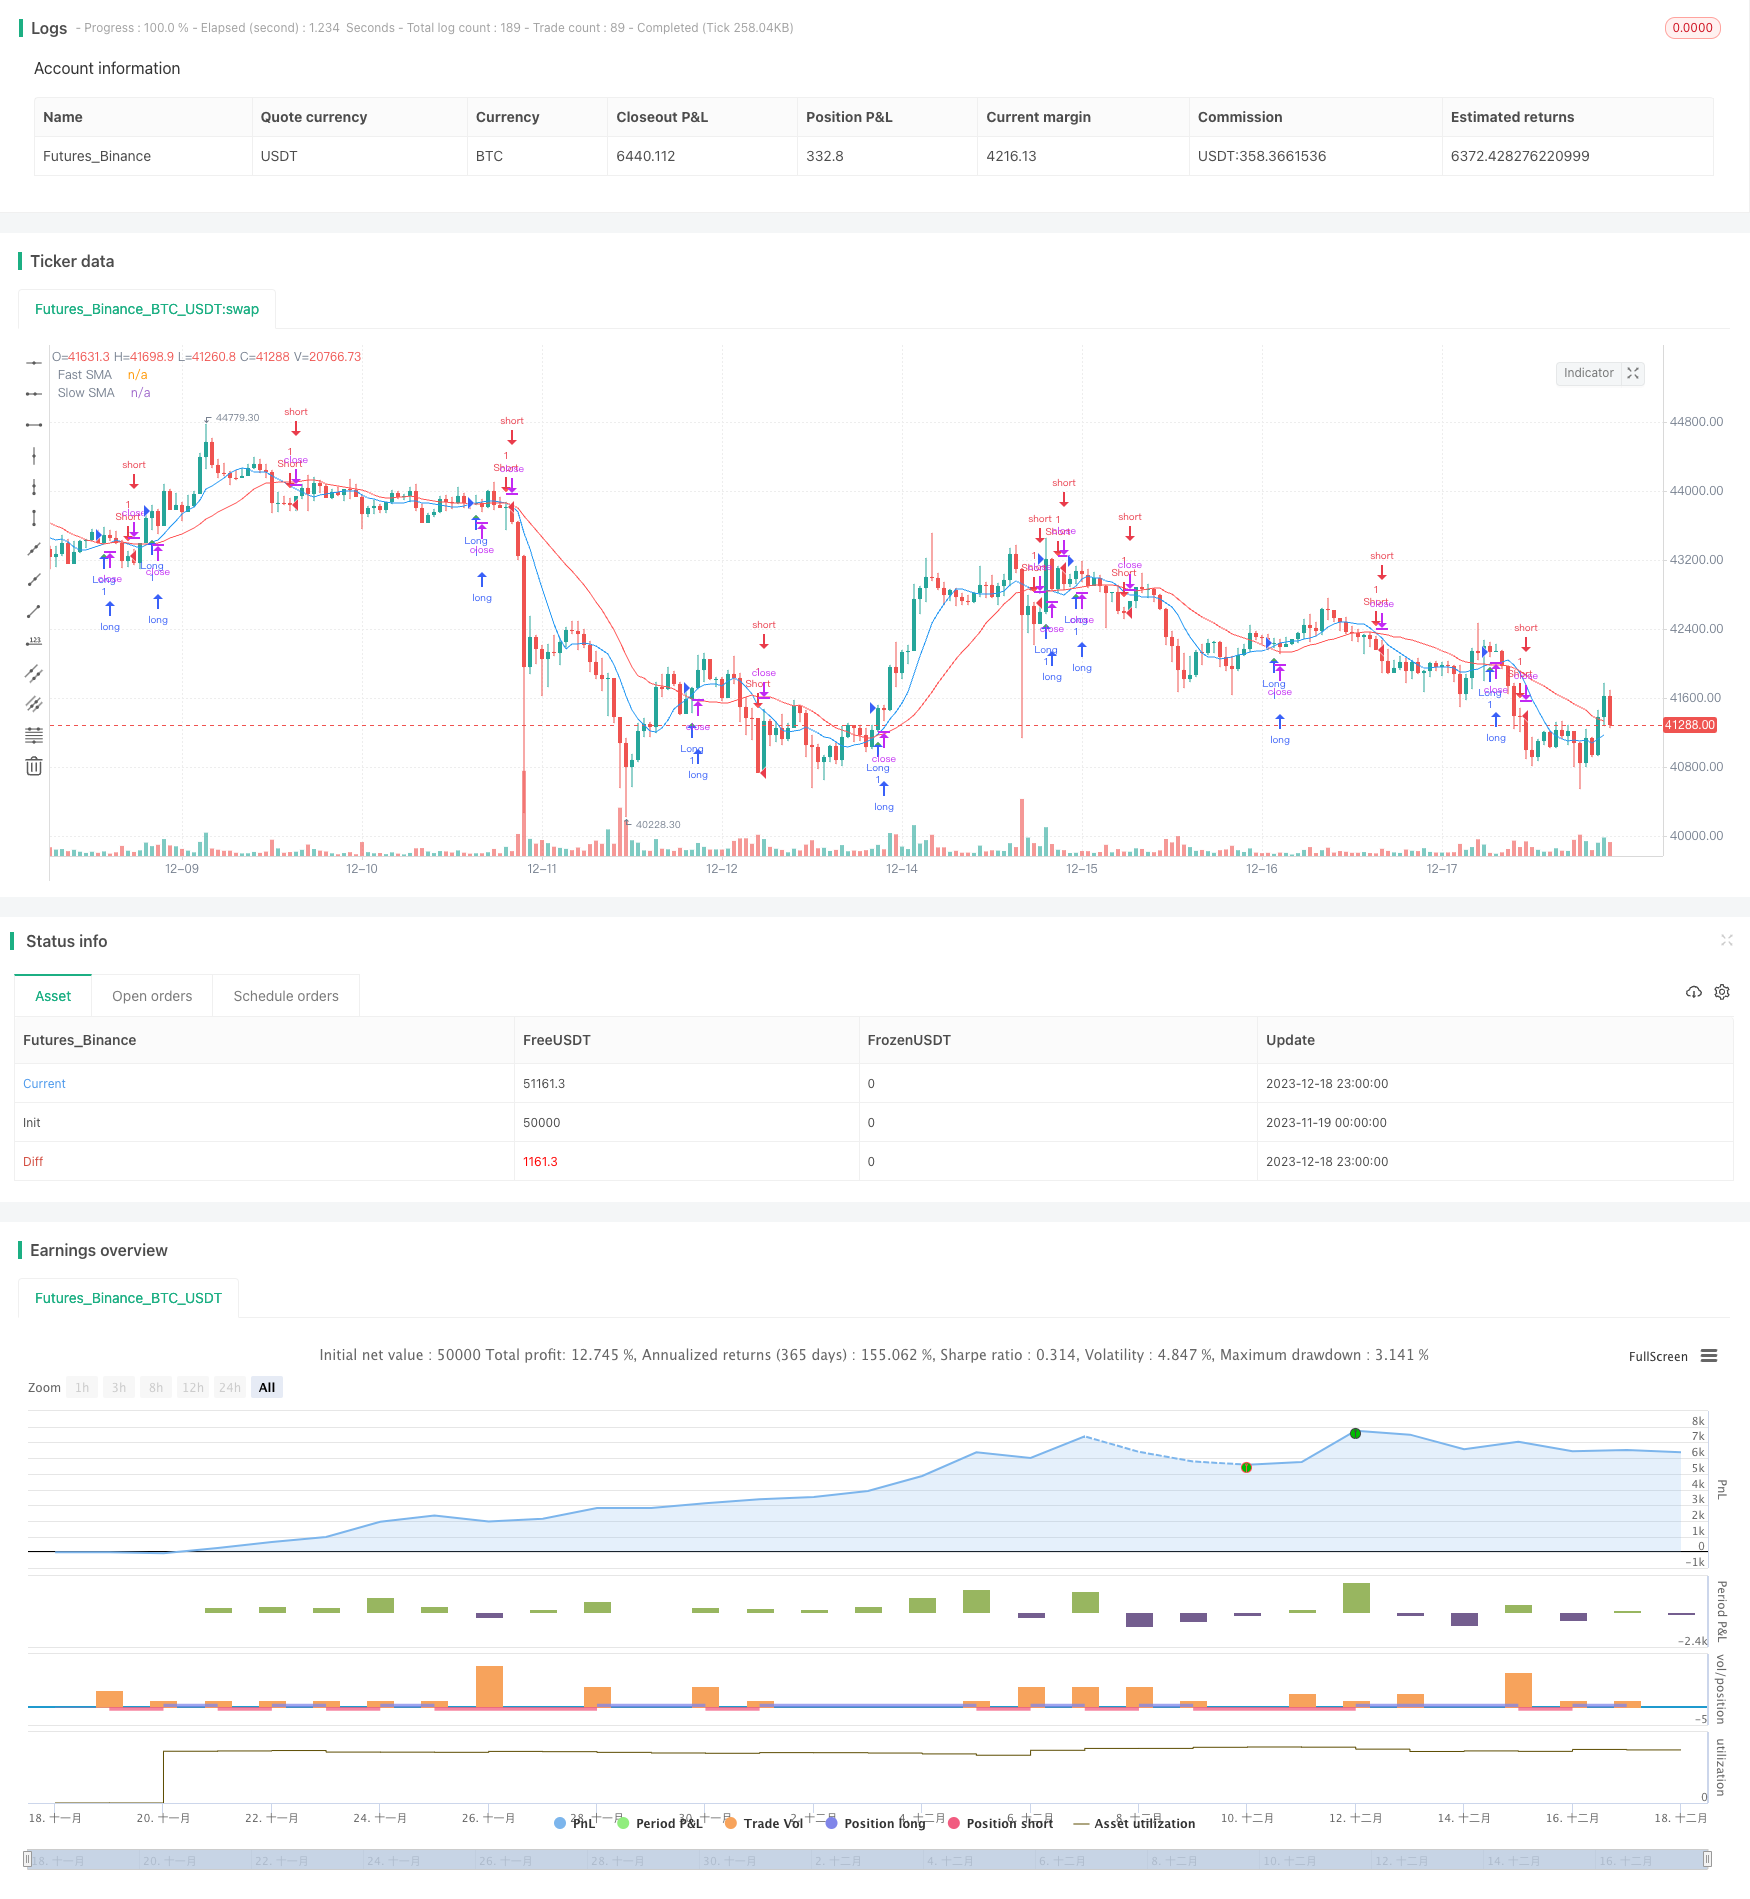
Name
基于均线交叉策略Simple-Moving-Average-Crossover-Strategy
Author
ChaoZhang
Strategy Description
该策略是一个基于 8 周期和 20 周期简单移动平均线(SMA)的交叉策略。当快速 SMA 上穿慢速 SMA 时做多,当快速 SMA 下穿慢速 SMA 时做空。该策略主要利用不同周期均线的交叉来捕捉趋势的变化。
- 计算 8 周期和 20 周期的 SMA。
- 当 8 周期 SMA 上穿 20 周期 SMA 时,做多。
- 当 8 周期 SMA 下穿 20 周期 SMA 时,做空。
- 平仓信号:当发生反向交叉时平掉当前头寸。
该策略利用快速均线和慢速均线的交叉来判断趋势的变化。由于快速均线对价格变化更为敏感,可以更早地捕捉到短期趋势的转折。当快速均线上穿慢速均线时,表示短线开始进入多头,这是一个做多的信号。当快速均线下穿慢速均线时,表示市场已经从多头转为空头,这是一个做空的信号。
- 概念简单,容易理解和实现。
- 参数选择灵活,可以根据市场调整均线参数。
- 交易信号明确,操作规则清晰。
- 能够有效地捕捉短期趋势的变化。
该策略最大的优势在于简单和直观,容易理解和实现。同时,也比较灵活,通过调整均线参数可以适应不同的市场环境。这可以作为一个基础策略,并在其基础上进行扩展和优化。
- 可能出现频繁的错诊和假信号。
- 无法判断趋势的长短,可能过早入场和离场。
- 大幅震荡市场中容易止损。
- 参数不当可能导致亏损。
由于该策略仅仅依赖均线交叉这样简单的指标,所以对复杂的市场情况判断能力较弱。无法判断具体的趋势长度和方向变化,可能过早入场和离场。同时也容易在震荡行情中被套住。此外参数选择不当也会直接影响策略表现。
可以通过和其他指标组合,判断趋势信号的确认来减少误判。同时适当放宽止损幅度也可以一定程度上避免震荡市场的亏损。
- 结合其他指标过滤信号。比如 KDJ,MACD等。
- 增加趋势判断规则,避免不必要的反转。
- 优化参数,调整均线周期。
- 结合波动率指标,根据市场调整止损位置。
该策略可以与其他指标组合使用,利用更多因子判断趋势信号,过滤假信号。同时通过趋势判断,避免过于频繁的反转。此外参数优化和止损优化也可以大幅提高策略稳定性。
该均线交叉策略概念简单,容易理解和实现。利用不同速度均线的交叉判断趋势变化,可以有效捕捉短期趋势。但也存在一些问题,识别能力较弱,容易产生误信号。通过与其他指标组合使用,适当调整参数和止损位置,可以获得更好的绩效。该策略为量化交易奠定了基础,也为进一步优化提供了方向。
||
This strategy is based on the crossover between an 8-period and a 20-period simple moving average (SMA). It goes long when the faster SMA crosses above the slower SMA and goes short when the faster SMA crosses below the slower SMA. The strategy mainly utilizes the crossover of different SMAs to capture trend changes.
- Calculate the 8-period and 20-period SMA.
- Go long when the 8-period SMA crosses above the 20-period SMA.
- Go short when the 8-period SMA crosses below the 20-period SMA.
- Exit signal: Close position when a reverse crossover happens.
The strategy captures changes in short-term trends using the crossover of the fast and slow SMA. As the faster SMA reacts more sensitively to price changes, it can detect reversals in short-term trends earlier. When the faster SMA crosses above the slower SMA, it signals that the short-term trend is turning bullish and a long position should be taken. When the faster SMA crosses below the slower SMA, it signals that the market is reversing from bull to bear and a short position should be taken.
- Simple concept, easy to understand and implement.
- Flexible parameter selection, can adapt to different market conditions.
- Clear trading signals and rules.
- Effectively captures changes in short-term trends.
The biggest advantage of this strategy is its simplicity and intuitiveness. It's easy to comprehend and implement. Meanwhile, it offers flexibility by tuning the SMA parameters to suit different market environments. It can serve as a basic strategy for further enhancements and optimizations.
- Frequent false signals or misjudgments possible.
- Hard to determine trend duration, premature entry or exit likely.
- Vulnerable to stop loss in volatile markets.
- Inappropriate parameters may lead to losses.
Since this strategy relies solely on simple SMA crossovers, its analytical capability is limited when facing complex market situations. It is unable to determine the strength or reversal points of trends, often resulting in premature entry or exit. It is also prone to being whipsawed in range-bound markets. In addition, improper parameter selection can directly impact strategy performance.
The risks can be reduced by combining with other indicators for signal confirmation and filtering. Widening the stop loss margin can also help endure volatility to some extent.
- Add other indicators for signal filtering, e.g. KDJ, MACD.
- Add trend determination rules to avoid unnecessary whipsaws.
- Optimize parameters like SMA periods.
- Incorporate volatility metrics to adjust stop loss levels dynamically.
This strategy can be augmented by using other indicators in combination for extra signal validity checks and filtering. Trend determination rules can also avoid excessive reversals. Parameters and stop loss optimization could greatly improve the stability of the strategy.
The SMA crossover strategy features simple logic that is easy to grasp and implement. It captures short-term trend changes effectively through fast and slow SMA crossovers. However, it also has some flaws like producing false signals occasionally due to its weak analytical capability. By combining with other indicators, tuning parameters and stop loss properly, it can achieve better performance. The strategy lays the foundation for algorithmic trading and points to further optimization directions.
[/trans]
Strategy Arguments
| Argument | Default | Description |
|---|---|---|
| v_input_int_1 | 8 | Fast SMA Length |
| v_input_int_2 | 20 | Slow SMA Length |
Source (PineScript)
/*backtest
start: 2023-11-19 00:00:00
end: 2023-12-19 00:00:00
period: 1h
basePeriod: 15m
exchanges: [{"eid":"Futures_Binance","currency":"BTC_USDT"}]
*/

//@version=5
strategy("SMA Crossover Strategy", overlay=true)

// Define SMA lengths
fastLength = input.int(8, title="Fast SMA Length", minval=1)
slowLength = input.int(20, title="Slow SMA Length", minval=1)

// Calculate SMAs
fastSMA = ta.sma(close, fastLength)
slowSMA = ta.sma(close, slowLength)

// Plot SMAs on the chart
plot(fastSMA, color=color.blue, title="Fast SMA")
plot(slowSMA, color=color.red, title="Slow SMA")

// Trading strategy
longCondition = ta.crossover(fastSMA, slowSMA)
shortCondition = ta.crossunder(fastSMA, slowSMA)

if (longCondition)
    strategy.entry("Long", strategy.long)

if (shortCondition)
    strategy.entry("Short", strategy.short)

if (ta.crossunder(fastSMA, slowSMA))
    strategy.close("Long")

if (ta.crossover(fastSMA, slowSMA))
    strategy.close("Short")

// Plot buy and sell signals on the chart
plotshape(series=longCondition, title="Buy Signal", color=color.green, style=shape.triangleup, location=location.belowbar)
plotshape(series=shortCondition, title="Sell Signal", color=color.red, style=shape.triangledown, location=location.abovebar)
Detail
https://www.fmz.com/strategy/435965
Last Modified
2023-12-20 14:36:08
