Name
基于费雪转换的Ehlers交易策略Ehlers-Fisher-Transform-Trading-Strategy
Author
ChaoZhang
Strategy Description
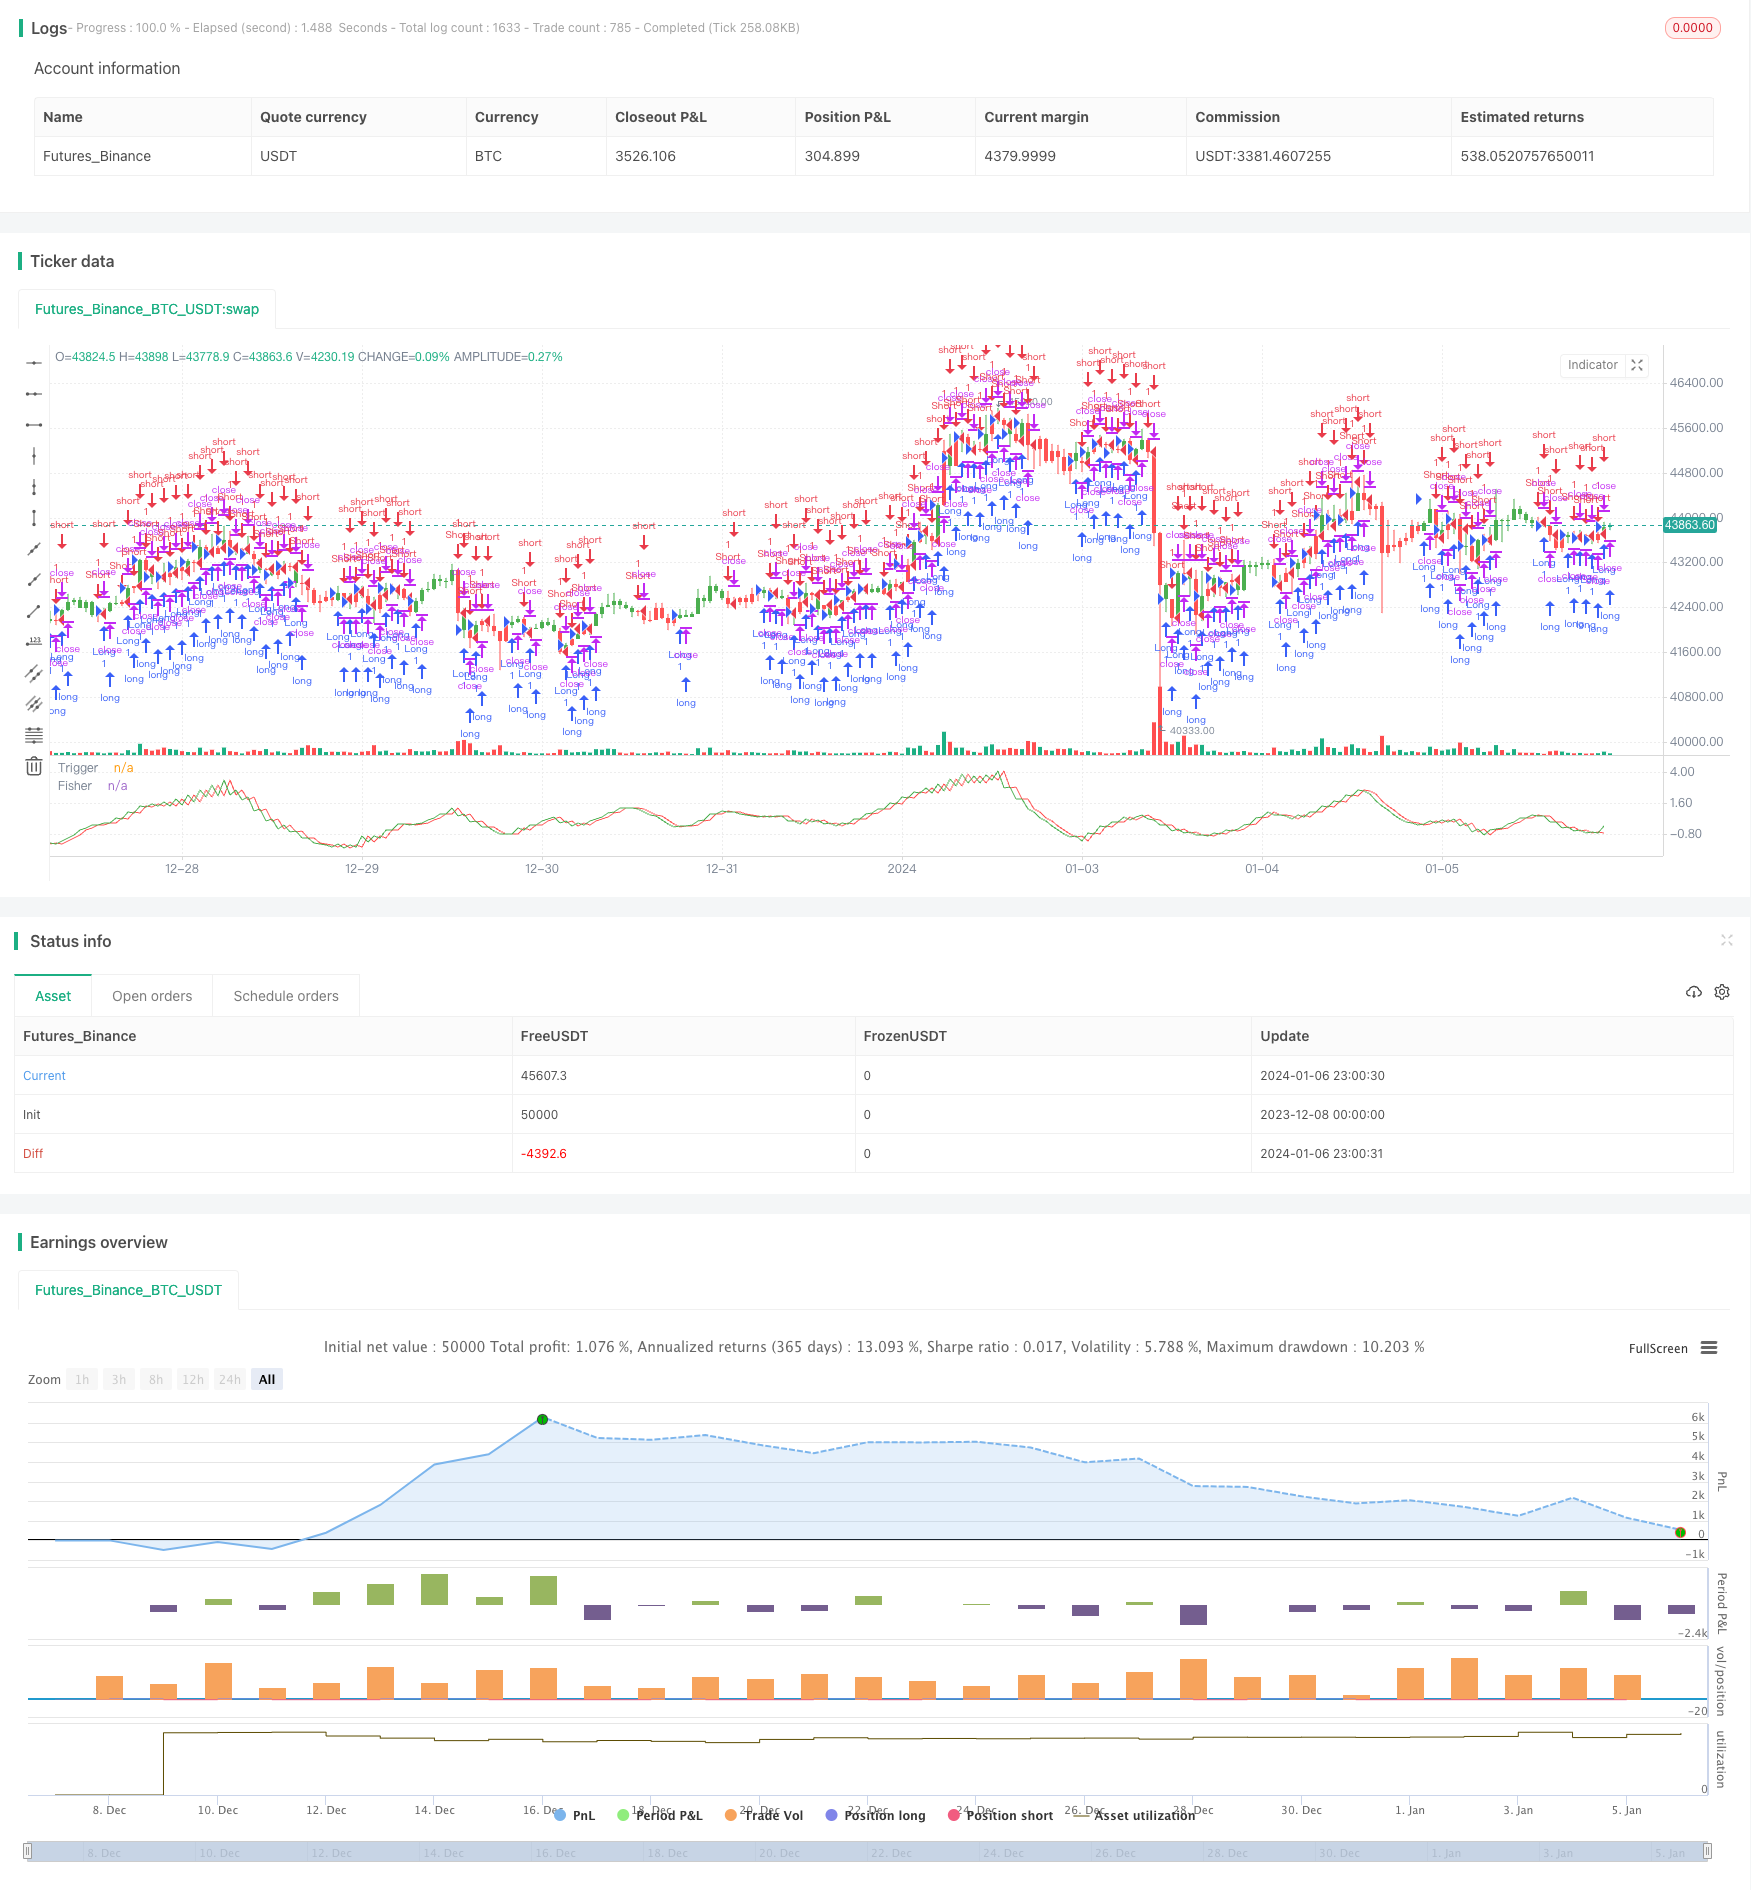
本策略基于技术分析大师John Ehlers设计的费雪转换指标,实现自动识别价格趋势反转点,进行长短仓自动交易。其最大优势在于识别价格反转的准确性和及时性。
本策略使用费雪转换公式进行价格标准化,生成近似高斯分布的价格序列。费雪转换公式为:y = 0.5 * ln((1+x)/(1-x))。通过此转换,可以将价格极值转换为相对更为罕见的事件。当最新费雪转换值高于或低于前一期时,表示可能出现价格反转。本策略即根据该指标的转折点来发出交易信号。
具体来说,策略步骤如下:
- 计算中价HL2;
- 计算Length周期内的最高价xMaxH和最低价xMinL;
- 计算标准化价格nValue1=(xHL2 - xMinL) / (xMaxH - xMinL) - 0.5;
- 对nValue1进行平滑处理,得到nValue2,防止取极值;
- 对nValue2应用费雪转换公式,得到费雪转换指标nFish;
- 比较nFish与前一期值,判断是否发生转折,并设置交易方向pos;
- 根据pos设置多空仓方向,发出交易信号。
本策略最大的优势在于其交易信号的准确性和及时性。由于费雪转换产生的价格序列近似符合高斯分布,价格出现反转时,费雪转换指标能够快速识别并做出相应反应。这能确保及时抓住反转机会。此外,Ehlers费雪转换指标本身也经过长期验证,反转信号的准确性也非常可靠。
本策略最大的风险在于费雪转换后的价格序列不一定完全符合理论上的高斯分布。当市场出现异常波动时,如断层、跳空等情况,会导致费雪转换指标发出错误信号。此时如果仍机械交易,可能造成较大损失。
为降低此风险,可以考虑结合其它指标进行交易信号过滤,避免在市场异常时仍然交易。或者可以适当调整参数,缩小交易频率和单笔盈亏规模。
本策略可以从以下几个方面进行优化:
- 优化Length参数,找到不同市场条件下的最优参数组合;
- 增加止损机制,限制单笔损失;
- 增加交易过滤,避免异常市场下的错误交易;
- 结合其他指标进行组合策略,提高信号的准确性。
本策略基于Ehlers设计的费雪转换指标,能够快速准确地识别价格反转点,从而及时抓住交易机会。它最大的优势在于交易信号的准确及时。同时也存在一定风险,需要对参数及交易规则进行优化,降低风险。总的来说,本策略值得进一步研究和应用。
||
This strategy is based on the Fisher Transform indicator designed by technical analysis master John Ehlers to automatically identify price trend reversal points for long/short trading. Its biggest advantage is the accuracy and timeliness of identifying price reversals.
This strategy uses the Fisher transform formula to standardize prices and generate a near-Gaussian distribution price sequence. The Fisher transform formula is: y = 0.5 * ln((1+x)/(1-x)). Through this transform, price extremes are converted to relatively rarer events. When the latest Fisher transformed value is higher/lower than the previous period, it indicates a possible price reversal. The strategy generates trading signals based on the turning points of this indicator.
Specifically, the strategy steps are as follows:
- Calculate the mid price HL2;
- Calculate the highest price xMaxH and lowest price xMinL over the Length period;
- Calculate the standardized price nValue1=(xHL2 - xMinL) / (xMaxH - xMinL) - 0.5;
- Smooth nValue1 to get nValue2, preventing extremes;
- Apply the Fisher transform formula on nValue2 to get the Fisher indicator nFish;
- Compare nFish with previous value to determine if a turn has occurred, and set the trading direction pos;
- Set long/short position based on pos to generate trading signals.
The biggest advantage of this strategy is the accuracy and timeliness of its trading signals. Because the Fisher transformed price sequence approximates a Gaussian distribution, price reversals can be quickly identified and reacted to by the Fisher indicator. This ensures timely catches of reversal opportunities. In addition, the Ehlers Fisher transform itself has also been extensively validated for highly reliable reversal signals.
The biggest risk of this strategy is that the Fisher transformed price sequence may not perfectly conform to the theoretical Gaussian distribution. Abnormal market fluctuations like gaps can cause the Fisher indicator to generate incorrect signals. Blindly trading on those signals can lead to major losses.
To mitigate this risk, we can consider combining other indicators for signal filtering, avoiding trades during abnormal markets. We can also fine tune parameters to reduce trading frequency and sizing.
This strategy can be optimized in the following aspects:
- Optimize the Length parameter to find best combinations for different market conditions;
- Add stop loss mechanisms to limit downside;
- Add trade filters to avoid incorrect trades in abnormal markets;
- Combine with other indicators to improve signal accuracy.
This strategy leverages Ehlers’ Fisher Transform indicator to quickly and accurately identify price reversal points for timely trade entries. Its biggest strength lies in the accuracy and timeliness of trading signals. There are also risks that need parameter tuning and trade rule optimizations to mitigate. Overall this strategy warrants further research and application.
[/trans]
Strategy Arguments
| Argument | Default | Description |
|---|---|---|
| v_input_1 | 10 | Length |
| v_input_2 | false | Trade reverse |
Source (PineScript)
/*backtest
start: 2023-12-08 00:00:00
end: 2024-01-07 00:00:00
period: 1h
basePeriod: 15m
exchanges: [{"eid":"Futures_Binance","currency":"BTC_USDT"}]
*/

//@version = 2
////////////////////////////////////////////////////////////
//  Copyright by HPotter v1.0 15/12/2016
// 	Market prices do not have a Gaussian probability density function
// 	as many traders think. Their probability curve is not bell-shaped.
// 	But trader can create a nearly Gaussian PDF for prices by normalizing
// 	them or creating a normalized indicator such as the relative strength
// 	index and applying the Fisher transform. Such a transformed output
// 	creates the peak swings as relatively rare events.
// 	Fisher transform formula is: y = 0.5 * ln ((1+x)/(1-x))
// 	The sharp turning points of these peak swings clearly and unambiguously
// 	identify price reversals in a timely manner.
//
// You can change long to short in the Input Settings
// Please, use it only for learning or paper trading. Do not for real trading.
////////////////////////////////////////////////////////////
strategy(title="Fisher Transform Indicator by Ehlers Backtest", shorttitle="Fisher Transform Indicator by Ehlers")
Length = input(10, minval=1)
reverse = input(false, title="Trade reverse")
xHL2 = hl2
xMaxH = highest(xHL2, Length)
xMinL = lowest(xHL2,Length)
nValue1 = 0.33 * 2 * ((xHL2 - xMinL) / (xMaxH - xMinL) - 0.5) + 0.67 * nz(nValue1[1])
nValue2 =   iff(nValue1 > .99,  .999,
	         iff(nValue1 < -.99, -.999, nValue1))
nFish = 0.5 * log((1 + nValue2) / (1 - nValue2)) + 0.5 * nz(nFish[1])
pos = iff(nFish > nz(nFish[1]), 1,
	   iff(nFish < nz(nFish[1]), -1, nz(pos[1], 0)))
possig = iff(reverse and pos == 1, -1,
          iff(reverse and pos == -1, 1, pos))
if (possig == 1)
    strategy.entry("Long", strategy.long)
if (possig == -1)
    strategy.entry("Short", strategy.short)
barcolor(possig == -1 ? red: possig == 1 ? green : blue )
plot(nFish, color=green, title="Fisher")
plot(nz(nFish[1]), color=red, title="Trigger")
Detail
https://www.fmz.com/strategy/438062
Last Modified
2024-01-08 16:51:10
