Name
基于趋势跟踪突破策略Trend-Tracking-Breakout-Strategy
Author
ChaoZhang
Strategy Description
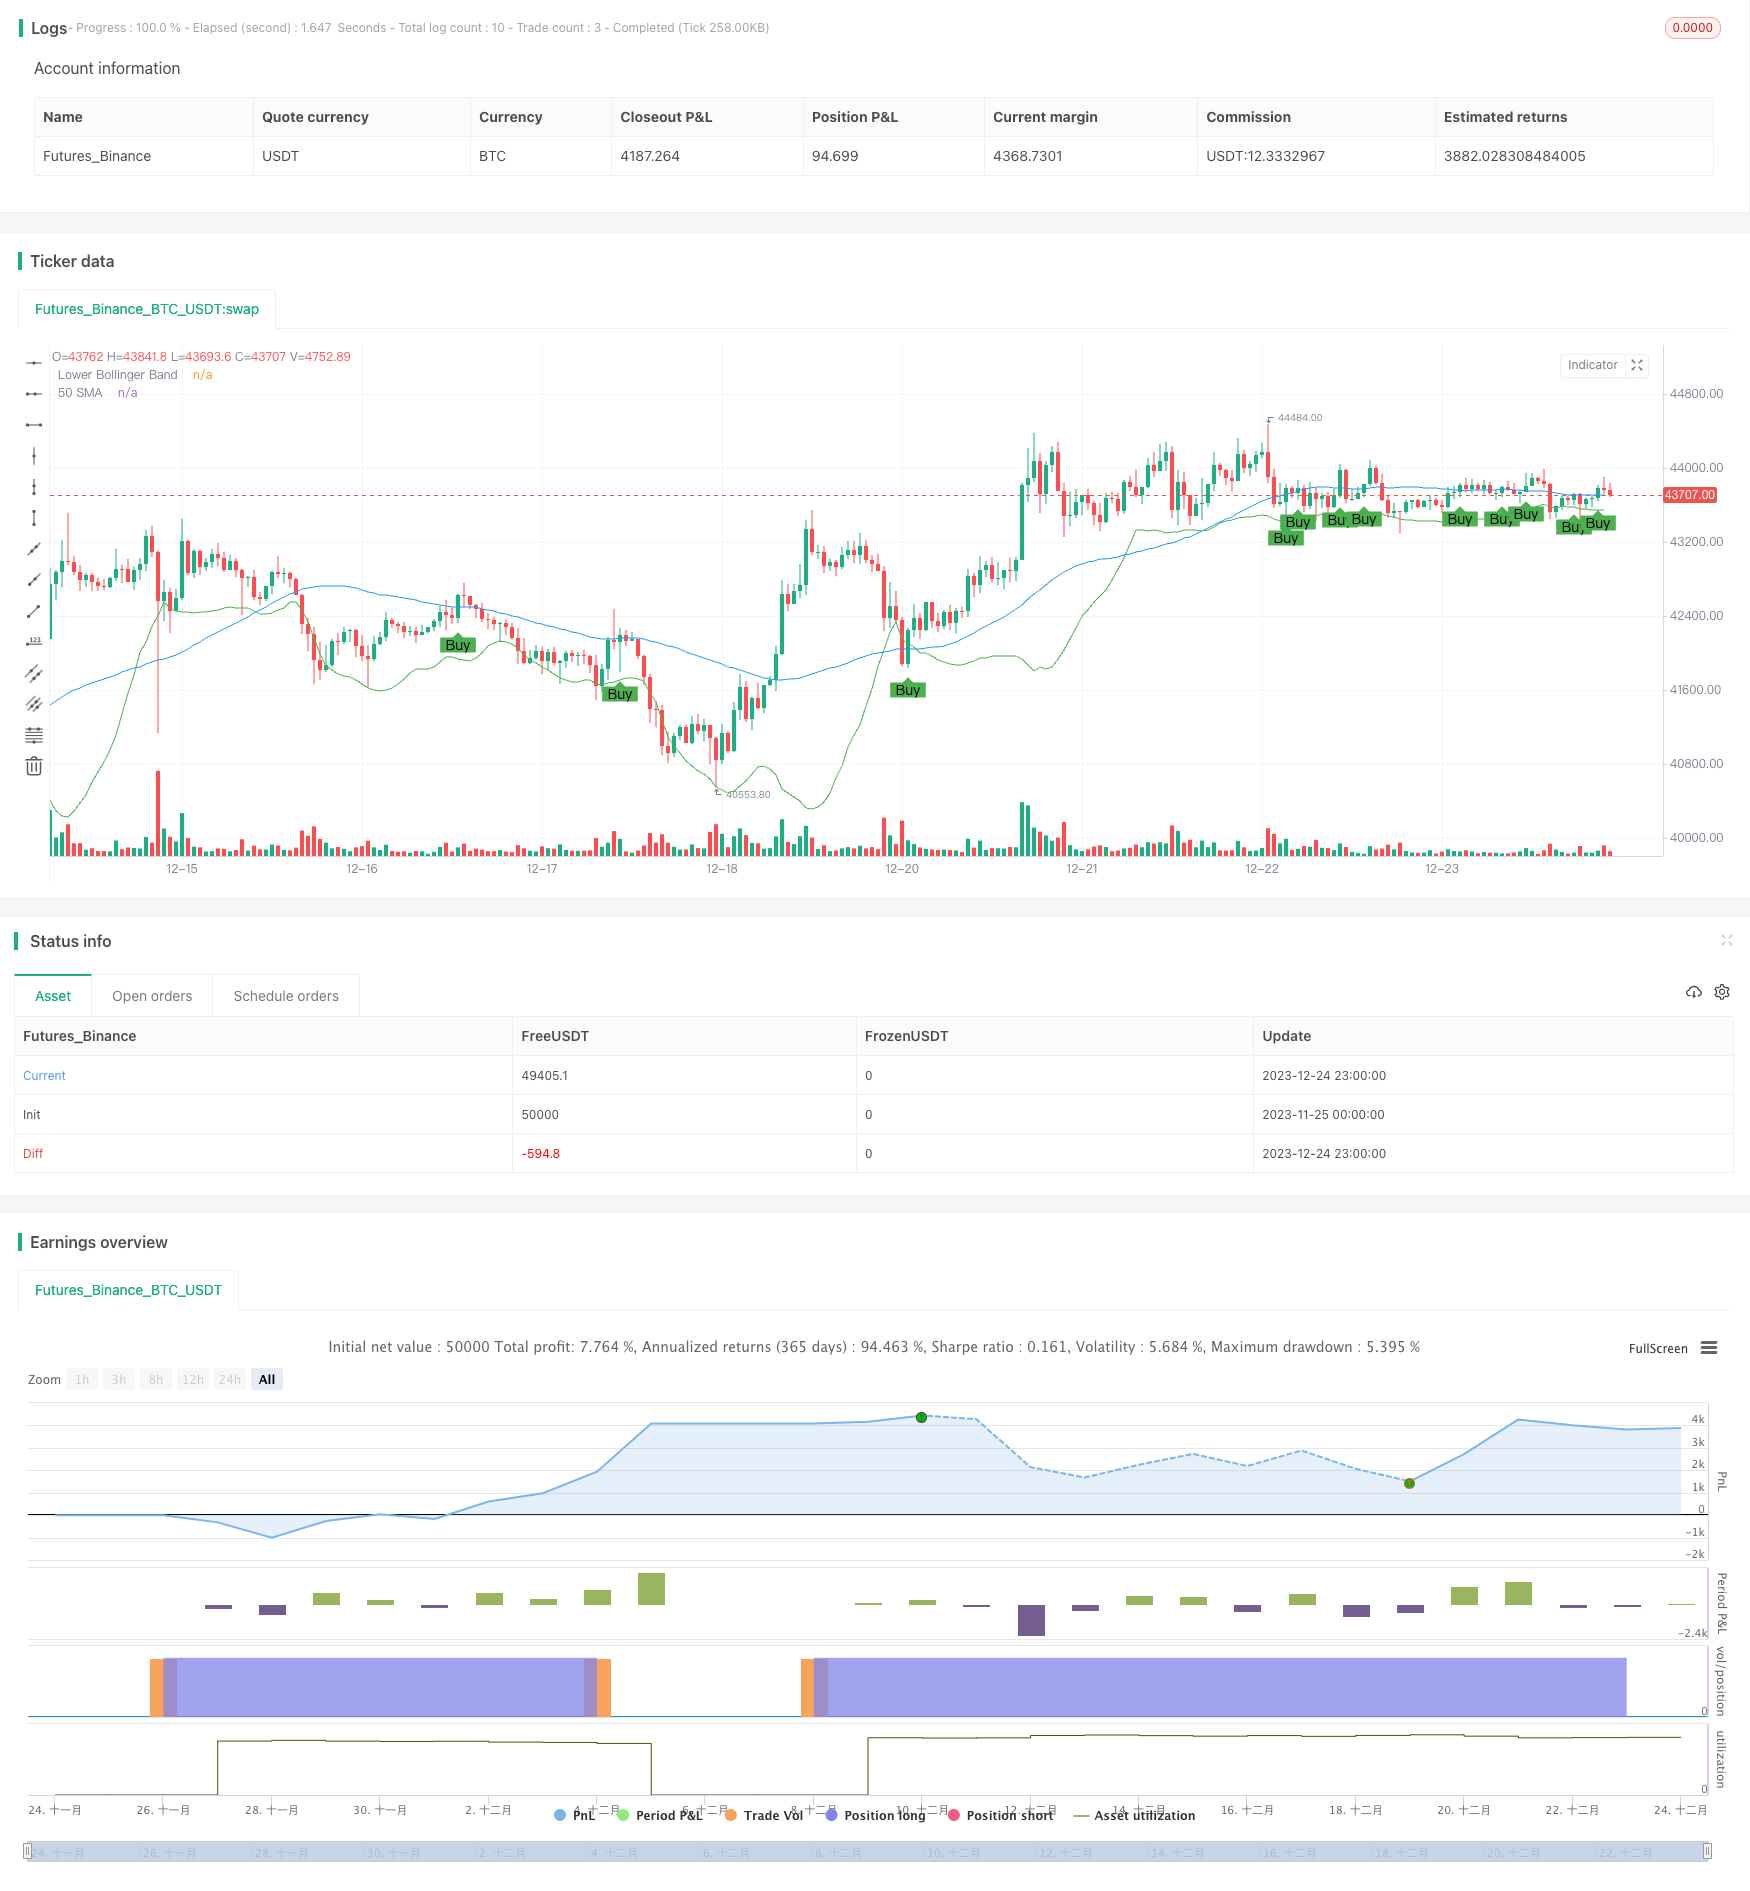
趋势跟踪突破策略是一个基于移动平均线和布林带指标的趋势跟踪策略。该策略结合趋势分析和突破交易的思想,在确定市场趋势的同时,寻找具有突破潜力的机会。
该策略使用50周期简单移动平均线判断趋势方向。当收盘价格上穿50日线时,考虑做多。同时,要求收盘价格高于下轨布林带,并且当前K线的最低价接近布林带下轨,表明价格在支撑位置附近,可能形成突破。
入场信号形成后,如果第二根K线的开盘价高于前一日最高价加1点的止损位置,则真正入场做多。
止损位置预先设置为入场那根K线最低价减5.7点。止盈位置设置为入场收盘价加11.4点,实现2倍的风险回报比。
该策略结合趋势判断和关键支撑附近形成的突破,可以有效过滤假突破,提高交易胜率。止损和止盈根据风险回报比原则设置,有利于风险控制。
相对简单的指标和判断条件,使策略容易理解和实现,适合量化交易初学者学习。
该策略主要依赖移动平均线判断趋势方向,当趋势变化时,可能产生错误信号。布林带参数设置不当也可能导致错误突破。
止损位置过于接近可能被秒出,止盈位置过大也可能限制盈利。这些参数的设置需要根据不同市场调整。
该策略仅考虑日内最高价和最低价,无法对隔夜跳空作出反应。
可以考虑结合其他指标判断趋势,如MACD。或者使用自适应移动平均线追踪趋势变化。
布林带参数可以进行优化,寻找最佳参数组合。止损止盈位置也可以根据回测结果优化。
可以增加对隔夜跳空的判断逻辑,避免跳空后的亏损扩大。
该策略整合趋势判断和突破交易的思路,使用简单指标形成过滤效果。策略优势在于易于理解和实现,通过参数优化可以获得较好的效果。但也存在一定的市场风险,需要根据实盘结果不断完善。
||
The Trend Tracking Breakout Strategy is a trend following strategy based on moving average and Bollinger Bands indicators. It combines the ideas of trend analysis and breakout trading, seeking breakout opportunities while determining the market trend.
The strategy uses the 50-period simple moving average (SMA) to determine the trend direction. A long position is considered when the closing price crosses above the 50-day SMA, indicating a potential upward trend.
At the same time, it requires the closing price to be above the lower Bollinger Band, suggesting the price is not in the lower extreme and may be poised for an upward move. The low of the candle must be within 1% of the lower Bollinger Band, indicating potential support near that level for a breakout.
After the entry signal is triggered, the strategy checks if the next day's opening price is above the stop level, which is set at 1 point above the highest price of the previous day, to confirm the actual entry.
The stop loss is preset at 5.7 points below the low of the entry bar. Take profit is set at 11.4 points above the closing price of the entry bar to achieve a 2:1 risk-reward ratio.
The strategy combines trend judgment and breakout near key support levels to effectively filter false breakouts and improve win rate. Stop loss and take profit are set according to risk-reward principles to aid risk control.
The relatively simple indicators and entry rules make the strategy easy to understand and implement, suitable for beginners to learn algorithmic trading.
The strategy relies mainly on moving averages to determine trend direction, which may generate incorrect signals when the trend changes. Improper Bollinger Bands parameters could also lead to false breakouts.
The stop loss being too close may get stopped out prematurely. Take profit being too wide could also limit profits. These parameters need adjusting for different markets.
The strategy only considers the daily high and low prices and cannot react to overnight gaps.
Other indicators could be combined to determine the trend, like MACD. Or adaptive moving averages can be used to track trend changes.
Bollinger Bands parameters can be optimized to find the best combination. Stop loss and take profit levels can also be optimized based on backtesting results.
Logic can be added to judge overnight gaps, avoiding widened losses after gaps.
The strategy integrates the ideas of trend following and breakout trading, using simple indicators to create a filtering effect. Its advantage lies in being easy to understand and implement. Through parameter optimization, better results can be achieved. But there are also market risks to be aware of, requiring continuous improvements based on live trading results.
[/trans]
Source (PineScript)
/*backtest
start: 2023-11-25 00:00:00
end: 2023-12-25 00:00:00
period: 1h
basePeriod: 15m
exchanges: [{"eid":"Futures_Binance","currency":"BTC_USDT"}]
*/

//@version=4
strategy("Custom Strategy", overlay=true)

// Input variables
smaLength = 50
bbLength = 20
supportPercentage = 1
riskRewardRatio = 2

// Calculate indicators
sma = sma(close, smaLength)
bb_lower = sma(close, bbLength) - 2 * stdev(close, bbLength)

// Entry conditions based on provided details
enterLongCondition = crossover(close, sma) and close > bb_lower and low <= (bb_lower * (1 + supportPercentage / 100))

// Entry and exit logic
if (enterLongCondition)
    strategy.entry("Long", strategy.long)

// Assuming the details provided are for the daily timeframe
stopLossPrice = low - 5.70
takeProfitPrice = close + 11.40

strategy.exit("Take Profit/Stop Loss", from_entry="Long", loss=stopLossPrice, profit=takeProfitPrice)

// Plotting
plot(sma, color=color.blue, title="50 SMA")
plot(bb_lower, color=color.green, title="Lower Bollinger Band")

// Plot entry points on the chart
plotshape(series=enterLongCondition, title="Buy Signal", location=location.belowbar, color=color.green, style=shape.labelup, text="Buy")
Detail
https://www.fmz.com/strategy/436603
Last Modified
2023-12-26 10:52:51
