Name
基于MA转折点的长短策略MA-Turning-Point-Long-and-Short-Strategy
Author
ChaoZhang
Strategy Description
[trans]
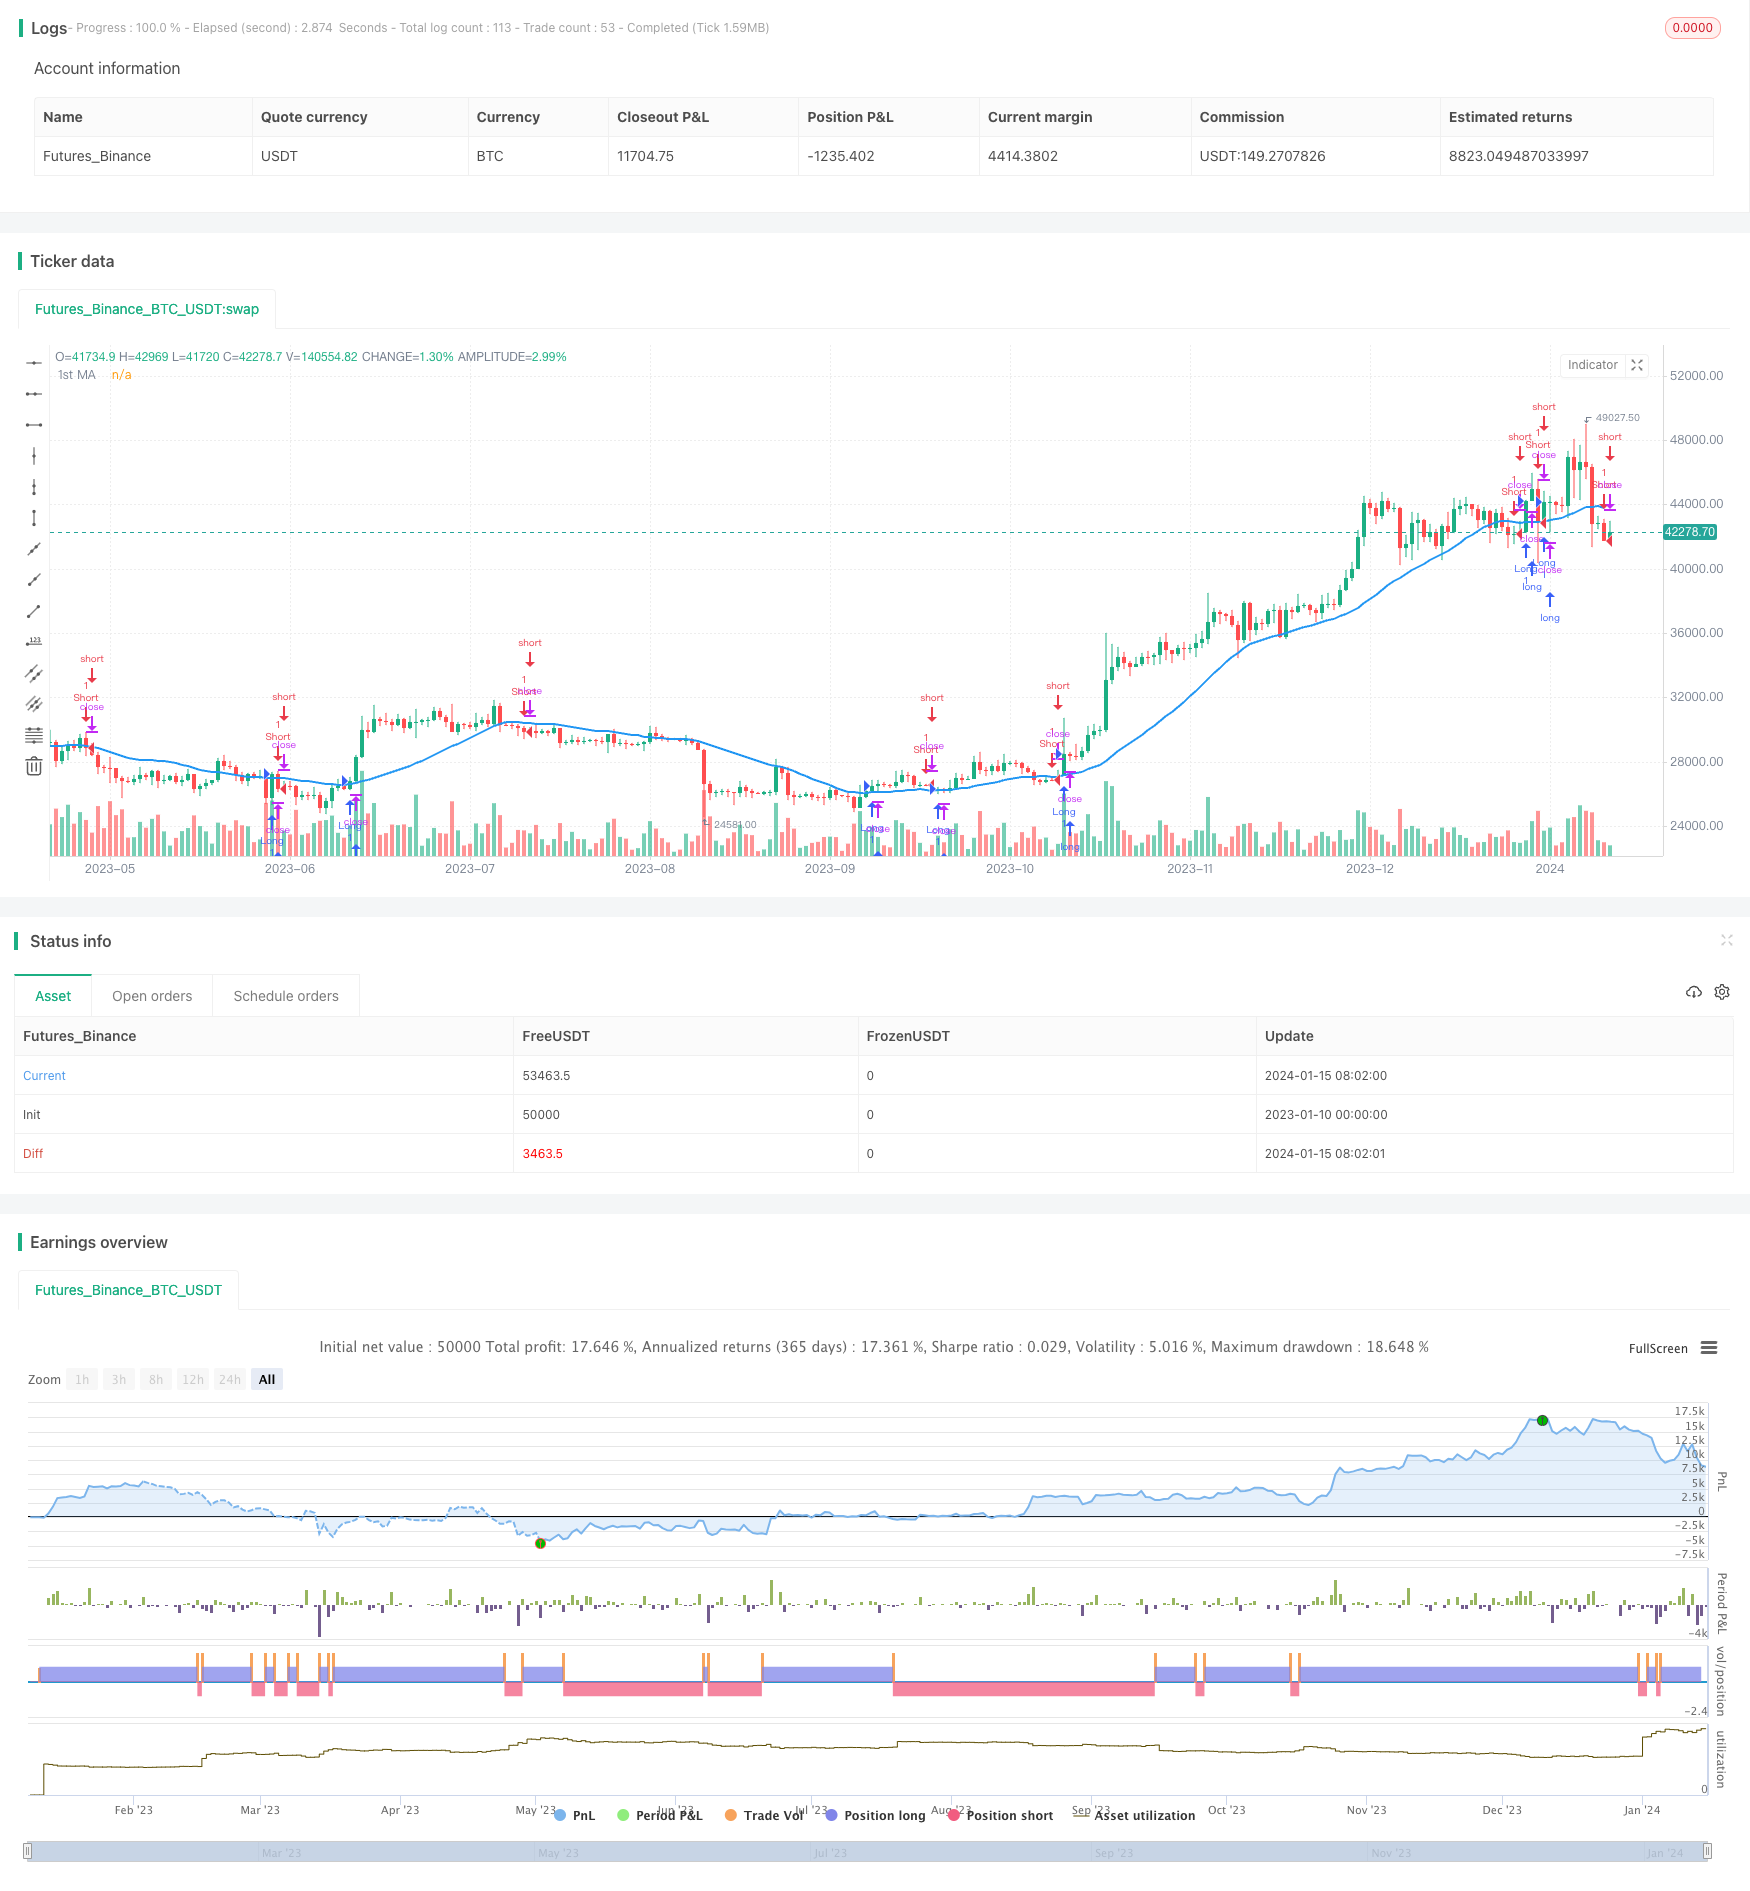
该策略基于移动平均线的转折点来判断行情趋势,在MA上向上转折点做多,在MA下向下转折点做空,属于典型的跟踪趋势型策略。
该策略使用price=security(tickerid, period, close)获取收盘价作为策略分析的价格,然后通过input选择计算sma平均线或ema平均线,长度是ma1,得到第一条平均线price1。然后定义roc1为price1的一日变化率,通过阈值trendStrength1来判断平均线是不是出现明显的上扬或下跌。当roc1超过trendStrength1时,定义ma1up为true,表示均线上扬;当roc1低于负的trendStrength1时,定义ma1down为true,表示均线下跌。在均线上扬时,如果前一日是下跌的,就发出做多信号;在均线下跌时,如果前一日是上扬的,就发出做空信号。
这样,该策略就利用了移动平均线转折点来捕捉股价趋势的转变,属于典型的跟踪趋势型策略。
该策略最大的优势在于利用了移动平均线的转折点来判断趋势,这是量化交易中一种较为成熟和可靠的技术分析方法。具体优势如下:
-
利用移动平均线过滤噪音, Accurately捕捉趋势转折点。移动平均线对价格进行了平滑,可以过滤掉部分噪音,使得识别趋势转折更加准确可靠。
-
结合变化率指标判断转折力度,避免假突破。该策略不仅检测了转折点,还设置了变化率radient的阈值,这样可以避免移动平均线上的假突破带来不必要的交易。
-
简单参数设置,容易掌握和回测优化。该策略只有一个移动平均线,几个参数,设置和优化都比较简单,容易让用户理解和掌握。
该策略的主要风险在于:
-
跟踪趋势策略,无法预测顶底点。该策略属于跟踪趋势型策略,只能跟在趋势的后面,无法预测市场的顶底点,容易错过瞬间的反转机会。
-
移动平均线延迟问题。移动平均线对价格走势的反映有一定的滞后性,可能会影响识别趋势转折的及时性。
-
前期参数优化不当直接影响效果。该策略的参数设置如平均线期数、变化率radient阈值,都会直接影响策略的盈利回撤水平,需要谨慎测试和优化。
对应解决方法是:
-
可以适当结合其他指标预测大级别的 熊市顶部和牛市底部。
-
测试EMA等响应速度更快的平均线替代SMA。
-
建议多组合优化寻找最佳参数设置。
该策略可以从以下几个方向进行进一步优化:
-
增加第二条移动平均线形成金叉死叉策略。这样可以利用双均线之间的关系来判断趋势和过滤噪音。
-
加入成交量的分析。通过观察成交量在均线转折点处的变化,可以进一步验证转折点的可靠性。
-
测试RSI、MACD等其他技术指标的辅助作用。这些指标都可以帮助判断趋势,与均线转折形成组合策略。
-
多种市场条件参数优化筛选。针对牛市、熊市、震荡行情分别测试优化参数设置组合。
-
利用机器学习方法动态优化参数。让程序自动评估不同市场环境下参数的稳定性,实现参数的动态优化。
该策略整体来说属于较为成熟的跟踪趋势型策略,有一定的实战价值。策略思路简单清晰,参数设置不多,容易理解测试。同时也存在跟踪延迟等问题。建议与其他指标组合使用,多情况测试优化,或者引入动态调整参数的机制,可以进一步增强策略的稳定性和实战效果。
||
This strategy judges the trend based on the turning points of the moving average line to go long at the MA uptrend turning point and go short at the MA downtrend turning point. It belongs to a typical trend-following strategy.
The strategy uses price=security(tickerid, period, close) to get the closing price as the price for strategy analysis, then calculates the SMA or EMA based on the input selection of ma1 length to get the first average line price1. roc1 is then defined as the one day change rate of price1. By the threshold trendStrength1, it judges whether the average line has a significant rise or fall. When roc1 exceeds trendStrength1, ma1up is defined as true, indicating that the average line is rising. When roc1 is below negative trendStrength1, ma1down is defined as true, indicating that the average line is falling. A long signal is issued when the average line rises and the previous day was falling. A short signal is issued when the average line falls and the previous day was rising.
Thus, the strategy utilizes the turning points of the moving average line to capture the trend change of the stock price, which belongs to a typical trend following strategy.
The biggest advantage of this strategy is that it utilizes the turning points of the moving average line to judge the trend, which is a relatively mature and reliable technical analysis method in quantitative trading. The specific advantages are:
-
Use moving averages to filter noise and accurately capture trend turning points. The moving average smoothes out prices and can filter out some noise to more reliably identify trend reversals.
-
Combine rate of change indicators to determine the intensity of reversals to avoid false breakouts. This strategy not only detects turning points, but also sets a threshold for the rate of change gradient, so it can avoid unnecessary trades caused by false breakouts on the moving average.
-
Simple parameter settings for easy backtesting optimization. This strategy has only one moving average and a few parameters that are easy for users to understand and master.
The main risks of this strategy are:
-
Trend following strategy cannot predict tops and bottoms. This strategy is a trend following strategy that can only follow trends and cannot predict market tops and bottoms, easily missing instant reversal opportunities.
-
Moving average lag problem. Moving averages have a certain lag in reflecting price movements, which may affect the timeliness of identifying trend reversals.
-
Improper prior parameter optimization directly affects results. Parameter settings of this strategy like number of periods of the average line and threshold of rate of change gradient will directly affect the strategy's profit, drawdown etc. and needs to be carefully tested and optimized.
The corresponding solutions are:
-
Appropriately combine other indicators to predict major bull and bear turning points.
-
Test EMA and other faster moving averages instead of SMA.
-
It is recommended to multi-optimize to find the best parameter settings.
This strategy can be further optimized in the following directions:
-
Add a second moving average line to form a golden cross and dead cross strategy. This utilizes the relationship between dual moving averages to determine trends and filter noise.
-
Add volume analysis. By observing changes in volume at the moving average turning points, it can further verify the reliability of the turning points.
-
Test assisting roles of other technical indicators like RSI and MACD. These indicators can also help determine trends and form combination strategies with moving average turning points.
-
Multi-market condition parameter optimization and screening. Separately test and optimize parameter settings for combinations under bull market, bear market, range-bound market conditions.
-
Use machine learning methods to dynamically optimize parameters over different market environments and assess parameter robustness for dynamic optimization.
In summary, this is a relatively mature trend following strategy with some practical value. The strategy idea is simple and clear, with few adjustable parameters, which is easy to understand and test. At the same time, there are also problems like trend following lag. It is recommended to combine with other indicators, test and optimize across situations, or introduce mechanisms for dynamic parameter adjustment to further enhance the stability and practical effect of the strategy.
[/trans]
Strategy Arguments
| Argument | Default | Description |
|---|---|---|
| v_input_1_close | 0 | Source: close |
| v_input_2 | 25 | 1st MA Length |
| v_input_3 | 0 | 1st MA Type: SMA |
| v_input_4 | true | Lookback 1 |
| v_input_5 | 2.5 | Minimum slope magnitude * 100 |
Source (PineScript)
/*backtest
start: 2023-01-10 00:00:00
end: 2024-01-16 00:00:00
period: 1d
basePeriod: 1h
exchanges: [{"eid":"Futures_Binance","currency":"BTC_USDT"}]
*/

//@version=3
strategy("MA Turning Point Strategy", overlay=true)
src = input(close, title="Source")

price = request.security(syminfo.tickerid, timeframe.period, src)
ma1 = input(25, title="1st MA Length")
type1 = input("SMA", "1st MA Type", options=["SMA", "EMA"])

price1 = if (type1 == "SMA")
    sma(price, ma1)
else
    ema(price, ma1)

plot(series=price1, style=line,  title="1st MA", color=blue, linewidth=2, transp=0)

lookback1 = input(1, "Lookback 1")
roc1 = roc(price1, lookback1)

ma1up = false
ma1down = false
ma2up = false
ma2down = false

ma1up := nz(ma1up[1])
ma1down := nz(ma1down[1])
ma2up := nz(ma2up[1])
ma2down := nz(ma2down[1])

trendStrength1 = input(2.5, title="Minimum slope magnitude * 100", type=float) * 0.01

if crossover(roc1, trendStrength1)
    ma1up := true
    ma1down := false

if crossunder(roc1, -trendStrength1)
    ma1up := false
    ma1down := true

longCondition = ma1up and ma1down[1]
if (longCondition)
    strategy.entry("Long", strategy.long)

shortCondition = ma1down and ma1up[1]
if (shortCondition)
    strategy.entry("Short", strategy.short)
Detail
https://www.fmz.com/strategy/439051
Last Modified
2024-01-17 11:56:53
