Name
基于OBV和CCI指标的趋势追踪策略OBV-and-CCI-Indicators-Based-Trend-Following-Strategy
Author
ChaoZhang
Strategy Description
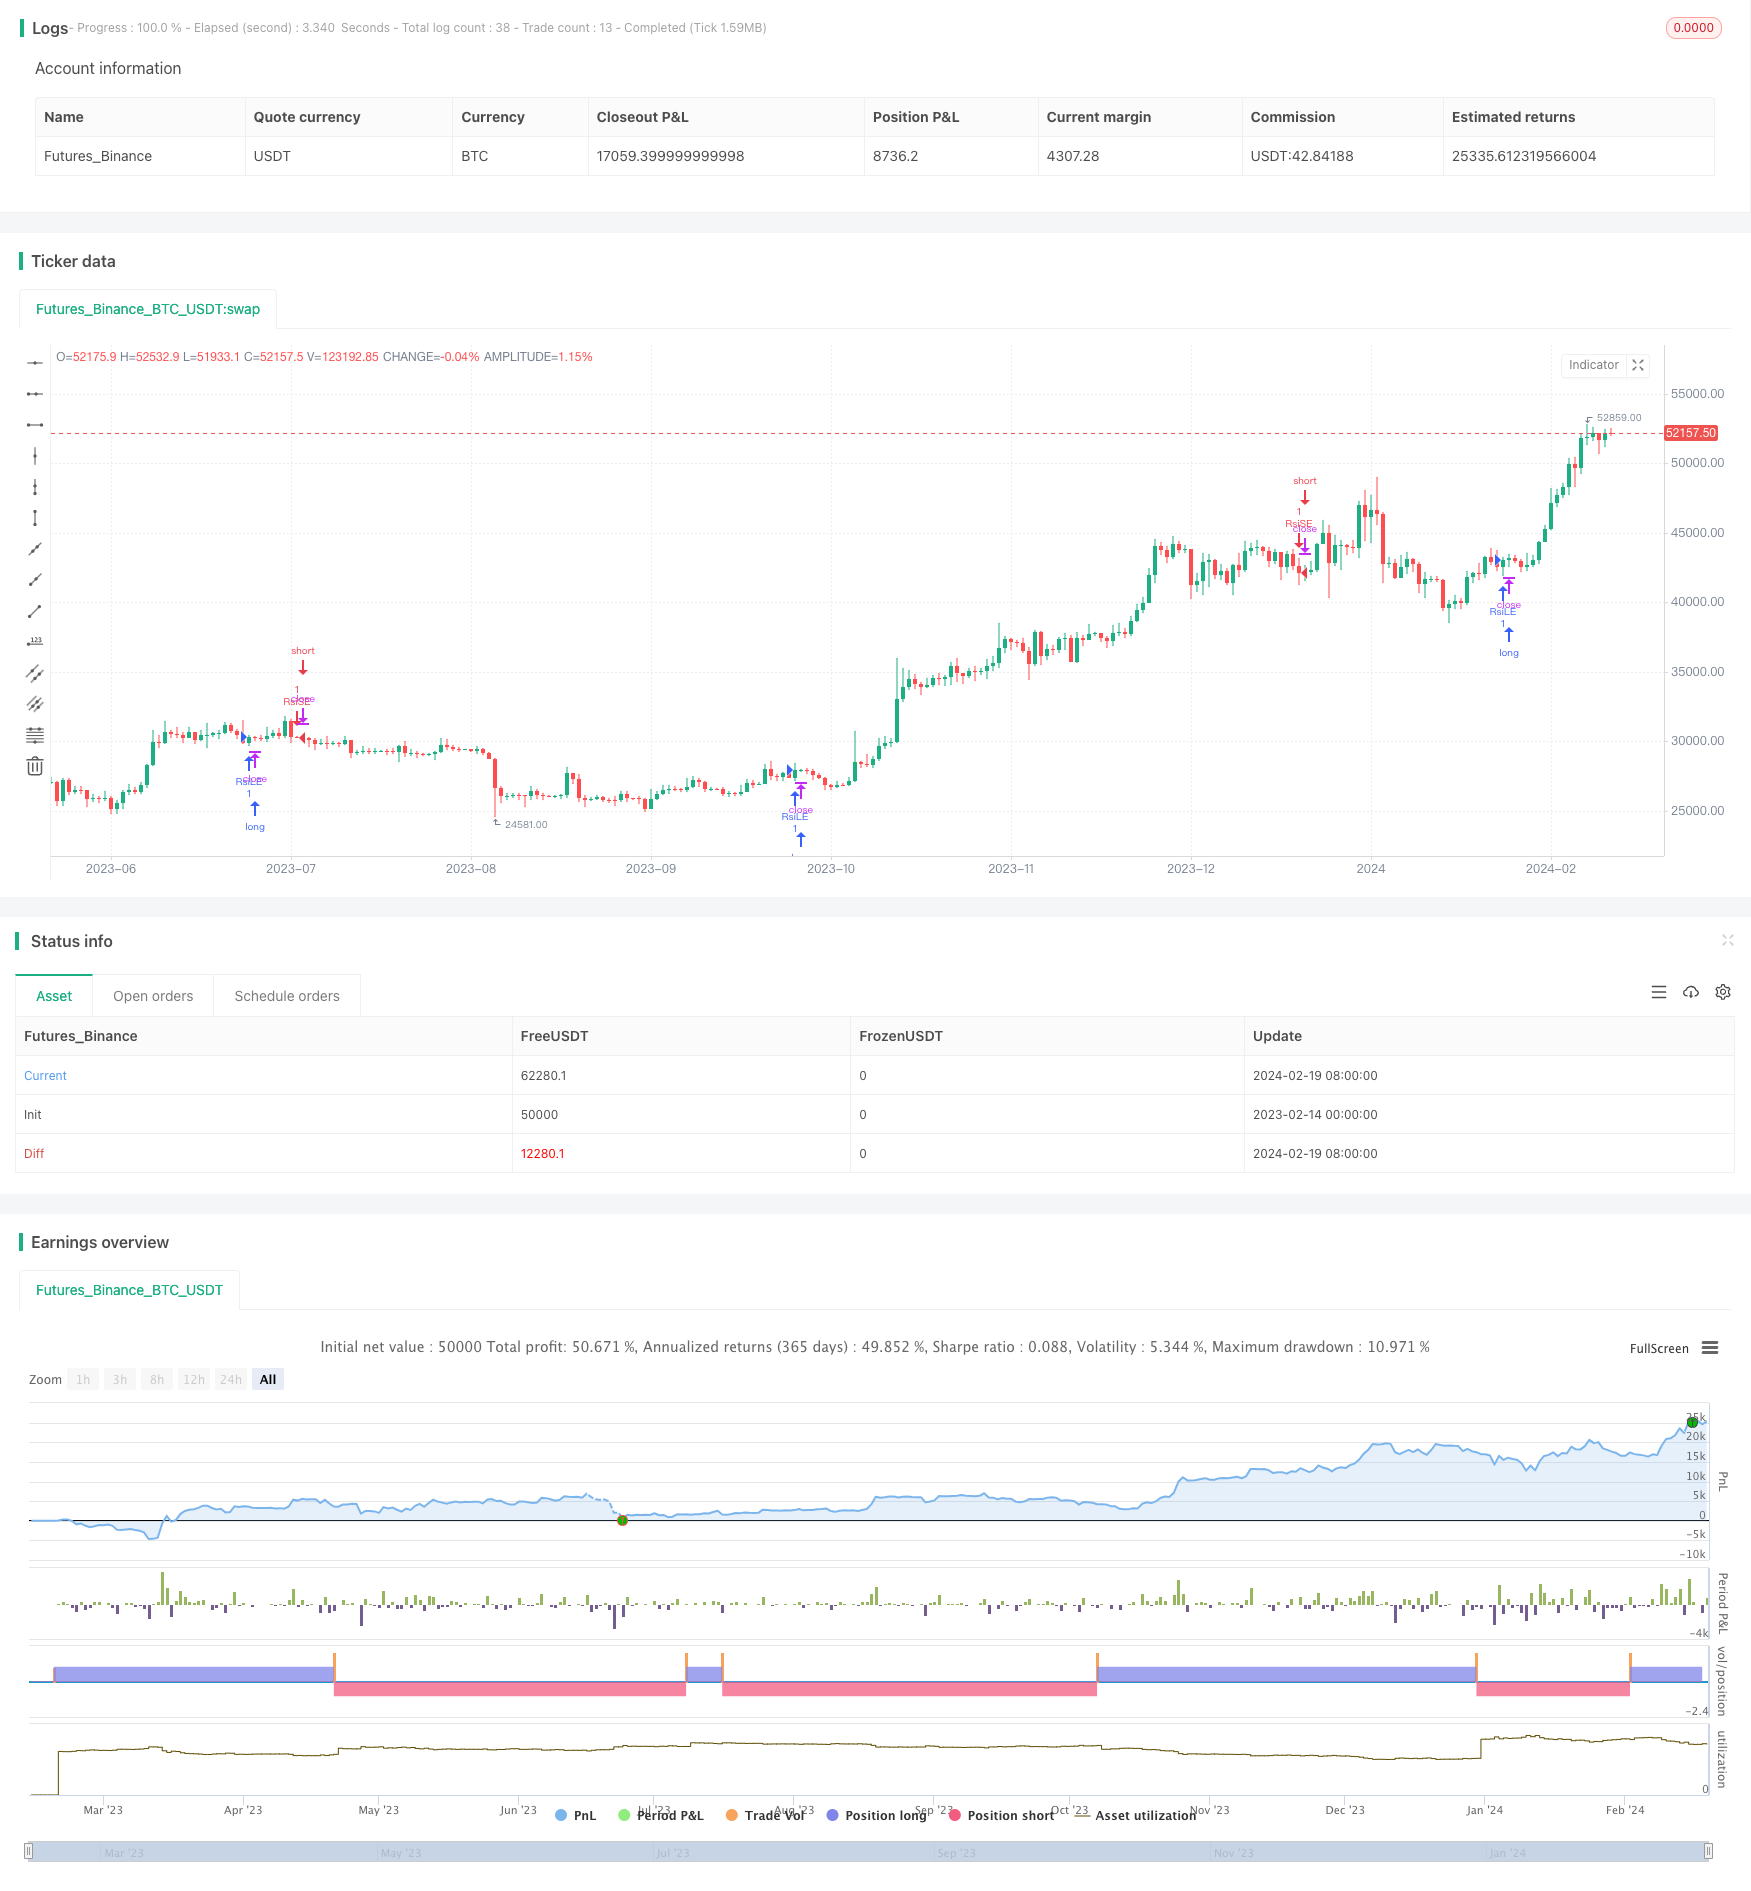
该策略是一种基于OBV和CCI指标的趋势追踪策略。它通过OBV指标判断市场趋势和资金流向,再利用CCI指标进行滤波,产生交易信号。当OBV和CCI指标都确认当前是上升趋势时,做多;当OBV和CCI指标都确认当前是下降趋势时,做空。
该策略主要依赖OBV和CCI两个指标。OBV指标可以反映市场的资金流动情况。当OBV是绿色时,表示当前是资金流入的趋势;当OBV是红色时,表示当前是资金流出的趋势。CCI指标则是用来滤波, Setting一个阈值,当CCI高于阈值时视为多头市场,当CCI低于阈值时视为空头市场。
在进入信号判断上,如果前一周期OBV值为绿色(资金流入)而且CCI高于阈值(属于多头市场),同时OBV线上穿其EMA均线,产生买入信号。
在平仓信号判断上,如果前一周期OBV值为红色(资金流出)而且CCI低于阈值(属于空头市场),同时OBV线下穿其EMA均线,产生卖出信号。
这样,通过OBV判断大方向,CCI指标进行滤波,两者结合 using EMA均线的金叉死叉产生具体的交易信号,实现了趋势追踪。
该策略主要有以下优势:
-
使用OBV判断市场资金流向和趋势方向,避免被短期市场噪音干扰;
-
借助CCI指标进行滤波,使交易信号更加可靠;
-
使用EMA均线金叉死叉产生具体的交易信号点,质量较高;
-
规则清晰简单,容易理解和实施。
该策略也存在一些潜在风险:
-
OBV和CCI指标发出错误信号的可能性;
-
交易信号频繁,容易过度交易;
-
回调期间可能被套牢;
-
参数设置不当导致策略效果变差。
针对这些风险,可以通过优化参数,调整交易频率,设置止损以及使用过滤器等方法进行控制和优化。
该策略可以从以下几个方向进行优化:
-
评估不同参数对策略效果的影响,寻找最优参数组合;
-
设置交易频率限制,避免过度交易;
-
增加止损机制,控制单笔损失;
-
添加其他指标过滤器,提升信号质量;
-
优化进入和平仓逻辑,使交易信号更加可靠。
该策略整体来说是一个基础性策略,可有效追踪价格趋势,避免噪音干扰。但也存在一定风险,需要通过参数优化,止损设置,交易频率控制等手段进行改进。如果参数选取科学,回测效果可以获得明显改善。该策略适合更高级别的量化交易员学习和实践。
||
This strategy is a trend following strategy based on OBV and CCI indicators. It uses OBV indicator to judge market trend and capital flow, and then uses CCI indicator for filtering to generate trading signals. When both OBV and CCI indicators confirm the current uptrend, go long; when both indicators confirm the current downtrend, go short.
The strategy mainly relies on OBV and CCI two indicators. OBV indicator can reflect the capital flow in the market. When OBV is green, it means the current trend is capital inflow; when OBV is red, it means the current trend is capital outflow. The CCI indicator is used as a filter. By setting a threshold, when CCI is above threshold, it is considered a bull market; when CCI is below threshold, it is considered a bear market.
For entry signals, if last period OBV value is green (capital inflow) and CCI is above threshold (in a bull market), meanwhile OBV line crosses above its EMA line, a buy signal is generated.
For exit signals, if last period OBV value is red (capital outflow) and CCI is below threshold (in a bear market), meanwhile OBV line crosses below its EMA line, a sell signal is generated.
So by judging the major trend using OBV, filtering with CCI indicator, and combining them using EMA crossovers to generate concrete trading signals, the strategy realizes trend following.
The main advantages of this strategy are:
-
Using OBV to determine market capital flow and trend direction, avoiding short-term market noise interference;
-
Leveraging CCI indicator for filtering, making trading signals more reliable;
-
Using EMA crossovers to generate high quality concrete trading points;
-
The rules are clear and simple, easy to understand and implement.
There are also some potential risks for this strategy:
-
Possibility of OBV and CCI indicators generating wrong signals;
-
Frequent trading signals, easy to overtrade;
-
May be trapped during retracements;
-
Poor parameter tuning leading to bad strategy performance.
To control these risks, methods like parameter optimization, adjusting trading frequency, setting stop loss and using filters can be applied.
The strategy can be optimized from the following aspects:
-
Evaluate the impact of different parameters and find the optimal parameter combination;
-
Set trading frequency limit to avoid over trading;
-
Add stop loss mechanism to control single trade loss;
-
Add other indicators as filters to improve signal quality;
-
Optimize entry and exit logic to make trading signals more reliable.
In summary, this is a basic trend following strategy that can effectively track price trends and avoid noise interference. But there are still some risks, requiring improvements like parameter optimization, stop loss, trading frequency control etc. If parameters are set scientifically, significant backtest performance improvement can be achieved. The strategy suits more advanced quant traders for learning and practicing.
[/trans]
Strategy Arguments
| Argument | Default | Description |
|---|---|---|
| v_input_1 | 20 | CCI Length |
| v_input_2 | false | CCI threshold for OBV coding |
| v_input_3 | 13 | EMA length |
Source (PineScript)
/*backtest
start: 2023-02-14 00:00:00
end: 2024-02-20 00:00:00
period: 1d
basePeriod: 1h
exchanges: [{"eid":"Futures_Binance","currency":"BTC_USDT"}]
*/

//author: SudeepBisht
//@version=3
strategy("SB_CCI coded OBV Strategy", overlay=true)

src = close
length = input(20, minval=1, title="CCI Length")
threshold=input(0, title="CCI threshold for OBV coding")
lengthema=input(13, title="EMA length")
obv(src) =>
    cum(change(src) > 0 ? volume : change(src) < 0 ? -volume : 0*volume)

o=obv(src)
c=cci(src, length)
col=c>=threshold?green:red
chk=col==green?1:0
ema_line=ema(o,lengthema)

//plot(o, color=c>=threshold?green:red, title="OBV_CCI coded", linewidth=2)
//plot(ema(o,lengthema), color=orange, linewidth=2)


if (not na(ema_line))
    if (crossover(o, ema_line) and chk[1]==1)
        strategy.entry("RsiLE", strategy.long, comment="RsiLE")
    if (crossunder(o, ema_line) and chk[1]==0)
        strategy.entry("RsiSE", strategy.short, comment="RsiSE")
Detail
https://www.fmz.com/strategy/442364
Last Modified
2024-02-21 14:05:12