Name
基于RSI和Estocastic指标的TSLA交易策略TSLA-Quantitative-Trading-System-Across-Multiple-Timeframes
Author
ChaoZhang
Strategy Description
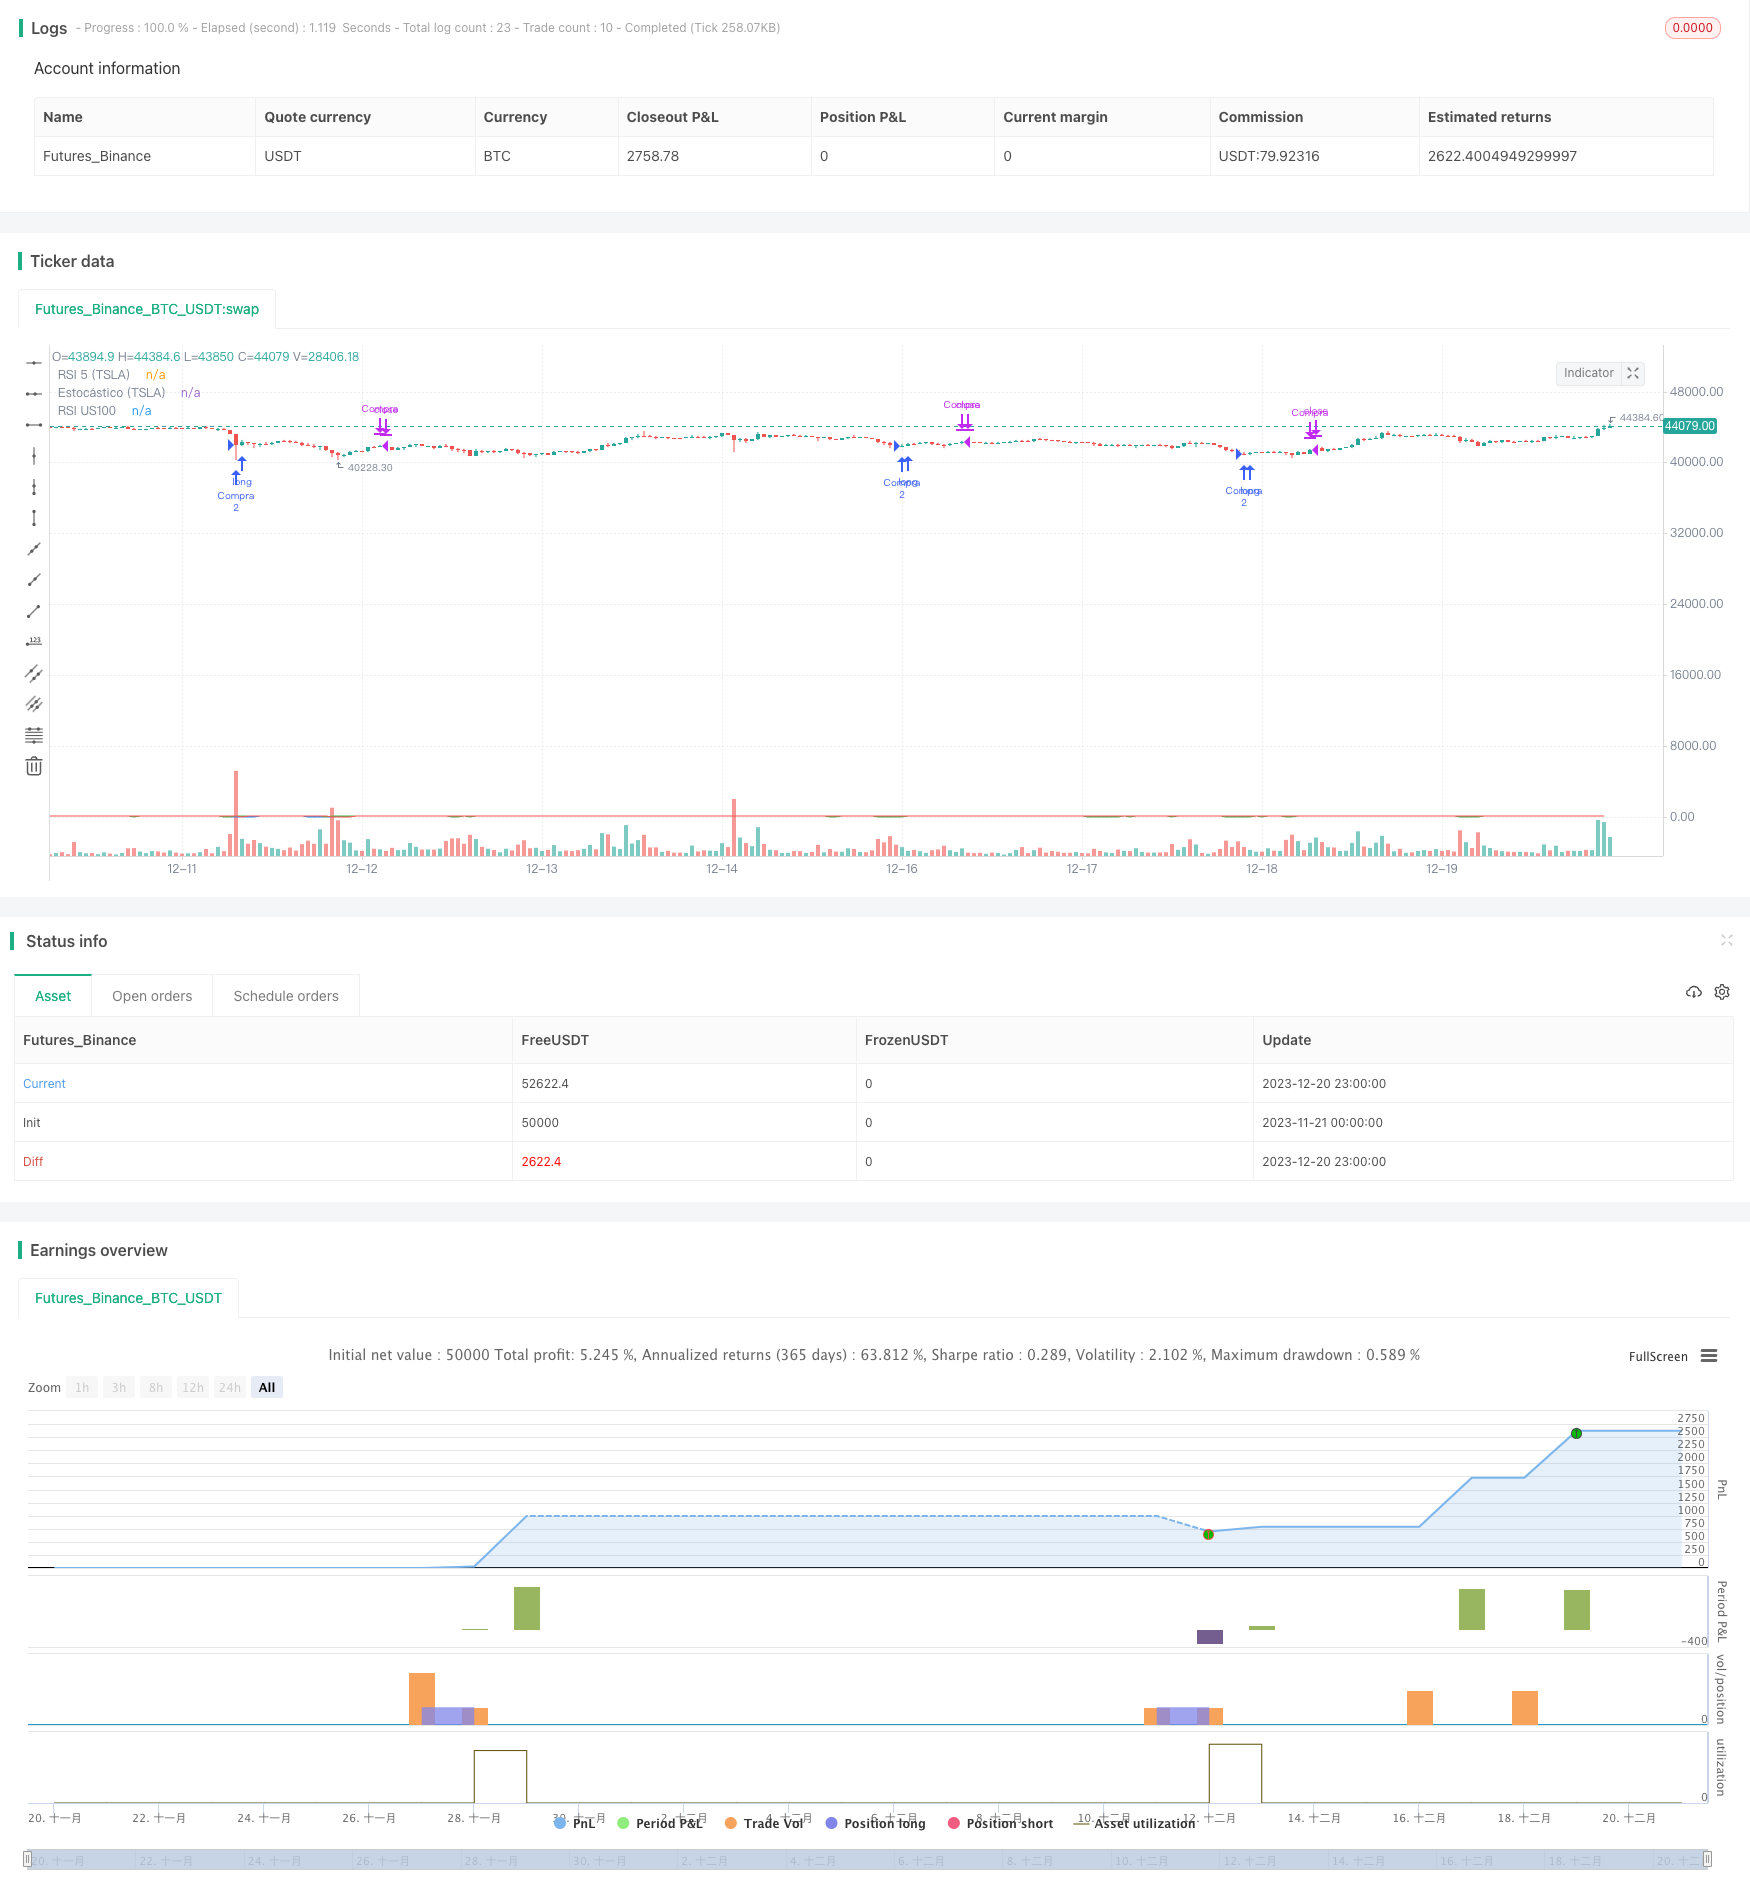
本策略综合利用RSI和Estocastic两种不同类型的技术指标,在TSLA 5分钟和标普100 1分钟的双时间框架下设计交易规则,实现自动化的TSLA股票交易系统。
该策略主要思想是同时监控TSLA自身的价格技术指标和美股大盘的技术指标,在二者同时达到超买超卖的状态时,发出交易信号。策略采用5分钟和1分钟两个时间周期指标进行组合,可以有效过滤掉部分噪音交易信号。
首先,策略在TSLA的5分钟K线上计算5日RSI指标,并在标普100指数的1分钟K线上计算14日RSI指标。当TSLA的5日RSI低于30、且标普100的14日RSI也低于30时,認为TSLA股价处于超卖状态,该时点发出买入信号。
买入后,策略继续监控TSLA 1分钟K线上的14日Estocastic指标。当Estocastic指标超过78时,認为TSLA股价向上反弹布林带,该时点发出卖出信号。
此外,策略还设置了3%的止损位次,当价格向下跌破止损位次时,也会主动止损离场。
- 多时间框架设计,可以有效过滤噪音信号
- RSI和Estocastic指标互相验证,提高信号质量
- 止损机制控制单笔损失
- 回测数据为TSLA和标普100的分钟数据,市场代表性强
- 策略逻辑简单清晰,容易理解与优化
- 多时间框架以及双指标组合会漏过部分机会
- 止损位置设置过于激进可能造成不必要的滑点损失
- 标普100作为交易信号的辅助工具,本身也会带来一定的系统性风险
- 回测数据质量과市场环境变化也会对结果产生影响
- 可以测试更多的参数组合寻找最佳指标配置
- 增加自适应止损算法
- 增加仓位管理模块,以锁定更多涨幅
- 增加机器学习算法训练指标权重
- 在更长的时间框架内寻找交易转折点
本策略总体上是一个典型的超买超卖反转策略,同时加入了多时间框架验证和止损模块使得策略更为稳健。该策略的优势在于简单易懂、容易实施。接下来的研究方向是如何在控制风险的同时获取更多alpha,这需要对指标和模型进行定制化优化。总的来说,本策略为构建量化交易系统奠定了坚实的基础。
||
This strategy utilizes two different types of technical indicators, RSI and Estocastic, across the 5-minute chart of TSLA and 1-minute chart of S&P 100 index to design trading rules and build an automated trading system for TSLA stocks.
The core idea of this strategy is to monitor both the price technical indicators of TSLA itself and the technical indicators of the US stock market index. It sends out trading signals when both sides reach the extremely overbought or oversold status at the same time. The strategy adopts technical indicators across two timeframes, the 5-minute and 1-minute, which can help filter out some noisy trading signals effectively.
Firstly, the strategy calculates the 5-day RSI on the 5-minute chart of TSLA, and the 14-day RSI on the 1-minute chart of the S&P 100 index. When the 5-day RSI of TSLA is below 30 and the 14-day RSI of the S&P 100 index is below 30 at the same time, it is considered that TSLA price reaches an extremely oversold level and a buy signal is triggered.
After buying in, the strategy keeps monitoring the 14-day Estocastic indicator on the 1-minute chart of TSLA. When the Estocastic indicator surpasses 78, it is viewed as TSLA price bounces back to the upper band and a sell signal is triggered.
In addition, a 3% stop loss is set in the strategy. When the price drops below the stop loss level, the position will be closed with a stop loss.
- Adopting multiple timeframes can help filter out noisy signals effectively
- RSI and Estocastic indicators verify each other and improve signal quality
- Stop loss mechanism limits the loss per trade
- Backtesting data includes the minute bars of TSLA and S&P 100 index which is representative
- The strategy logic is simple and easy to understand as well as optimize
- Combining multiple timeframes and indicators may miss some opportunities
- Overly aggressive stop loss setting may lead to unnecessary slippage loss
- S&P 100 index as a auxiliary tool also introduces some systemic risk
- The quality of backtesting data and changing market environments may influence the results
- Test more parameter combinations to find the optimal indicator configuration
- Add adaptive stop loss algorithms
- Add position sizing module to lock in more profits
- Add machine learning algorithms to train indicator weights
- Search for trading turns in longer timeframes
To conclude, this is a typical mean-reversion strategy based on overbought and oversold signals, with additional features like multiple timeframe validation and stop loss to make it more robust. The advantage lies in its simplicity to understand and implement. The next step is to acquire more alpha while controlling risks, which requires custom optimization work around the indicators and models. Overall, this strategy establishes a solid foundation for building quantitative trading systems.
[/trans]
Source (PineScript)
/*backtest
start: 2023-11-21 00:00:00
end: 2023-12-21 00:00:00
period: 1h
basePeriod: 15m
exchanges: [{"eid":"Futures_Binance","currency":"BTC_USDT"}]
*/

//@version=5
strategy("Estrategia de Trading TSLA", overlay=true)

// Condiciones de entrada
rsi5 = ta.rsi(close, 5) // RSI en el gráfico de TSLA de 5 minutos
rsiUS100 = ta.rsi(request.security(syminfo.tickerid, "1", close), 14) // RSI en el gráfico de US100 de 1 minuto

// Condiciones de entrada
condicion_entrada = rsi5 < 30 and rsiUS100 < 30

// Cantidad de acciones a comprar
cantidad_compra = 2

// Condiciones de salida
estocastico = ta.stoch(close, high, low, 14) // Estocástico en el gráfico de TSLA de 1 minuto
condicion_salida = estocastico > 78

// Stop loss
stop_loss = strategy.position_avg_price * 0.03

// Ejecutar la estrategia
if condicion_entrada
    strategy.entry("Compra", strategy.long, qty = cantidad_compra)

if condicion_salida or ta.highest(high, 10) <= stop_loss
    strategy.close("Compra")

// Mostrar indicadores en el gráfico
plot(rsi5, "RSI 5 (TSLA)", color=color.blue)
plot(rsiUS100, "RSI US100", color=color.red)
plot(estocastico, "Estocástico (TSLA)", color=color.green)
Detail
https://www.fmz.com/strategy/436222
Last Modified
2023-12-22 12:50:55