Name
宽带突破策略Bollinger-Band-Breakout-Strategy
Author
ChaoZhang
Strategy Description
[trans]
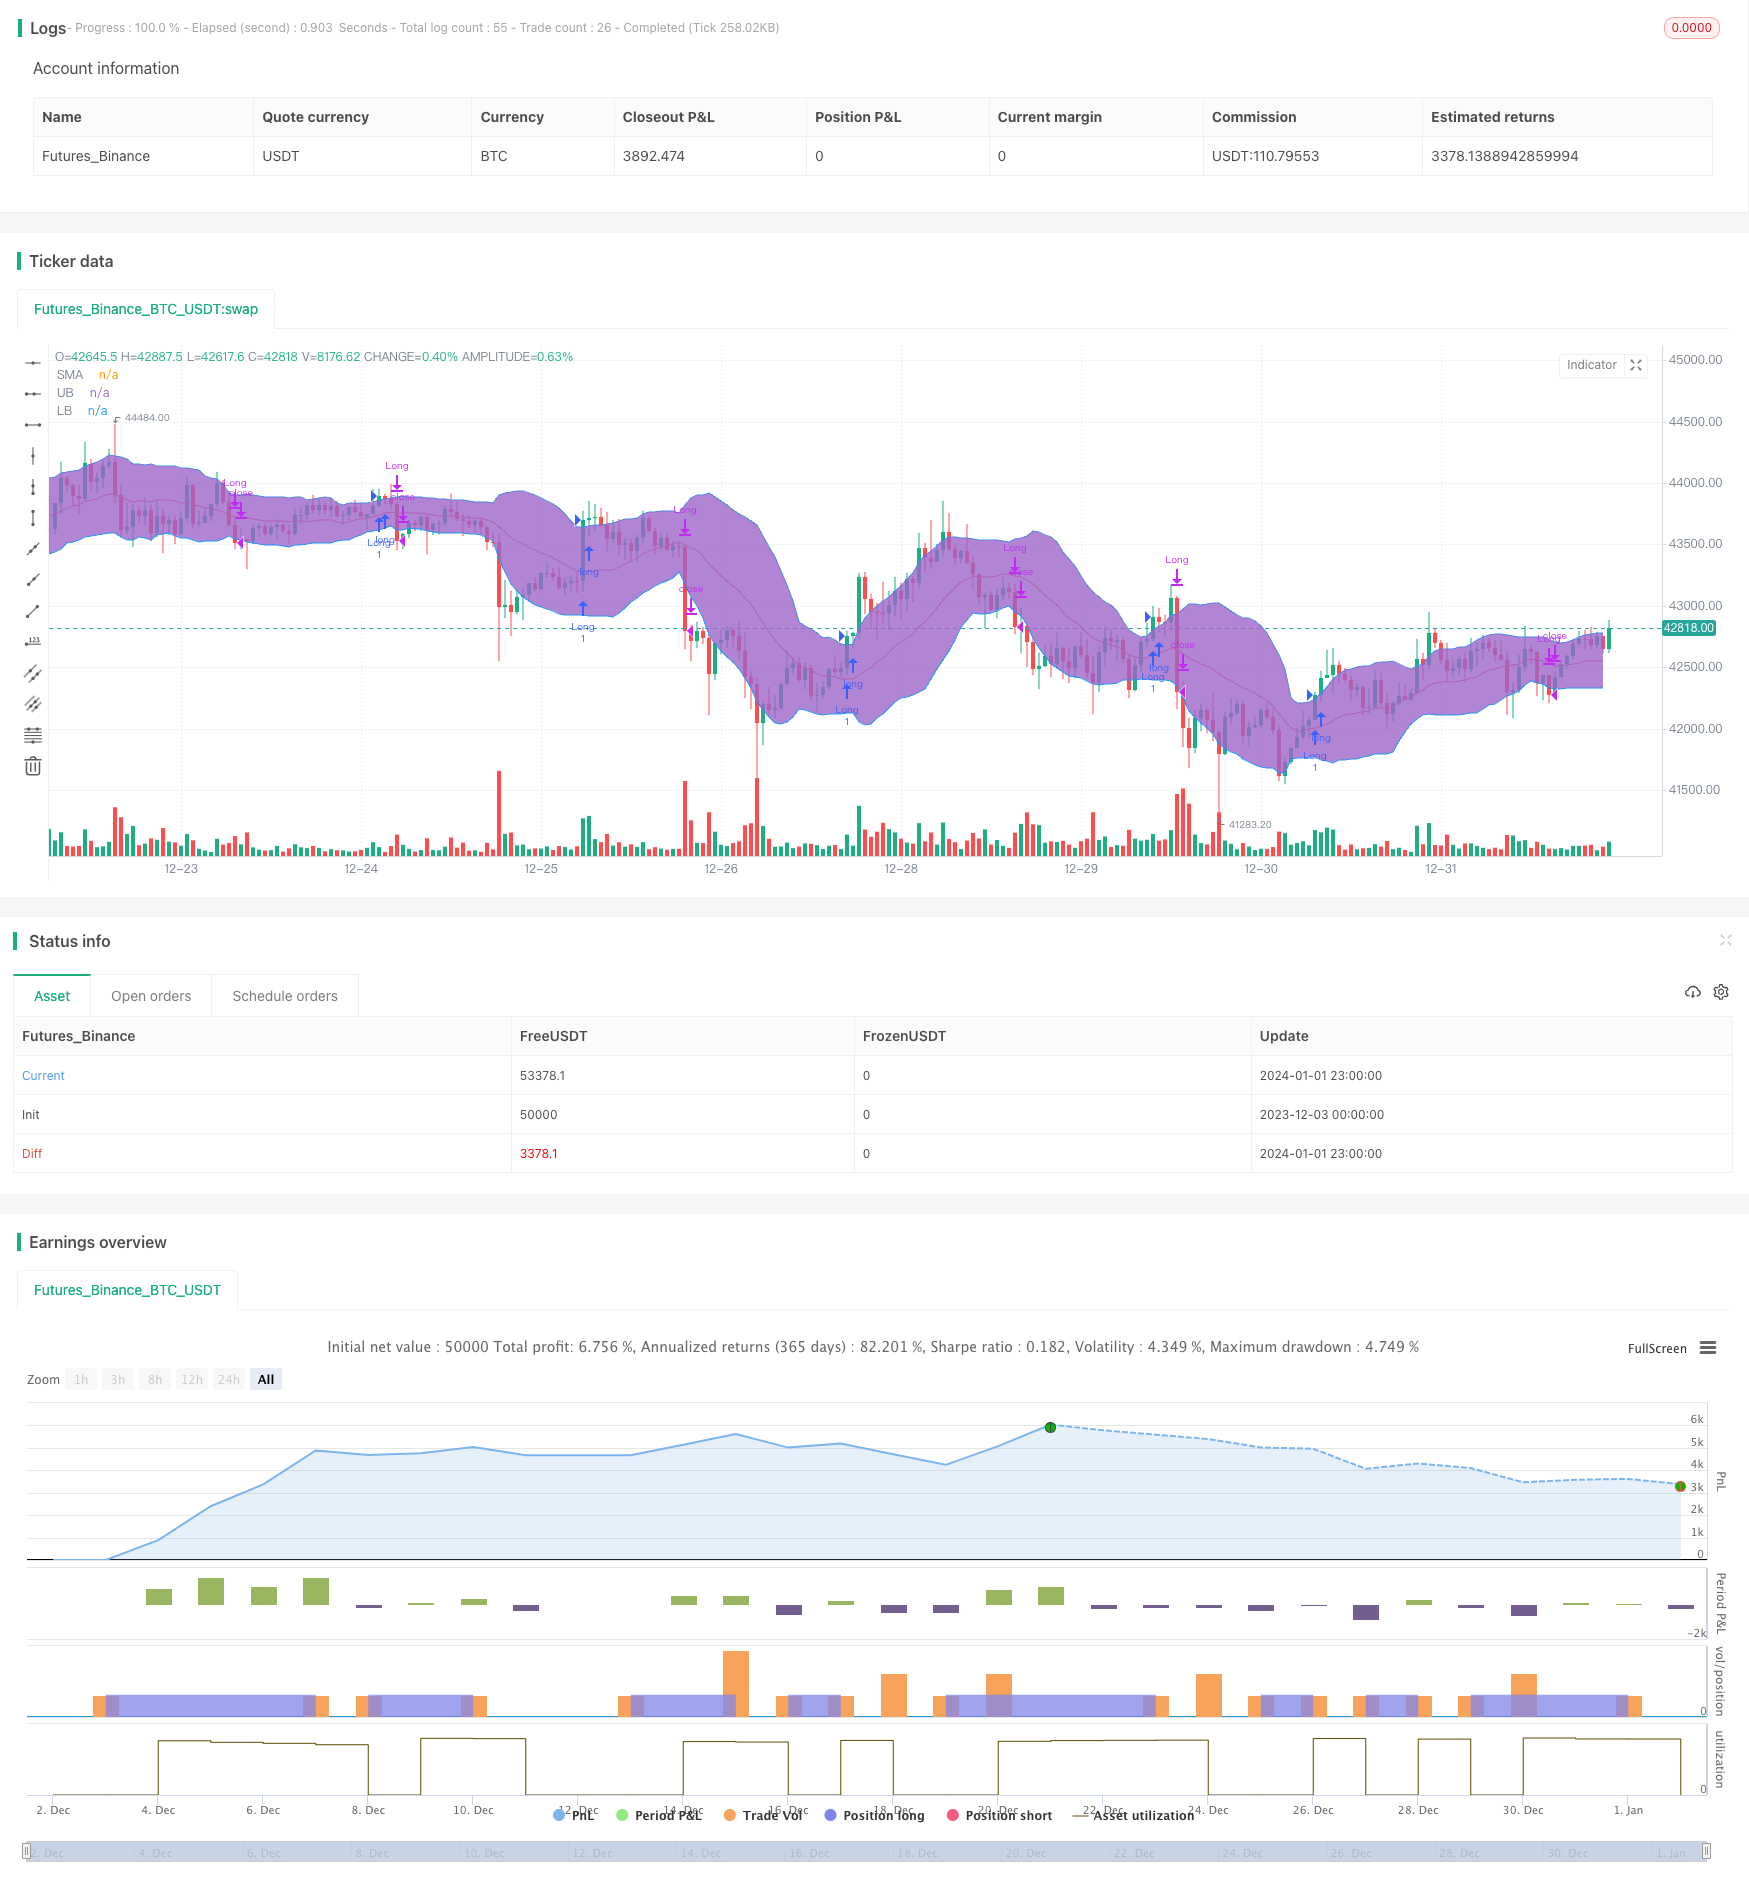
宽带突破策略是一种趋势跟踪策略。它利用波动率范围来确定进场和出场的时机。具体来说,它使用布林带的上轨和下轨来判断价格是否突破。当价格突破上轨时做多,当价格跌破下轨时平仓。
该策略基于布林带指标。布林带包含三条线:
- 中线 - n日简单移动平均线
- 上轨 - 中线 + k * n日标准差
- 下轨 - 中线 - k * n日标准差
这里的k值一般取1.5或2。当价格突破上轨时,表示股票进入强势区域,做多;当价格跌破下轨时,表示股票进入弱势区域,平仓。
该策略使用20日中线和1.5倍标准差构建布林带。当价格突破上轨时做多, exited有两种选择:
- 使用下轨止损
- 使用中线止损
如果是高波动股票,使用下轨止损效果更好。
该策略主要有以下优势:
- 能够有效跟踪价格趋势,及时捕捉突破信号
- 利用波动率范围来确定进场点位,可以有效过滤噪音
- prebuiltr两种止损方式,可以根据股票特点选择最优方案
该策略也存在一些风险:
- 突破信号可能是假突破,无法有效跟踪趋势
- 止损点设置不当可能造成过度止损
- 无法有效处理盘整市场
可以通过优化参数、结合其它指标等方式来降低这些风险。
该策略可以从以下几个方面进行优化:
- 优化布林带的参数,寻找最佳的参数组合
- 结合交易量等指标来验证突破信号的可靠性
- 利用其它指标构建过滤机制,避免假突破
- 动态调整止损位置,降低止损风险
宽带突破策略整体来说是一种较为经典的趋势跟踪策略。它可以通过参数优化和规则优化进行改进,使其更适应不同市场环境。该策略易于理解和实现,是量化交易的一个很好的入门策略选择。
||
The Bollinger Band breakout strategy is a trend following strategy. It uses volatility ranges to determine entry and exit points. Specifically, it uses the upper and lower bands of Bollinger Bands to judge if prices are breaking out. It goes long when prices break above the upper band and closes positions when prices break below the lower band.
The strategy is based on the Bollinger Bands indicator. Bollinger Bands contain three lines:
- Middle Line - n-period simple moving average
- Upper Band - Middle Line + k * n-period standard deviation
- Lower Band - Middle Line - k * n-period standard deviation.
Here k is usually set at 1.5 or 2. When prices break above the upper band, it indicates the stock is entering a strong zone and thus goes long. When prices break below the lower band, it indicates the stock is entering a weak zone and thus closes positions.
This strategy uses a 20-period middle line and 1.5 standard deviations to construct the Bollinger Bands. It goes long when prices break above the upper band. There are two options for exits:
- Use the lower band as a stop loss
- Use the middle line as a stop loss
Option 1 works better for highly volatile stocks.
The main advantages of this strategy are:
- Can effectively track price trends and timely capture breakout signals
- Uses volatility ranges to determine entry points, which effectively filters out noise
- Provides two stop loss options that can be selected based on stock characteristics
This strategy also has some risks:
- Breakout signals may be false breakouts and fail to effectively track trends
- Improper stop loss positioning could lead to over-stopping out
- Cannot effectively handle range-bound markets
These risks can be reduced through parameter optimization, incorporating other indicators, etc.
This strategy can be optimized in several aspects:
- Optimize Bollinger Bands parameters to find best parameter combinations
- Incorporate trading volume and other indicators to verify breakout signal reliability
- Construct filters with other indicators to avoid false breakouts
- Dynamically adjust stop loss positions to lower stop loss risks
The Bollinger Band breakout strategy is overall a rather classical trend following strategy. It can be improved through parameter and rules optimization to better suit different market environments. The strategy is easy to understand and implement, making it a great starting point strategy choice for quantitative trading.
[/trans]
Strategy Arguments
| Argument | Default | Description |
|---|---|---|
| v_input_1 | 20 | Period |
| v_input_2 | 1.5 | Standard Deviation |
| v_input_3 | true | Exit Option |
Source (PineScript)
/*backtest
start: 2023-12-03 00:00:00
end: 2024-01-02 00:00:00
period: 1h
basePeriod: 15m
exchanges: [{"eid":"Futures_Binance","currency":"BTC_USDT"}]
*/

// This source code is subject to the terms of the Mozilla Public License 2.0 at https://mozilla.org/MPL/2.0/
// © Senthaamizh

//@version=4
strategy(title="Bollinger Band Breakout", shorttitle = "BB-BO", overlay=true)
source = close
length = input(20, minval=1, title = "Period") //Length of the Bollinger Band
mult = input(1.5, minval=0.001, maxval=50, title = "Standard Deviation") // Use 1.5 SD for 20 period MA; Use 2 SD for 10 period MA
exit = input(1, minval=1, maxval=2,title = "Exit Option") // Use Option 1 to exit using lower band; Use Option 2 to exit using moving average

basis = sma(source, length)
dev = mult * stdev(source, length)

upper = basis + dev
lower = basis - dev

if (crossover(source, upper))
    strategy.entry("Long", strategy.long, qty=1)

if(exit==1)
    if (crossunder(source, lower))
        strategy.close("Long")

if(exit==2) //basis is good for N50 but lower is good for BN (High volatility)
    if (crossunder(source, basis))
        strategy.close("Long")

plot(basis, color=color.red,title= "SMA")
p1 = plot(upper, color=color.blue,title= "UB")
p2 = plot(lower, color=color.blue,title= "LB")
fill(p1, p2)
Detail
https://www.fmz.com/strategy/437565
Last Modified
2024-01-03 17:53:32