Name
布林带突破交易策略Bollinger-Bands-Breakout-Trading-Strategy
Author
ChaoZhang
Strategy Description
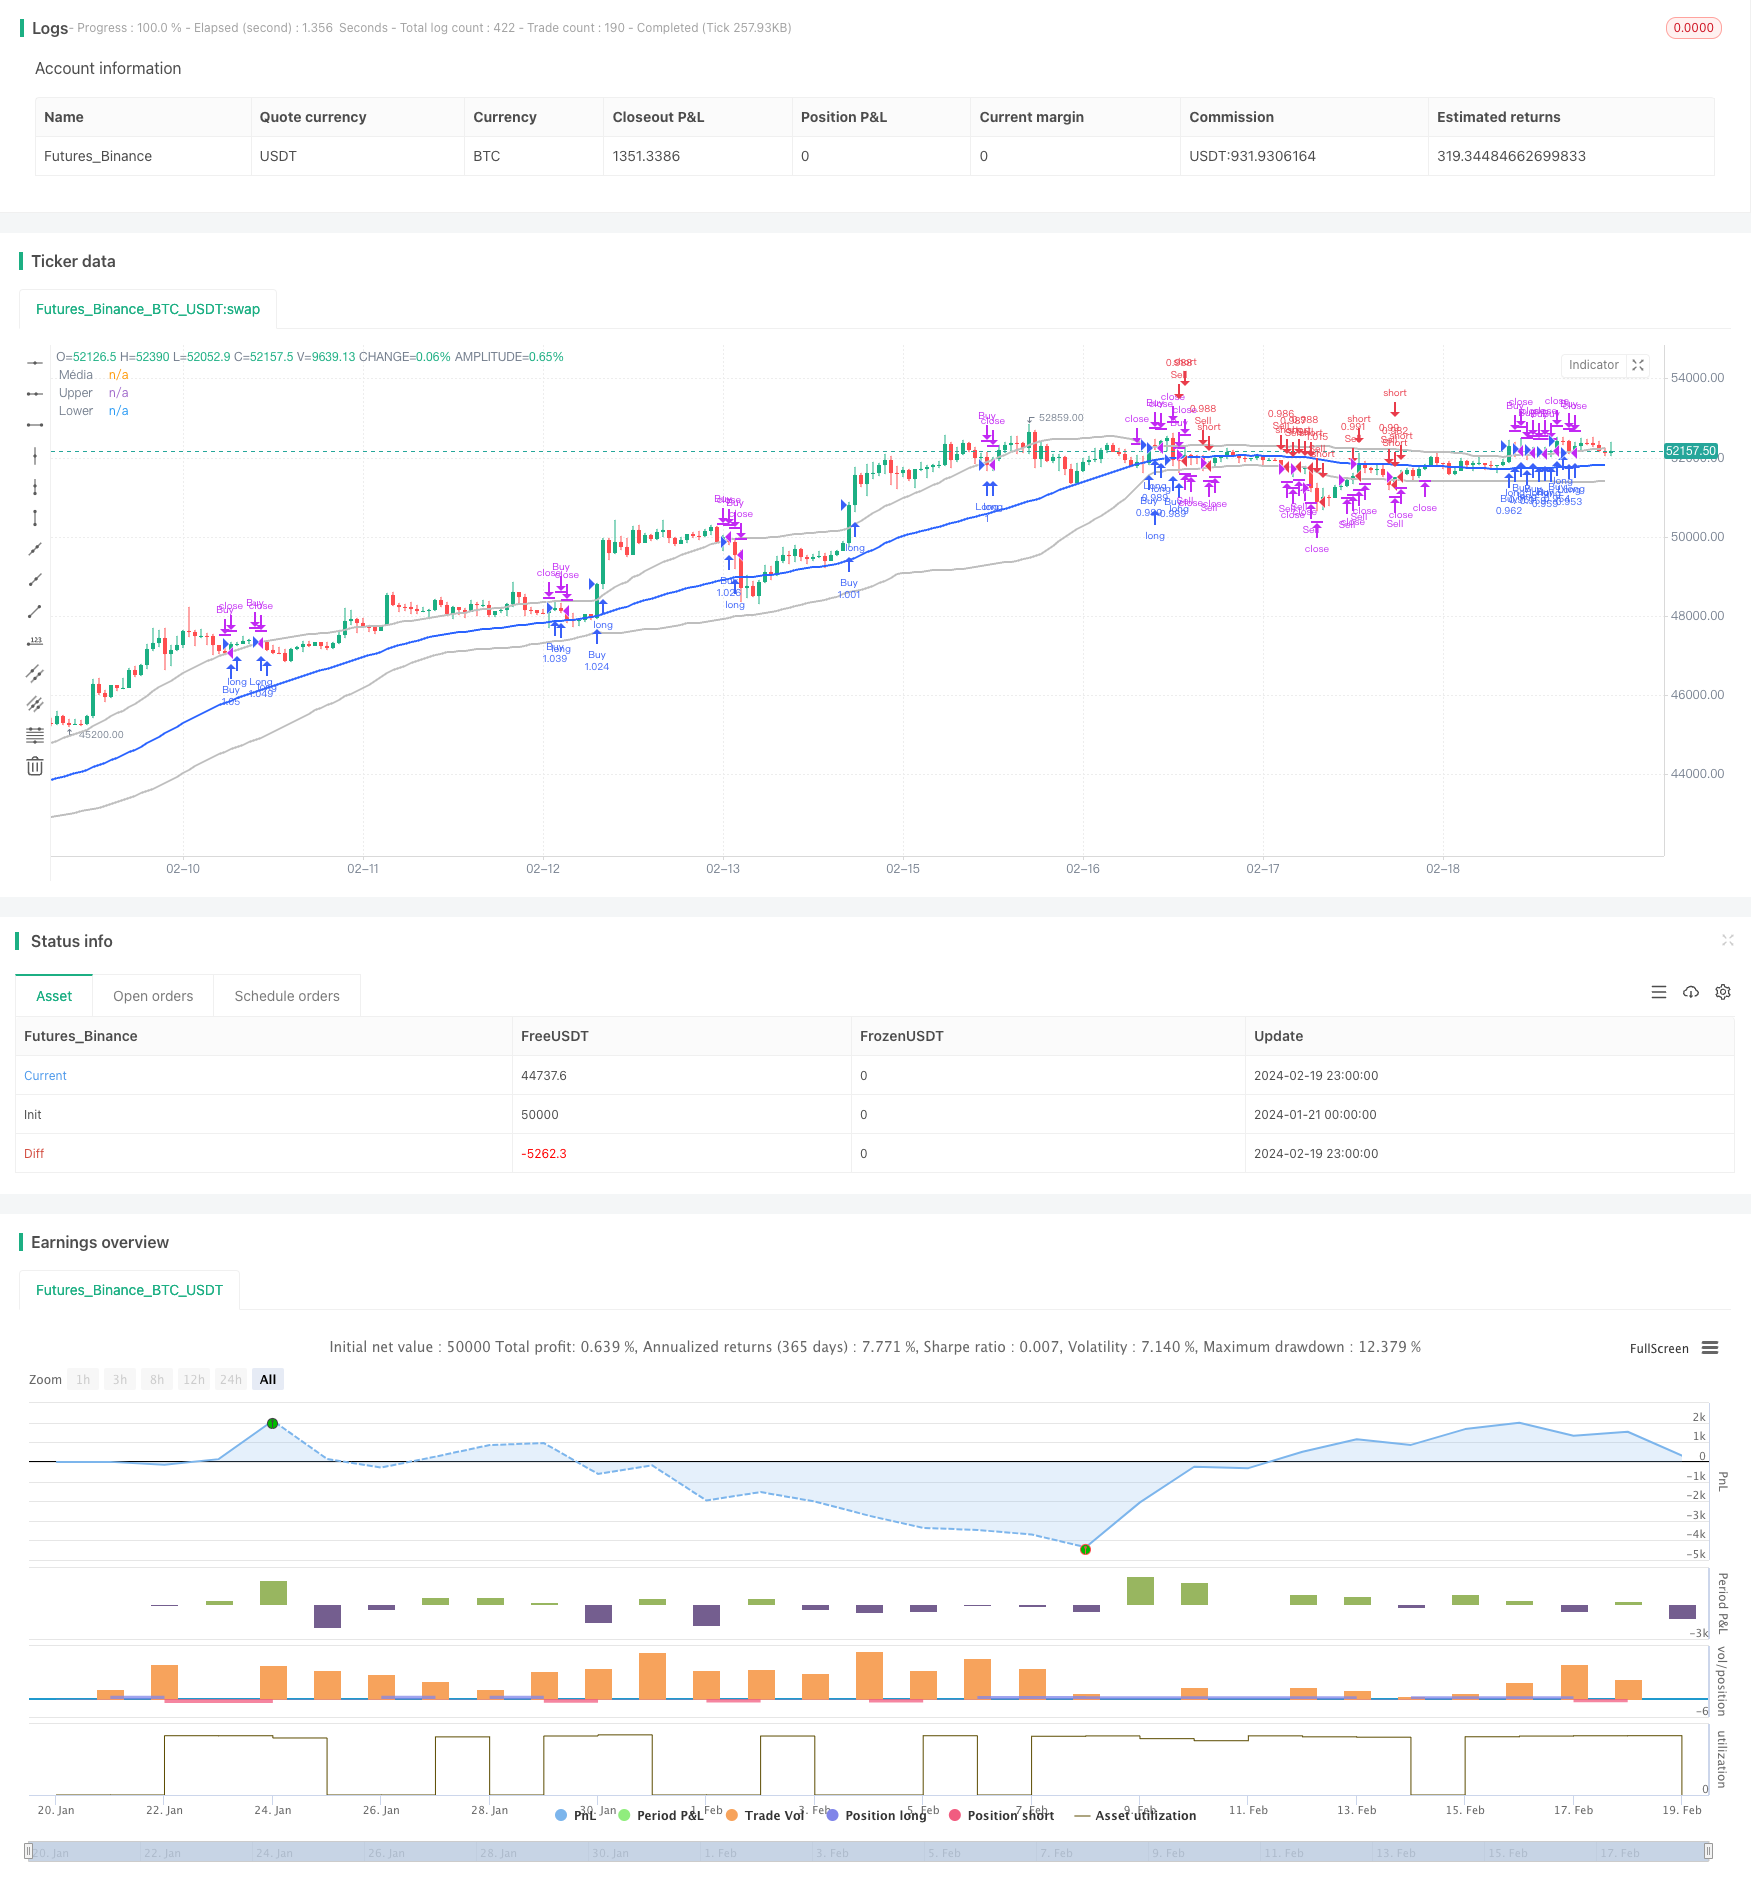
该策略基于布林带指标设计,当价格突破布林带上轨时做多,当价格突破布林带下轨时做空,属于趋势跟踪策略。
- 计算布林带的中轨、上轨和下轨
- 当收盘价突破上轨时,做多入场
- 当收盘价突破下轨时,做空入场
- 平仓条件:突破中轨时平掉多单,突破中轨时平掉空单
该策略通过布林带判断市场的波动区间和趋势方向,当价格突破布林带上下轨时,认为是一个趋势反转的信号,根据这个信号入场做多做空。中轨附近作为止损位置,突破中轨时退出仓位。
- 使用布林带指标判断市场趋势和支持阻力位
- 突破布林带上下轨时机会较高
- 有清晰的入场和出场规则
- 布林带突破假信号的风险,可能是短期的价格震荡
- 大幅度行情时,止损可能较大
风险解决方法:
- 结合其他指标判断趋势
- 调整参数,扩大布林带范围
- 结合趋势指标,避免不必要的反转操作
- 动态调整布林带参数,优化参数大小
该策略通过布林带指标判断价格趋势和支撑阻力位,在布林带上下轨突破点入场,止损点为布林带中轨。策略逻辑简单清晰,容易实现。可以通过调整参数或与其他指标组合来优化,在趋势行情中效果较好。
||
This strategy is designed based on the Bollinger Bands indicator. It goes long when the price breaks through the upper band and goes short when the price breaks through the lower band. It belongs to the trend following strategy.
- Calculate the middle band, upper band and lower band of Bollinger Bands
- When the closing price breaks through the upper band, go long
- When the closing price breaks through the lower band, go short
- Exit rule: close long position when price breaks through middle band, close short position when price breaks through middle band
This strategy uses Bollinger Bands to determine the fluctuation range and trend direction of the market. When the price breaks through the upper or lower bands of Bollinger Bands, it is considered as a trend reversal signal for entry. The area around the middle band is used as the stop loss position. Exit positions when the price breaks through the middle band.
- Use Bollinger Bands indicator to determine market trend and support/resistance levels
- High probability when breakout of Bollinger Bands
- Clear entry and exit rules
- Risk of false breakout signals from Bollinger Bands, which could be short-term price fluctuations
- Larger stop loss when huge price swings
Solutions:
- Combine with other indicators to confirm the trend
- Adjust parameters to expand Bollinger Bands range
- Combine with trend indicators to avoid unnecessary reverse trading
- Dynamically adjust Bollinger Bands parameters to optimize parameter size
This strategy uses the Bollinger Bands indicator to determine price trend and support/resistance levels. It enters at Bollinger Bands breakout points and sets stop loss at the middle band. The strategy logic is simple and clear, easy to implement. It can be optimized by adjusting parameters or combining with other indicators, works well in trending markets.
[/trans]
Strategy Arguments
| Argument | Default | Description |
|---|---|---|
| v_input_int_1 | true | From Month |
| v_input_int_2 | true | From Day |
| v_input_int_3 | 1972 | From Year |
| v_input_int_4 | true | To Month |
| v_input_int_5 | true | To Day |
| v_input_int_6 | 9999 | To Year |
| v_input_int_7 | 51 | Comprimento |
| v_input_float_1 | 1.1 | Multiplicador |
Source (PineScript)
/*backtest
start: 2024-01-21 00:00:00
end: 2024-02-20 00:00:00
period: 1h
basePeriod: 15m
exchanges: [{"eid":"Futures_Binance","currency":"BTC_USDT"}]
*/

//@version=5
strategy("FFFDBTC", overlay=true,initial_capital = 100,commission_type =strategy.commission.percent,commission_value= 0.15,default_qty_value = 100,default_qty_type = strategy.percent_of_equity)
// === INPUT BACKTEST RANGE ===
FromMonth = input.int(defval=1, title="From Month", minval=1, maxval=12)
FromDay = input.int(defval=1, title="From Day", minval=1, maxval=31)
FromYear = input.int(defval=1972, title="From Year", minval=1972)
ToMonth = input.int(defval=1, title="To Month", minval=1, maxval=12)
ToDay = input.int(defval=1, title="To Day", minval=1, maxval=31)
ToYear = input.int(defval=9999, title="To Year", minval=2010)

// === FUNCTION EXAMPLE ===
start = timestamp(FromYear, FromMonth, FromDay, 00, 00)  // backtest start window
finish = timestamp(ToYear, ToMonth, ToDay, 23, 59)  // backtest finish window
window() => true
// Definindo tamanho da posição
position_size = strategy.equity
// Definir parâmetros das Bandas de Bollinger
length = input.int(51, "Comprimento")
mult = input.float(1.1, "Multiplicador")

// Calcular as Bandas de Bollinger
basis = ta.sma(close, length)
dev = mult * ta.stdev(close, length)
upper = basis + dev
lower = basis - dev
// Definir condições de entrada e saída
entrada_na_venda = low < lower
saida_da_venda = high > lower and strategy.position_size < 0
entrada_na_compra = high > upper
saida_da_compra = low < upper and strategy.position_size > 0
shortCondition = close[1] < lower[1] and close > lower and close < basis
longCondition = close[1] > upper[1] and close < upper and close > basis

// Entrar na posição longa se a condição longCondition for verdadeira
if ((entrada_na_compra) and window() )
    strategy.entry("Buy", strategy.long)
//saida da compra
if (saida_da_compra)
    strategy.close("Buy")
//entrada na venda
if ((entrada_na_venda) and window() )
    strategy.entry("Sell", strategy.short)
//saida da venda
if (saida_da_venda)
    strategy.close("Sell")
if ((longCondition) and window())
    strategy.entry("Long", strategy.long)

// Entrar na posição curta se a condição shortCondition for verdadeira
if ((shortCondition) and window())
    strategy.entry("Short", strategy.short)

// Definir a saída da posição

strategy.exit("Exit_Long", "Long", stop=ta.sma(close, length), when = close >= basis)
strategy.exit("Exit_Short", "Short", stop=ta.sma(close, length), when = close <= basis)

// Desenhar as Bandas de Bollinger no gráfico
plot(basis, "Média", color=#2962FF, linewidth=2)
plot(upper, "Upper", color=#BEBEBE, linewidth=2)
plot(lower, "Lower", color=#BEBEBE, linewidth=2)
Detail
https://www.fmz.com/strategy/442342
Last Modified
2024-02-21 11:35:14