Name
惯性指标交易策略Inertia-Indicator-Trading-Strategy
Author
ChaoZhang
Strategy Description
[trans]
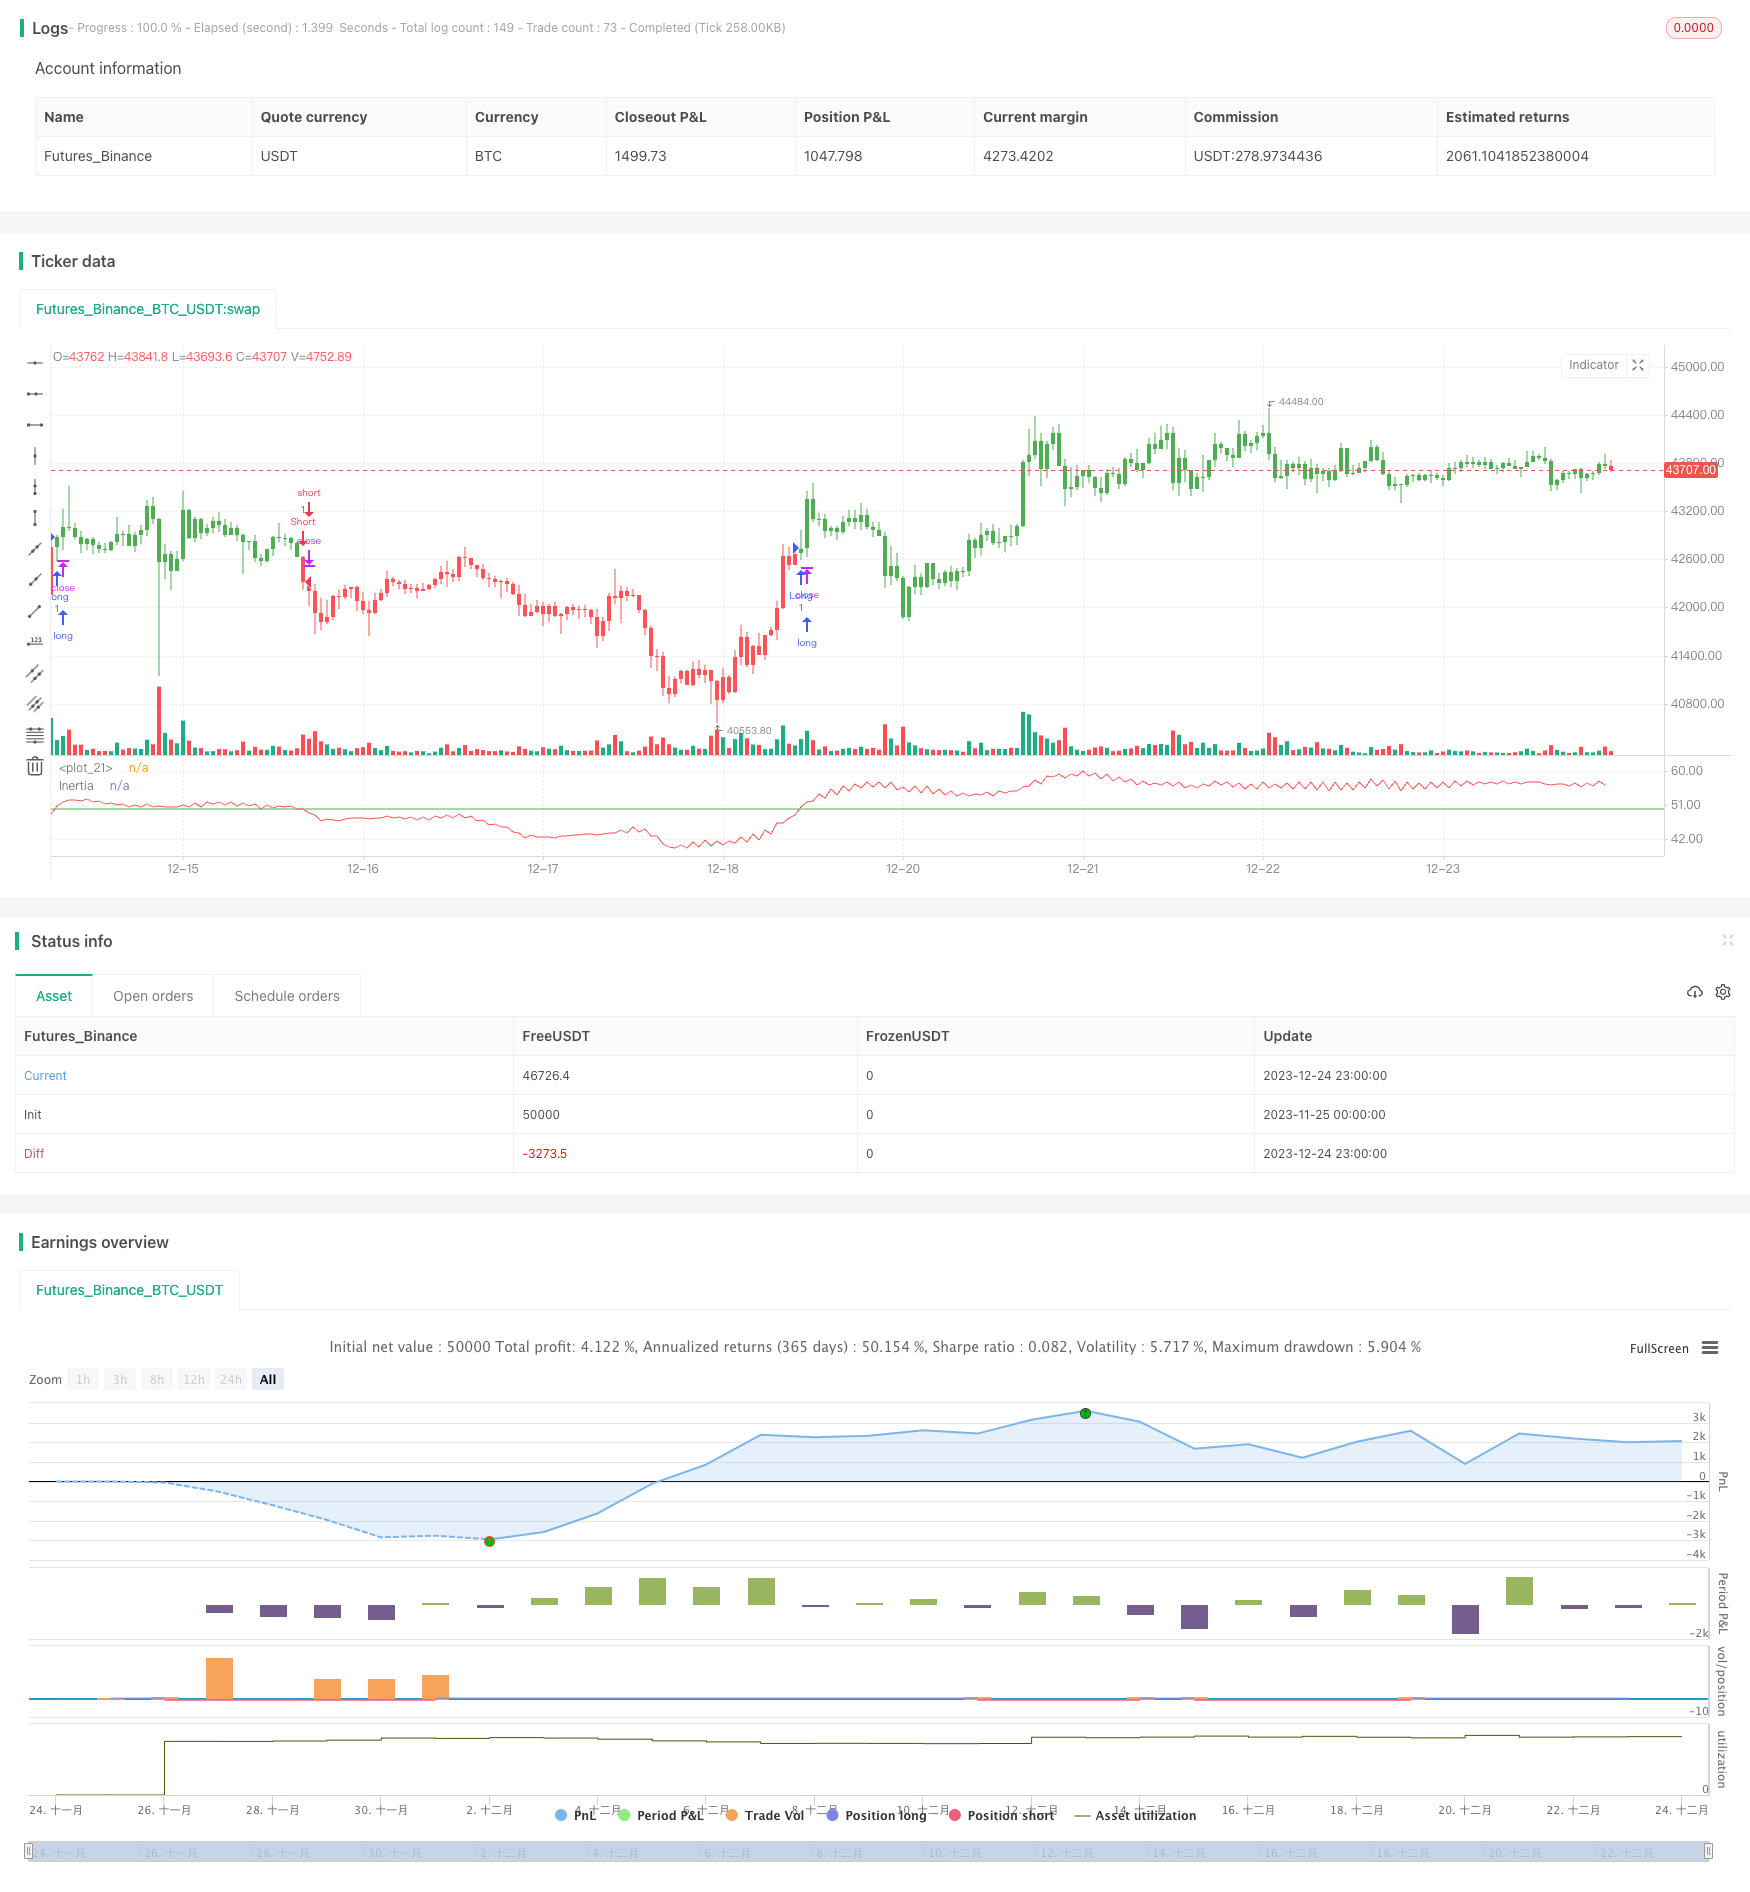
惯性指标交易策略是基于相对波动指数(RVI)的趋势跟踪型算法交易策略。该策略通过计算证券的RVI,来测量市场、股票或货币对的动量和趋势。它可以判断长期趋势的方向,作为建立trading position的信号。
该策略的核心指标是惯性指标(Inertia Indicator),它取值范围在0到100之间。指标大于50代表正向惯性,小于50代表负向惯性。只要惯性值持续大于50,就可以判断长期趋势向上;反之,则为下降趋势。
指标的计算过程如下:
- 计算指定周期内的股票收盘价标准差StdDev
- 根据今日收盘价与昨日收盘价的比较,计算向上波动u和向下波动d
- 计算并平滑u和d,得到指标nU和nD
- 计算相对波动指数nRVI = 100 * nU / (nU + nD)
- 对nRVI进行指数移动平均,得到最终的惯性值nRes
如果nRes大于50代表正向惯性,会产生买入信号;如果小于50代表负向惯性,会产生卖出信号。
该策略最大的优势在于能够顺势而为,捕捉市场趋势,避免在震荡行情中频繁开仓。另外,相对简单的指标计算,对计算资源要求不高,适合算法交易。
该策略最大的风险在于,指标本身存在滞后,无法做到百分百捕捉转折点。这可能导致错过较优开仓时机。另外,指标的参数设置也会影响策略表现,需要经过大量回测找到最优参数。
为降低风险,可以考虑与其他技术指标或基本面指标结合使用,利用更多因素来决定开仓。同时要控制单笔交易的头寸规模。
该策略可以从以下几个方面进行优化:
-
参数优化。改变周期参数和平滑参数的设置,找到最优参数组合。
-
结合其他指标。与移动平均线、RSI等指标结合使用,利用更多因素决策。
-
动态仓位管理。根据市场状况和指标数值,动态调整每个交易的头寸规模。
-
自动止损策略。设定止损位置,能够有效控制单笔交易的最大损失。
惯性指标交易策略整体来说是一种较为简单可靠的趋势跟踪策略。它根据惯性指标判断价格趋势方向,并顺势建立trading position。通过参数优化、指标组合等方式进一步增强策略效果,是一种适合量化交易的算法策略。
||
The inertia indicator trading strategy is a trend-following algorithmic trading strategy based on the Relative Volatility Index (RVI). It measures market, stock or currency pair momentum and trend by calculating the RVI of securities. It can determine the direction of long-term trends and generate trading signals.
The core indicator of this strategy is the Inertia Indicator. Its value ranges from 0 to 100. A reading above 50 represents positive inertia, while a reading below 50 represents negative inertia. As long as the inertia value stays above 50, it indicates an upward trend. And vice versa.
The calculation process is as follows:
- Calculate the standard deviation StdDev of closing prices for a given period
- Calculate the upward volatility u and downward volatility d based on the comparison between today's and yesterday's closing prices
- Smooth u and d to get indicators nU and nD
- Calculate Relative Volatility Index nRVI = 100 * nU / (nU + nD)
- Exponentially smooth nRVI to get the final inertia value nRes
If nRes is greater than 50, it generates a buy signal. If less than 50, it generates a sell signal.
The biggest advantage of this strategy is that it can follow trends and avoid frequent opening during market consolidation. In addition, the simple indicator calculation requires less computing resources, making it suitable for algorithmic trading.
The biggest risk is that the indicator itself has a lag and cannot capture turning points 100%. This may result in missing better opening opportunities. In addition, the parameter settings of the indicator also affect strategy performance and need a lot of backtesting to find the optimal parameters.
To reduce risks, consider combining with other technical or fundamental indicators to determine opening using more factors. At the same time, control the position sizing of each trade.
The strategy can be optimized in the following aspects:
-
Parameter optimization. Change the settings of cycle parameters and smoothing parameters to find the optimal parameter combination.
-
Combine with other indicators. Use with moving averages, RSI and other indicators for more informed decisions.
-
Dynamic position sizing. Dynamically adjust the position size of each trade based on market conditions and indicator values.
-
Automatic stop loss. Set stop loss positions to effectively control the maximum loss per trade.
The inertia indicator trading strategy is a relatively simple and reliable trend following strategy. It determines the price trend direction based on the inertia indicator and follows the trend to establish trading positions. By further enhancing strategy performance through parameter optimization, indicator combinations, it is an algorithmic strategy suitable for quantitative trading.
[/trans]
Strategy Arguments
| Argument | Default | Description |
|---|---|---|
| v_input_1 | 10 | Period |
| v_input_2 | 14 | Smooth |
| v_input_3 | false | Trade reverse |
Source (PineScript)
/*backtest
start: 2023-11-25 00:00:00
end: 2023-12-25 00:00:00
period: 1h
basePeriod: 15m
exchanges: [{"eid":"Futures_Binance","currency":"BTC_USDT"}]
*/

//@version=2
////////////////////////////////////////////////////////////
//  Copyright by HPotter v1.0 23/05/2017
// The inertia indicator measures the market, stock or currency pair momentum and
// trend by measuring the security smoothed RVI (Relative Volatility Index).
// The RVI is a technical indicator that estimates the general direction of the
// volatility of an asset.
// The inertia indicator returns a value that is comprised between 0 and 100.
// Positive inertia occurs when the indicator value is higher than 50. As long as
// the inertia value is above 50, the long-term trend of the security is up. The inertia
// is negative when its value is lower than 50, in this case the long-term trend is
// down and should stay down if the inertia stays below 50.
//
// You can change long to short in the Input Settings
// Please, use it only for learning or paper trading. Do not for real trading.
////////////////////////////////////////////////////////////
strategy(title="Inertia Indicator", shorttitle="Inertia")
Period = input(10, minval=1)
Smooth = input(14, minval=1)
reverse = input(false, title="Trade reverse")
hline(50, color=green, linestyle=line)
xPrice = close
StdDev = stdev(xPrice, Period)
d = iff(close > close[1], 0, StdDev)
u = iff(close > close[1], StdDev, 0)
nU = (13 * nz(nU[1],0) + u) / 14
nD = (13 * nz(nD[1],0) + d) / 14
nRVI = 100 * nU / (nU + nD)
nRes = ema(nRVI, Smooth)
pos = iff(nRes > 50, 1,
	     iff(nRes < 50, -1, nz(pos[1], 0)))
possig = iff(reverse and pos == 1, -1,
          iff(reverse and pos == -1, 1, pos))
if (possig == 1)
    strategy.entry("Long", strategy.long)
if (possig == -1)
    strategy.entry("Short", strategy.short)
barcolor(possig == -1 ? red: possig == 1 ? green : blue )
plot(nRes, color=red, title="Inertia")
Detail
https://www.fmz.com/strategy/436644
Last Modified
2023-12-26 15:42:33
