Name
慢速RSI超买超卖策略Slow-RSI-OB-OS-Strategy
Author
ChaoZhang
Strategy Description
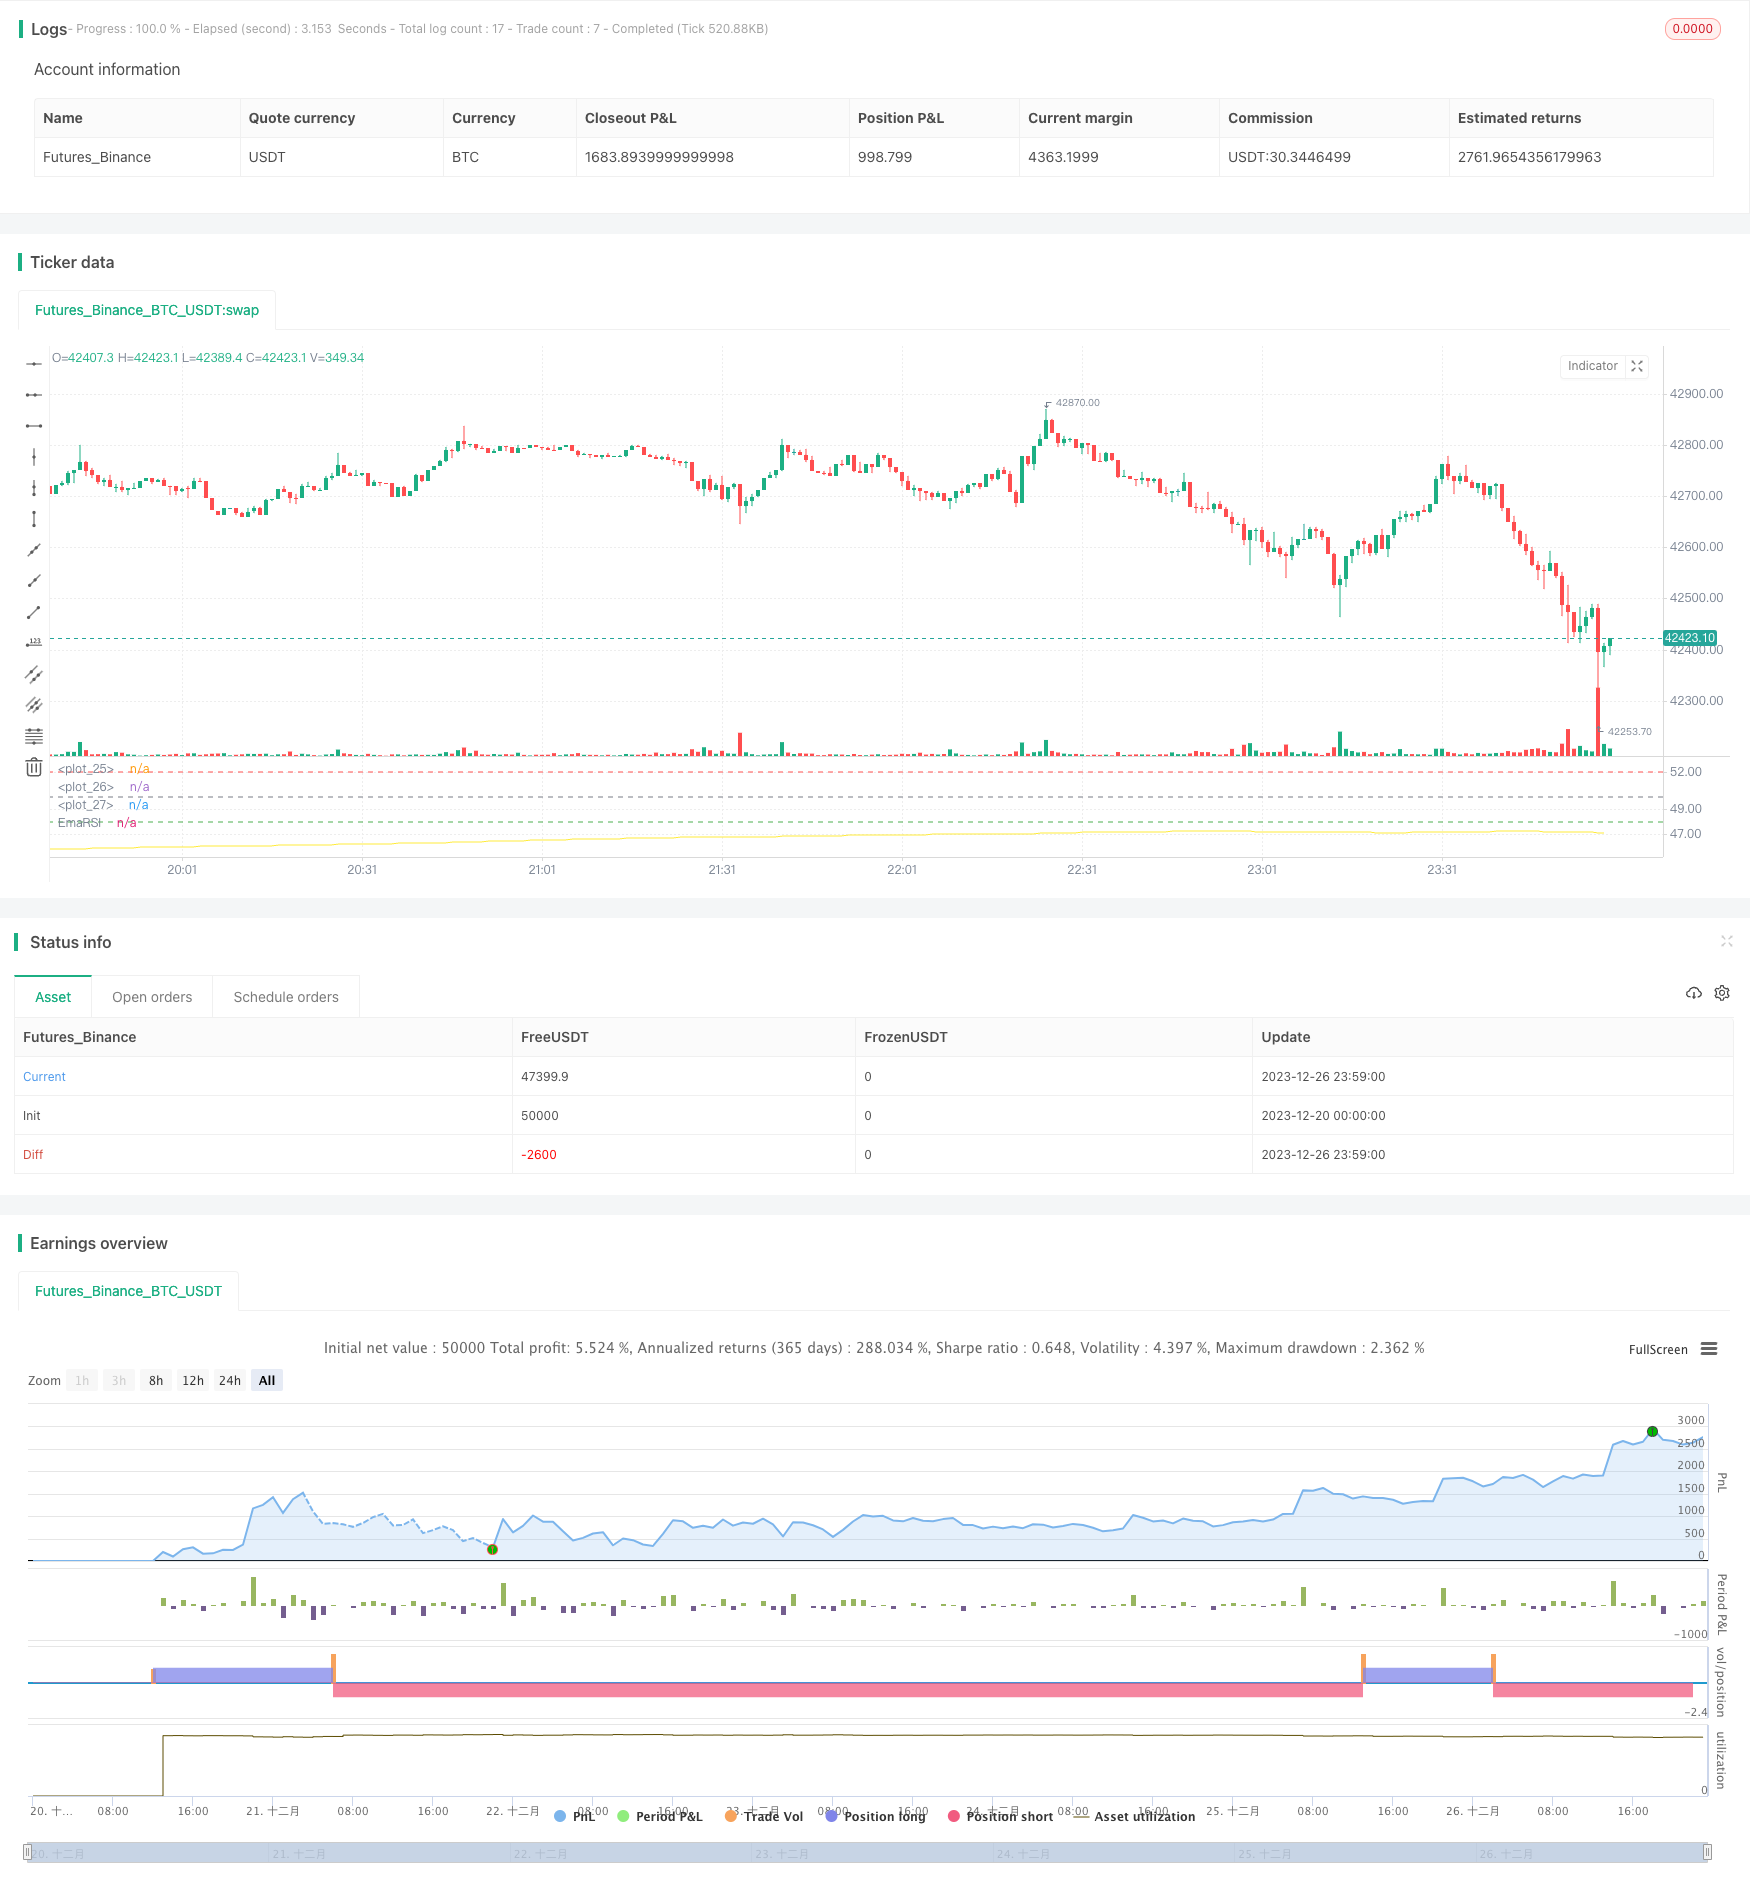
慢速RSI超买超卖策略通过延长RSI的回看周期,降低RSI曲线的波动性,从而开启全新的交易机会。该策略同样也适用于MACD等其他技术指标。
该策略的核心思路是延长RSI的回看周期长度,默认为500周期,然后再通过SMA平滑RSI曲线,默认周期为250。这样可以大幅降低RSI曲线的波动性,缓慢RSI的反应速度,从而产生新的交易机会。
过长的回看周期削弱了RSI曲线的波动性,因此判断超买超卖的标准也需要调整。策略设置了自定义的超买线52和超卖线48。当加权RSI从下方突破超卖线时产生做多信号;当从上方跌破超买线时产生做空信号。
- 创新性强,通过延长周期开辟新的交易思路
- 可大幅降低虚假信号,提高稳定性
- 可自定义超买超卖阈值,适应不同市场
- 可播种加仓,提高收益率
- 周期过长可能错过短线机会
- 需要耐心等待入场机会出现
- 超买超卖阈值设置不当可能增加损失
- 存在被套利的风险
解决方法:
- 适当缩短周期,增加交易频率
- 采用分批建仓的方式,分散风险
- 优化阈值参数,适应不同市场环境
- 设置止损点,避免巨额损失
- 优化RSI的参数,找到最佳周期组合
- 测试不同的SMA平滑周期参数
- 优化超买超卖的参数,拟合不同市场
- 添加止损策略,控制单笔损失
慢速RSI超买超卖策略通过延长周期和利用均线抑制波动的方式,成功开辟了新的交易思路。该策略在参数优化和风险控制到位的情况下,有望取得稳定而高效的超额收益。总体来说,该策略具有很强的创新性和运用价值。
||
The Slow RSI OB/OS strategy opens up new trading opportunities by extending the lookback period of RSI to reduce the fluctuation of the RSI curve. The strategy is also applicable to other technical indicators like MACD.
The core idea of this strategy is to extend the lookback period of RSI to 500 bars by default and then smooth the RSI curve with a 250-bar SMA. This can significantly reduce the fluctuation of RSI and slow down its reaction speed, thus generating new trading signals.
The prolonged lookback period weakens the fluctuation of RSI, so the criteria for overbought and oversold levels also need to be adjusted. The strategy sets customizable overbought line at 52 and oversold line at 48. A long signal is triggered when the smoothed RSI crosses above the oversold line from below. A short signal is triggered when it crosses below the overbought line from above.
- Highly innovative by exploring new trading ideas through extended periods
- Greatly reduce false signals and improve stability
- Customizable OB/OS thresholds adaptive to different markets
- Allow pyramiding to improve profitability
- Missing short-term opportunities due to lengthy periods
- Requires patience waiting for trading signals
- Improper OB/OS threshold settings may increase losses
- Risks of being trapped
Solutions:
- Shorten the periods properly to increase trading frequency
- Take partial positions to diversify risks
- Optimize parameters to adapt to changing market conditions
- Set stop loss to avoid huge losses
- Optimize RSI parameters to find the best period combination
- Test different SMA smoothing periods
- Optimize OB/OS parameters to fit different markets
- Add stop loss strategies to control single loss
The Slow RSI OB/OS strategy successfully explored new trading ideas by extending periods and using SMA to suppress fluctuations. With proper parameter tuning and risk control, the strategy has the potential to achieve steady and profitable excess returns. In conclusion, the strategy is highly innovative and valuable to use.
[/trans]
Strategy Arguments
| Argument | Default | Description |
|---|---|---|
| v_input_1_ohlc4 | 0 | Price Source: ohlc4 |
| v_input_2 | 500 | RSI Length |
| v_input_3 | 250 | RSI SMA |
| v_input_4 | 52 | OB |
| v_input_5 | 48 | OS |
Source (PineScript)
/*backtest
start: 2023-12-20 00:00:00
end: 2023-12-27 00:00:00
period: 1m
basePeriod: 1m
exchanges: [{"eid":"Futures_Binance","currency":"BTC_USDT"}]
*/


// Wilder was a very influential man when it comes to TA. However, I'm one to always try to think outside the box.
// While Wilder recommended that the RSI be used only with a 14 bar lookback period, I on the other hand think there is a lot to learn from RSI if one simply slows down the lookback period
// Same applies for MACD.
// Every market has its dynmaics. So don't narrow your mind by thinking my source code input levels are the only levels that work.
// Since the long lookback period weakens the plot volatility, again, one must think outside the box when trying to guage overbought and oversold levels.

// Good luck and don't bash me if some off-the-wall FA spurned divergence causes you to lose money.
// And NO this doesn't repaint and I won't answer those who ask.
//@version=4

strategy("SLOW RSI OB/OS Strategy", overlay=false)
price = input(ohlc4, title="Price Source")
len = input(500, minval=1, step=5,  title="RSI Length")
smoother = input(250, minval=1, step=5, title="RSI SMA")
up = rma(max(change(price), 0), len)
down = rma(-min(change(price), 0), len)
rsi = down == 0 ? 100 : up == 0 ? 0 : 100 - (100 / (1 + up / down))
EmaRSI = ema(rsi,smoother)
plot(EmaRSI, title="EmaRSI", style=line, linewidth=1, color=yellow)


OB = input(52, step=0.1)
OS = input(48, step=0.1)
hline(OB, linewidth=1, color=red)
hline(OS,linewidth=1, color=green)
hline(50,linewidth=1, color=gray)


long = change(EmaRSI) > 0 and EmaRSI <= 50 and crossover(EmaRSI, OS)
short = change(EmaRSI) < 0 and EmaRSI >= 50 and crossunder(EmaRSI, OB)


strategy.entry("Long", strategy.long, when=long) //_signal or long) //or closeshort_signal)
strategy.entry("Short", strategy.short, when=short) //_signal or short) // or closelong_signal)

// If you want to try to play with exits you can activate these!

//closelong = crossunder(EmaRSI, 0) //or crossunder(EmaRSI, OS)
//closeshort = crossover(EmaRSI, 0) //or crossover(EmaRSI, OB)

//strategy.close("Long", when=closelong)
//strategy.close("Short", when=closeshort)
Detail
https://www.fmz.com/strategy/436910
Last Modified
2023-12-28 18:07:48
