Name
月度收益表现策略Monthly-Performance-PnL-Calendar-Strategy
Author
ChaoZhang
Strategy Description
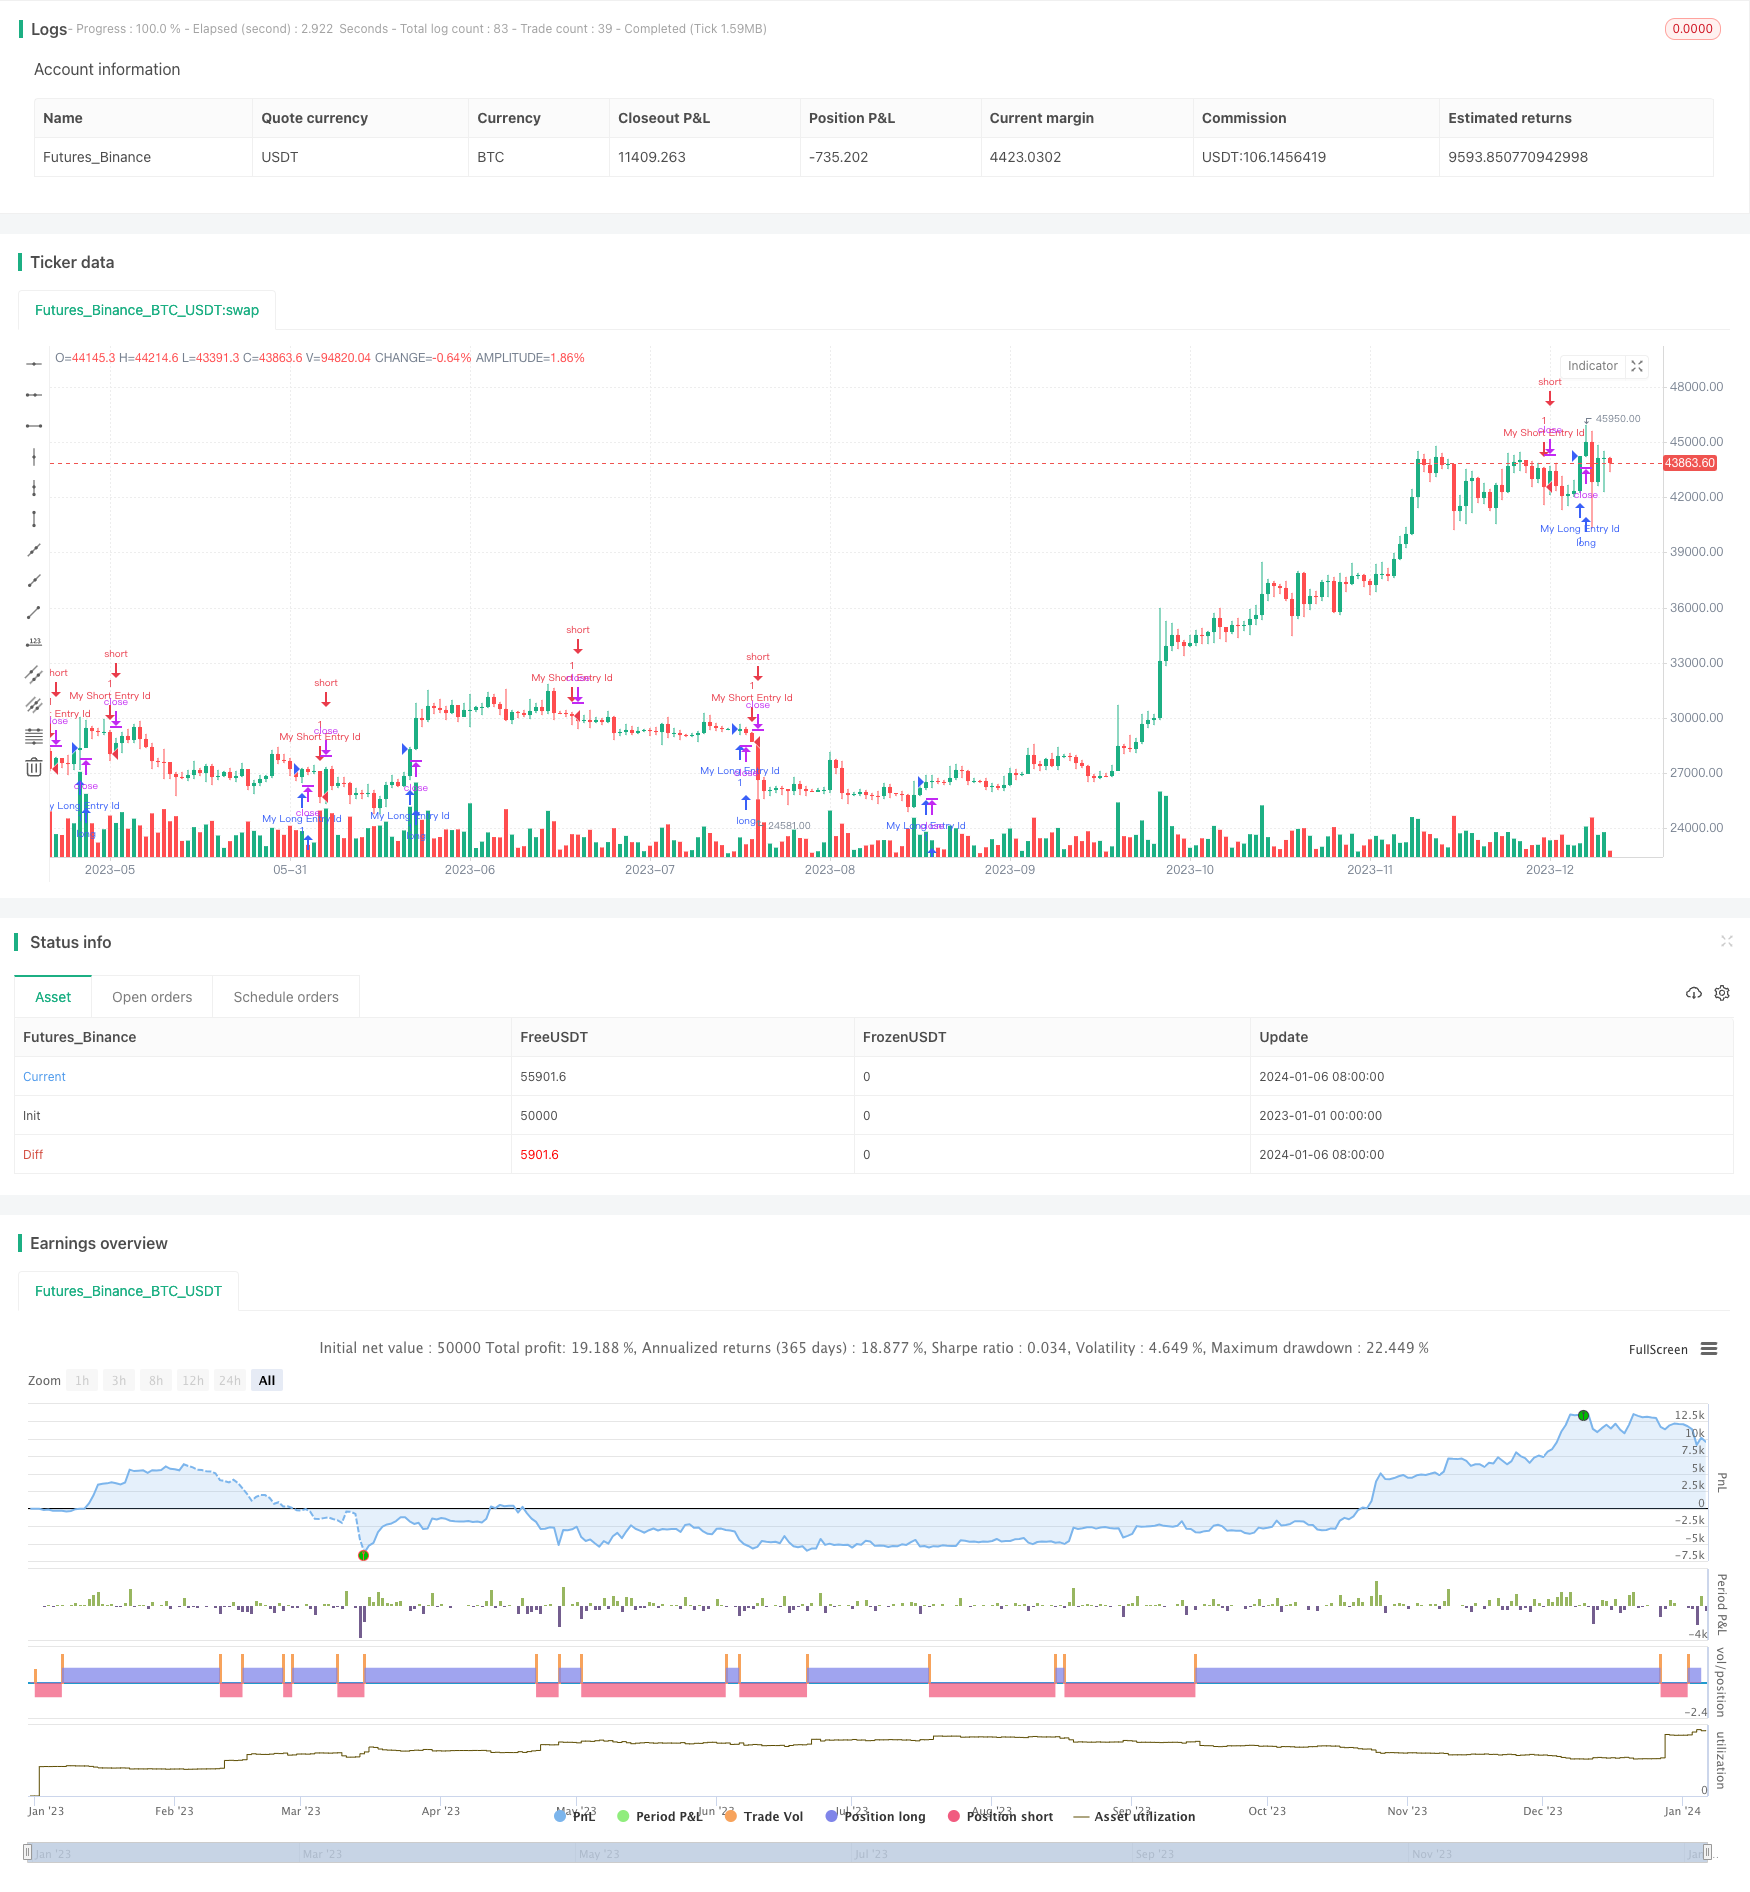
这个策略的主要功能是实时跟踪和展示每月的收益表现。它会在一个表格里面实时更新每月的具体盈亏情况。
该策略通过以下几个步骤实现月度收益表现跟踪:
- 定义变量记录本月是否有交易平仓的情况。
- 定义变量记录每月的具体盈亏数值。
- 定义变量记录时间对应的月份。
- 当本月有平仓时,记录本月盈亏和月份到对应的数组里。
- 在表格指定位置显示月份标题。
- 遍历月份盈亏数组,在表格对应的月份列显示盈亏值。
- 同时显示对应的年份信息。
- 对每年的盈亏进行汇总。
- 使用颜色区分盈亏的正负。
以上就是该策略的基本步骤和工作原理。
这种月度盈亏表现跟踪策略具有以下几个优势:
- 实时更新,可以随时查看最新的月度盈亏情况。
- 一目了然,使用表格直观展示每月具体盈亏。
- 细粒度,可以清晰看到每个月份的详情。
- 直观比较,使用颜色可以更直观地对比每个月的盈亏。
- 汇总统计,同时给出每年的盈亏汇总情况。
- 可定制展示,可以调整表格位置、大小等展示方式。
该策略也存在一些风险:
- 计算逻辑较复杂,容易出错导致数据不准确。
- 表格展示过于频繁刷新,可能影响性能。
- 数组数据存储效率较低。
- 时间和月份的转换计算可能出错。
可以通过以下方法降低风险:
- 严格代码审查,确保计算逻辑正确。
- 优化表格刷新频率,防止过度刷新。
- 改用更高效的数据结构存储数据。
- 添加时间和月份转换的异常处理。
该策略可以从以下几个方面进行优化:
- 使用更高效的数据结构,如字典存储每月数据。
- 增加年化收益率的计算。
- 增加涨跌幅和其他衡量指标。
- 可视化地显示收益曲线走势。
- 支持自定义开始结束统计时间段。
- 支持导出数据到CSV文件。
这些优化可以让策略的功能更加完善和强大,使用体验也会更好。
该策略利用数组和表格的方式,实现了实时跟踪和展示每个月收益情况的核心功能。简单高效,使用也很方便。同时也具有一定的优势,但也存在一些风险需要防范。通过一些计算逻辑和性能的优化,可以使该策略变得更加完美和强大。总的来说,这是一个非常实用的月度收益表现跟踪策略。
||
The main function of this strategy is to track and display the monthly performance in real time. It will update the profit and loss of each month in a table in real time.
The strategy achieves monthly performance tracking through the following steps:
- Define variables to record whether there are closed trades this month.
- Define variables to record the specific profit and loss value of each month.
- Define variables to record the month corresponding to the time.
- When there are closed trades this month, record the monthly PnL and month into corresponding arrays.
- Display month titles in specified positions in the table.
- Traverse the monthly PnL array and display PnL values in the corresponding month columns in the table.
- Display the corresponding year info at the same time.
- Summarize the PnL of each year.
- Use colors to distinguish positive and negative PnLs.
Above are the basic steps and working principles of this strategy.
This kind of monthly performance tracking strategy has the following advantages:
- Real-time update to view the latest monthly PnL status anytime.
- Intuitive display of specific monthly PnL in tables.
- Fine-grained to see details of each month clearly.
- Intuitive comparison by using colors to contrast monthly PnLs more visually.
- Statistical summation also provides annual PnL summation.
- Customizable display to adjust table location, size etc.
This strategy also has some risks:
- Complex logic can cause inaccurate data due to errors.
- Too frequent table refresh may affect performance.
- Array data storage is less efficient.
- Time and month conversion calculations may go wrong.
Risks can be reduced through:
- Strict code review to ensure correct logic.
- Optimize refresh frequency to prevent over-refreshing.
- Use more efficient data structures to store data.
- Add exception handling for time and month conversions.
Optimizations of this strategy:
- Use more efficient data structures like dictionaries to store monthly data.
- Add annualized return calculations.
- Add other metrics like rate of change.
- Visually display return curves.
- Support custom time range for statistics.
- Support exporting data to CSV files.
These can improve the strategy's functionality and user experience.
This strategy achieves the core function of real-time tracking and displaying monthly returns using arrays and tables. It is simple, efficient and easy to use. It also has some advantages but there are still some risks to prevent. With optimizations in logic and performance, it can become more perfect and powerful. Overall a very practical monthly performance tracking strategy.
[/trans]
Strategy Arguments
| Argument | Default | Description |
|---|---|---|
| v_input_1 | 20 | Length |
| v_input_bool_1 | true | (?Monthly Performance)Show Monthly Monthly Performance ? |
| v_input_2 | 0 | Location: Bottom Right |
| v_input_3 | 0 | Size: Small |
Source (PineScript)
/*backtest
start: 2023-01-01 00:00:00
end: 2024-01-07 00:00:00
period: 1d
basePeriod: 1h
exchanges: [{"eid":"Futures_Binance","currency":"BTC_USDT"}]
*/

// This source code is subject to the terms of the Mozilla Public License 2.0 at https://mozilla.org/MPL/2.0/
// © MAURYA_ALGO_TRADER

//@version=5
strategy("Monthly Performance", overlay=true)

period = input(20, "Length")

longCondition =   close > high[20]  //ta.crossover(ta.sma(close, 14), ta.sma(close, 28))
if (longCondition)
    strategy.entry("My Long Entry Id", strategy.long)

shortCondition = close < low[20]  //ta.crossunder(ta.sma(close, 14), ta.sma(close, 28))
if (shortCondition)
    strategy.entry("My Short Entry Id", strategy.short)


// Copy below code to end of the desired strategy script
///////////////////////////////////////////////////////////////////////////////////////////////////////////////////////
//                                 monthly pnl performance  by Dr. Maurya @MAURYA_ALGO_TRADER                        //
///////////////////////////////////////////////////////////////////////////////////////////////////////////////////////
show_performance = input.bool(true, 'Show Monthly Monthly Performance ?', group='Monthly Performance')

dash_loc_mp = input("Bottom Right","Location"  ,options=["Top Right","Bottom Right","Top Left","Bottom Left", "Middle Right","Bottom Center"]  ,group='Monthly Performance', inline = "performance")

text_size_mp = input('Small',"Size"  ,options=["Tiny","Small","Normal","Large"]  ,group='Monthly Performance', inline = "performance")

var table_position_mp = dash_loc_mp == 'Top Left' ? position.top_left :
  dash_loc_mp == 'Bottom Left' ? position.bottom_left :
  dash_loc_mp == 'Middle Right' ? position.middle_right :
  dash_loc_mp == 'Bottom Center' ? position.bottom_center :
  dash_loc_mp == 'Top Right' ? position.top_right : position.bottom_right

var table_text_size_mp = text_size_mp == 'Tiny' ? size.tiny :
  text_size_mp == 'Small' ? size.small :
  text_size_mp == 'Normal' ? size.normal : size.large

/////////////////
text_c = color.white

/////////////////////////////////////////////

// var bool new_month = na
new_month = ta.change(month) //> 0 ? true : false
newest_month = new_month and strategy.closedtrades >= 1
strategy.initial_capital = 50000
// profit
only_profit = strategy.netprofit
initial_balance = strategy.initial_capital

// month number
var int month_number = na
month_number := (ta.valuewhen(newest_month, month(time), 0)) //and month(time) > 1 ? (ta.valuewhen(newest_month, month(time), 0) - 1) :  12 //1 to 12

//month_year
var int month_time = na
month_time := ta.valuewhen(newest_month, time, 0) - 2419200000


var int m_counter = 0
if newest_month
    m_counter += 1


// current month values
var bool new_year = na
new_year := ta.change(year)
curr_m_pnl = only_profit - nz(ta.valuewhen(newest_month, only_profit, 0), 0)
curr_m_number = newest_month ? ta.valuewhen(newest_month, month(time), 0) : month(time)
curr_y_pnl = (only_profit - nz(ta.valuewhen(new_year, only_profit, 0),0))


var float [] net_profit_array = array.new_float()
var int [] month_array = array.new_int()
var int [] month_time_array = array.new_int()


if newest_month
    array.push(net_profit_array, only_profit)
    array.push(month_array, month_number)
    array.push(month_time_array, month_time)


var float [] y_pnl_array = array.new_float()
var int [] y_number_array = array.new_int()
var int [] y_time_array = array.new_int()

newest_year = ta.change(year) and strategy.closedtrades >= 1
get_yearly_pnl = nz(ta.valuewhen(newest_year, strategy.netprofit, 0) - nz(ta.valuewhen(newest_year, strategy.netprofit, 1), 0), 0)
get_m_year = ta.valuewhen(newest_year, year(time), 1)
get_y_time = ta.valuewhen(newest_year, time, 0)

if newest_year
    array.push(y_pnl_array, get_yearly_pnl)
    array.push(y_number_array, get_m_year)
    array.push(y_time_array, get_y_time)
var float monthly_profit = na
var int column_month_number = na
var int row_month_time = na


var testTable = table.new(position = table_position_mp, columns = 14, rows = 40, bgcolor = color.rgb(7, 226, 242, 38), border_color = color.white, border_width = 1)
if barstate.islastconfirmedhistory and show_performance
    table.cell(table_id = testTable, column = 0, row = 0, text = "YEAR", text_color = text_c, text_size=table_text_size_mp)
    table.cell(table_id = testTable, column = 1, row = 0, text = "JAN", text_color = text_c, text_size=table_text_size_mp)
    table.cell(table_id = testTable, column = 2, row = 0, text = "FEB", text_color = text_c, text_size=table_text_size_mp)
    table.cell(table_id = testTable, column = 3, row = 0, text = "MAR", text_color = text_c, text_size=table_text_size_mp)
    table.cell(table_id = testTable, column = 4, row = 0, text = "APR", text_color = text_c, text_size=table_text_size_mp)
    table.cell(table_id = testTable, column = 5, row = 0, text = "MAY", text_color = text_c, text_size=table_text_size_mp)
    table.cell(table_id = testTable, column = 6, row = 0, text = "JUN", text_color = text_c, text_size=table_text_size_mp)
    table.cell(table_id = testTable, column = 7, row = 0, text = "JUL", text_color = text_c, text_size=table_text_size_mp)
    table.cell(table_id = testTable, column = 8, row = 0, text = "AUG", text_color = text_c, text_size=table_text_size_mp)
    table.cell(table_id = testTable, column = 9, row = 0, text = "SEP", text_color = text_c, text_size=table_text_size_mp)
    table.cell(table_id = testTable, column = 10, row = 0, text = "OCT", text_color = text_c, text_size=table_text_size_mp)
    table.cell(table_id = testTable, column = 11, row = 0, text = "NOV", text_color = text_c, text_size=table_text_size_mp)
    table.cell(table_id = testTable, column = 12, row = 0, text = "DEC", text_color = text_c, text_size=table_text_size_mp)
    table.cell(table_id = testTable, column = 13, row = 0, text = "YEAR P/L", text_color = text_c, text_size=table_text_size_mp)

    for i = 0 to (array.size(y_number_array) == 0 ? na : array.size(y_number_array) - 1)
        row_y = year(array.get(y_time_array, i)) - year(array.get(y_time_array, 0)) + 1
        table.cell(table_id = testTable, column = 13, row = row_y, text = str.tostring(array.get(y_pnl_array , i), "##.##") + '\n' + '(' + str.tostring(array.get(y_pnl_array , i)*100/initial_balance, "##.##") + ' %)', bgcolor = array.get(y_pnl_array , i) > 0 ? color.green : array.get(y_pnl_array , i) < 0 ? color.red : color.gray, text_color = color.rgb(0, 0, 0), text_size=table_text_size_mp)
    curr_row_y = array.size(month_time_array) == 0 ? 1 : (year(array.get(month_time_array, array.size(month_time_array) - 1))) - (year(array.get(month_time_array, 0))) + 1
    table.cell(table_id = testTable, column = 13, row = curr_row_y, text = str.tostring(curr_y_pnl, "##.##") + '\n' + '(' + str.tostring(curr_y_pnl*100/initial_balance, "##.##") + ' %)', bgcolor = curr_y_pnl > 0 ? color.green : curr_y_pnl < 0 ? color.red : color.gray, text_color = color.rgb(0, 0, 0), text_size=table_text_size_mp)


    for i = 0 to (array.size(net_profit_array) == 0 ? na : array.size(net_profit_array) - 1)
        monthly_profit := i > 0 ? ( array.get(net_profit_array, i) - array.get(net_profit_array, i - 1) ) : array.get(net_profit_array, i)
        column_month_number := month(array.get(month_time_array, i))
        row_month_time :=((year(array.get(month_time_array, i))) - year(array.get(month_time_array, 0)) ) + 1
        table.cell(table_id = testTable, column = column_month_number, row = row_month_time, text = str.tostring(monthly_profit, "##.##") + '\n' + '(' + str.tostring(monthly_profit*100/initial_balance, "##.##") + ' %)', bgcolor = monthly_profit > 0 ? color.green : monthly_profit < 0 ? color.red : color.gray, text_color = text_c, text_size=table_text_size_mp)
        table.cell(table_id = testTable, column = 0, row =row_month_time, text = str.tostring(year(array.get(month_time_array, i)), "##.##"), text_color = text_c, text_size=table_text_size_mp)

    curr_row_m = array.size(month_time_array) == 0 ? 1 : (year(array.get(month_time_array, array.size(month_time_array) - 1))) - (year(array.get(month_time_array, 0))) + 1
    table.cell(table_id = testTable, column = curr_m_number, row = curr_row_m, text = str.tostring(curr_m_pnl, "##.##") + '\n' + '(' + str.tostring(curr_m_pnl*100/initial_balance, "##.##") + ' %)', bgcolor = curr_m_pnl > 0 ? color.green : curr_m_pnl < 0 ? color.red : color.gray, text_color = text_c, text_size=table_text_size_mp)
    table.cell(table_id = testTable, column = 0, row =curr_row_m, text = str.tostring(year(time), "##.##"), text_color = text_c, text_size=table_text_size_mp)

//============================================================================================================================================================================
Detail
https://www.fmz.com/strategy/438052
Last Modified
2024-01-08 16:16:58