Name
突破回调开仓策略Breakthrough-Callback-Long-Strategy
Author
ChaoZhang
Strategy Description
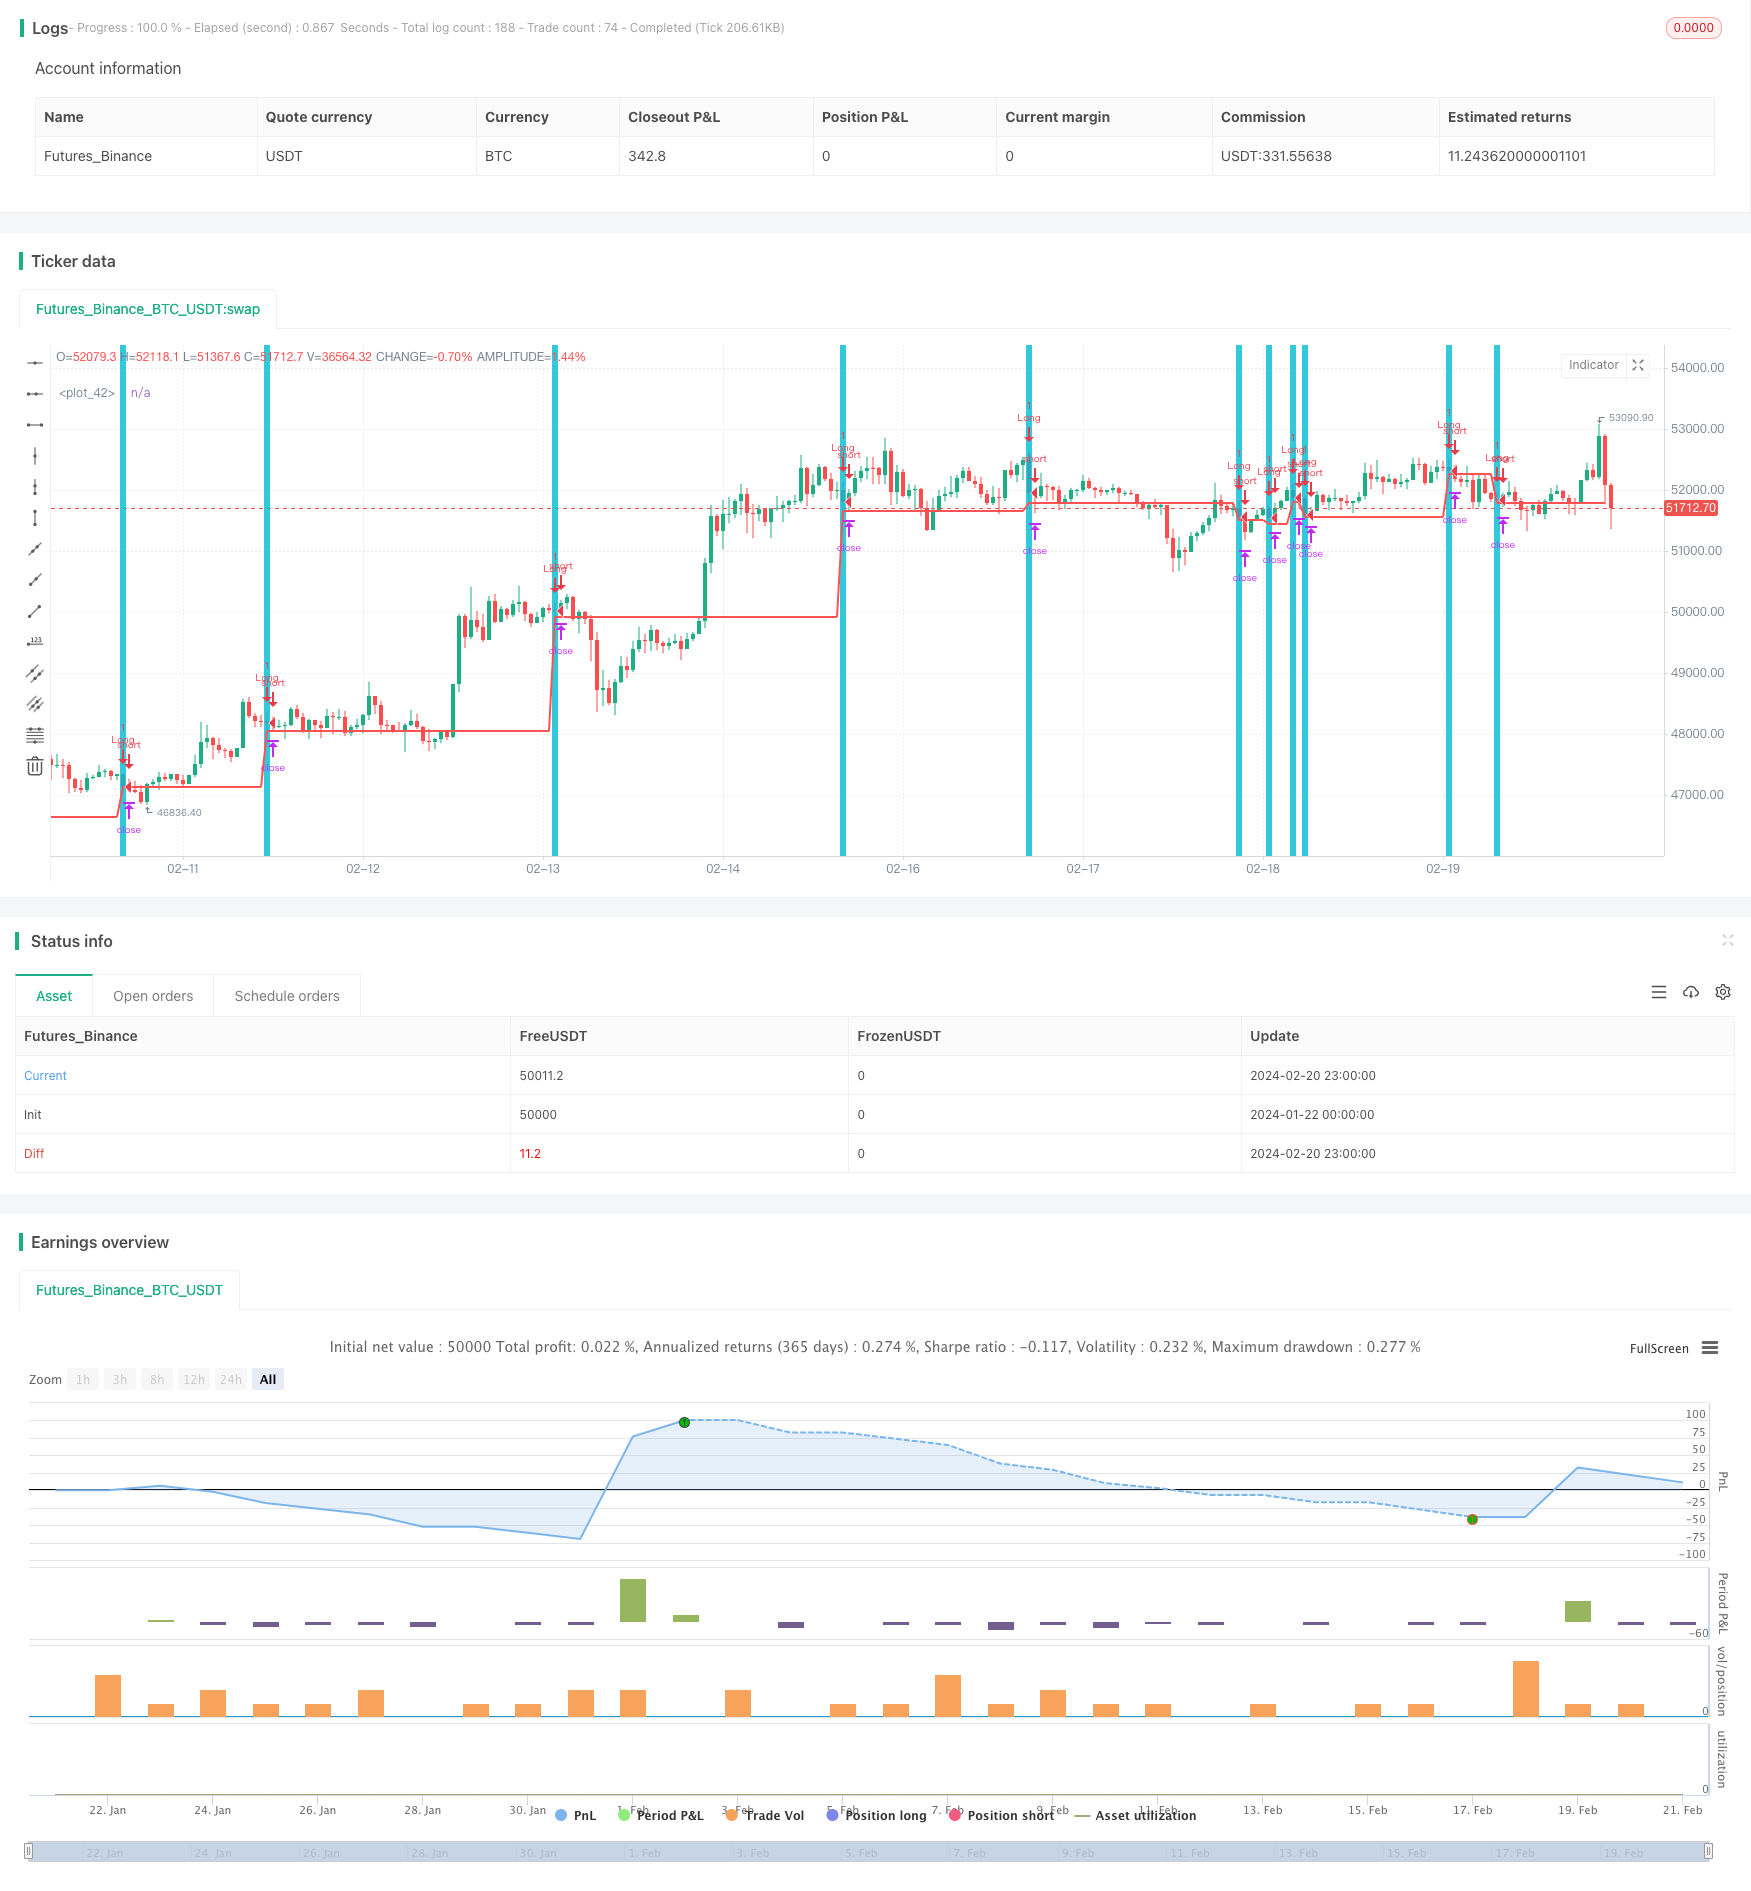
该策略的主要思想是在出现特定的K线形态后开仓做多,即在出现向下跳空的阴线(colorbar)并且下一根K线低点回调的情况下在下一根K线开盘的时候做多入场。
该策略判断的具体条件是:前一根K线相比前两根K线的最低点更低而最高点更高,即出现了向下跳空;而当前K线的最低点又低于或等于前一根K线的最低点,即发生了回调。当同时满足这两个条件时,在下一根K线开盘的时候做多入场。
做多后设置止损为回调低点即前一根K线的最低价,同时设置止盈为开仓价格的2%以上。当价格触碰到止盈或者止损价格后平仓。
该策略最大的优势在于抓住了短期内极有可能出现的反弹机会。当出现向下跳空的K线然后发生回调时,这是一个非常有力的技术形态,说明空头的力量可能在该级别耗尽,有很大的概率会出现反弹。因此这是一个相对比较适合短线操作的策略。
该策略的主要风险在于回调结束后价格继续下跌的可能性。因为我们是在回调低点附近做多,如果不能及时止损,那么可能面临较大的损失。此外,如果回调幅度较小,止损点设置得比较近的话,可能会被套。因此这个策略还是比较适合短线操作,需要密切关注价格行情,及时止损。
可以考虑结合其他指标来确定入场时机,比如可以在MACD发生金叉时再入场,或者可以计算typical price看是否处于支撑位置等,这可以过滤一些假信号,提高策略的稳定性。此外,可以研究不同品种、不同时间周期下该策略的表现,寻找最佳的参数组合。还可以通过机器学习等方法来自动优化参数。
该策略总的来说是一个典型的短线突破回调做多策略。它抓住了跳空且发生回调这一强势形态所提供的反弹机会。但同时也面临着无法及时止损而造成较大损失的风险,因此适合频繁监控市场的短线操作。通过进一步结合其他指标过滤信号以及参数优化,可以提高策略的效果。
||
The main idea of this strategy is to open a long position after a specific candlestick pattern emerges, namely opening a long position at the next bar's open after a downside gap (colorbar) followed by a pullback to the previous bar's low.
The specific conditions for this strategy are: the previous bar has a lower low and higher high compared to the prior two bars, indicating a downside gap; and the current bar's low is less than or equal to the previous bar's low, signaling a pullback has occurred. When both conditions are met, a long position is opened at the next bar's open.
After opening the long position, the stop loss is set at the pullback low, which is the previous bar's low, and take profit is set at more than 2% above the entry price. When either take profit or stop loss is touched, the position is closed.
The biggest advantage of this strategy is seizing the high probability rebound opportunity after the specific candlestick pattern. The downside gap followed by pullback represents an extremely powerful technical pattern that indicates the selling pressure may have exhausted at this level and a high probability rebound is likely to happen. Therefore, this strategy is more suitable for short-term trading.
The major risk is the continuing dropdown after pullback ends. As we are taking long positions around pullback lows, significant losses may be incurred if unable to cut loss in time. Also, if the pullback range is small, the stop loss set too tightly may cause being stopped out. Thus this strategy is more preferable for short-term trading, requiring close market attention and timely stop loss.
Other technical indicators can be incorporated to improve signal accuracy and strategy stability, like entering on MACD gold cross, or checking typical price is at support level before entry. In addition, walk forward optimization can be conducted across different products and timeframes to find the optimal parameter set. Machine learning techniques may also be leveraged for automated parameter tuning.
In summary, this is a typical short-term breakout pullback long strategy. It captures the rebound opportunity after the strong pattern of downside gap followed by pullback. But it also bears the risk of huge losses if failing to cut losses in time. Frequent market monitoring is necessitated for favorable results. Further improvements can be made via filtering signals with more indicators and parameter optimization.
[/trans]
Strategy Arguments
| Argument | Default | Description |
|---|---|---|
| v_input_1 | 2 | Take Profit % |
Source (PineScript)
/*backtest
start: 2024-01-22 00:00:00
end: 2024-02-21 00:00:00
period: 1h
basePeriod: 15m
exchanges: [{"eid":"Futures_Binance","currency":"BTC_USDT"}]
*/

//@version=3
//  Created by Leon Ross
//study(title="OutsideDownOpenLower", shorttitle="ODOL", overlay=true)
strategy(title = "Outside", shorttitle = "OB", overlay = true )


//Window of time
//start     = timestamp(2018, 01, 01, 00, 00)  // backtest start window
//finish    = timestamp(2018, 12, 31, 23, 59)        // backtest finish window
//window()  => time >= start and time <= finish ? true : false // create function "within window of time"

//Conditions
outsideBar = low < low[1] and high > high[1] and close < open
allConditions = outsideBar

//Stop and Take Profit as percentages
//inpTakeProfit   = input(2, title='Take Profit %', type=float)/100
//takeProfitValue = strategy.position_avg_price * (1 + inpTakeProfit)
//useTakeProfit   = inpTakeProfit  > 0 ?  takeProfitValue : na
//inpStopLoss     = input(1, title='Stop Loss %', type=float)/100
//stopLossValue = strategy.position_avg_price * (1 - inpStopLoss)
//useStopLoss     = inpStopLoss    > 0 ?  stopLossValue   : na
//entry = strategy.position_avg_price


//Stop as last bars low and profit as percentage
entry = strategy.position_avg_price
inpTakeProfit   = input(2.0, title='Take Profit %', type=float)/100
takeProfitValue = strategy.position_avg_price * (1 + inpTakeProfit)
useTakeProfit   = inpTakeProfit  > 0 ?  takeProfitValue : na
inpStopLoss     = valuewhen(allConditions, low, 0)
stopLossValue = inpStopLoss
useStopLoss     = inpStopLoss    > 0 ?  stopLossValue   : na


//Plots
bgcolor(allConditions ==1 ? aqua : na, transp=70)
plot(entry, color=blue, style=linebr, linewidth=2)
plot(useStopLoss, color=red, style=linebr, linewidth=2)
plot(useTakeProfit, color=green, style=linebr, linewidth=2)


//Entires
strategy.entry(id = "Long", long = true, when = allConditions) // use function or simple condition to decide when to get in

//Exits
//if (barssince(allConditions) == 2)
    //strategy.close("Long")
//else
strategy.exit("Exit Long", from_entry = "Long", stop = useStopLoss)
Detail
https://www.fmz.com/strategy/442519
Last Modified
2024-02-22 15:41:53