Name
超级趋势指标DEMA双重趋势追踪策略Dual-Trend-Tracking-Strategy
Author
ChaoZhang
Strategy Description
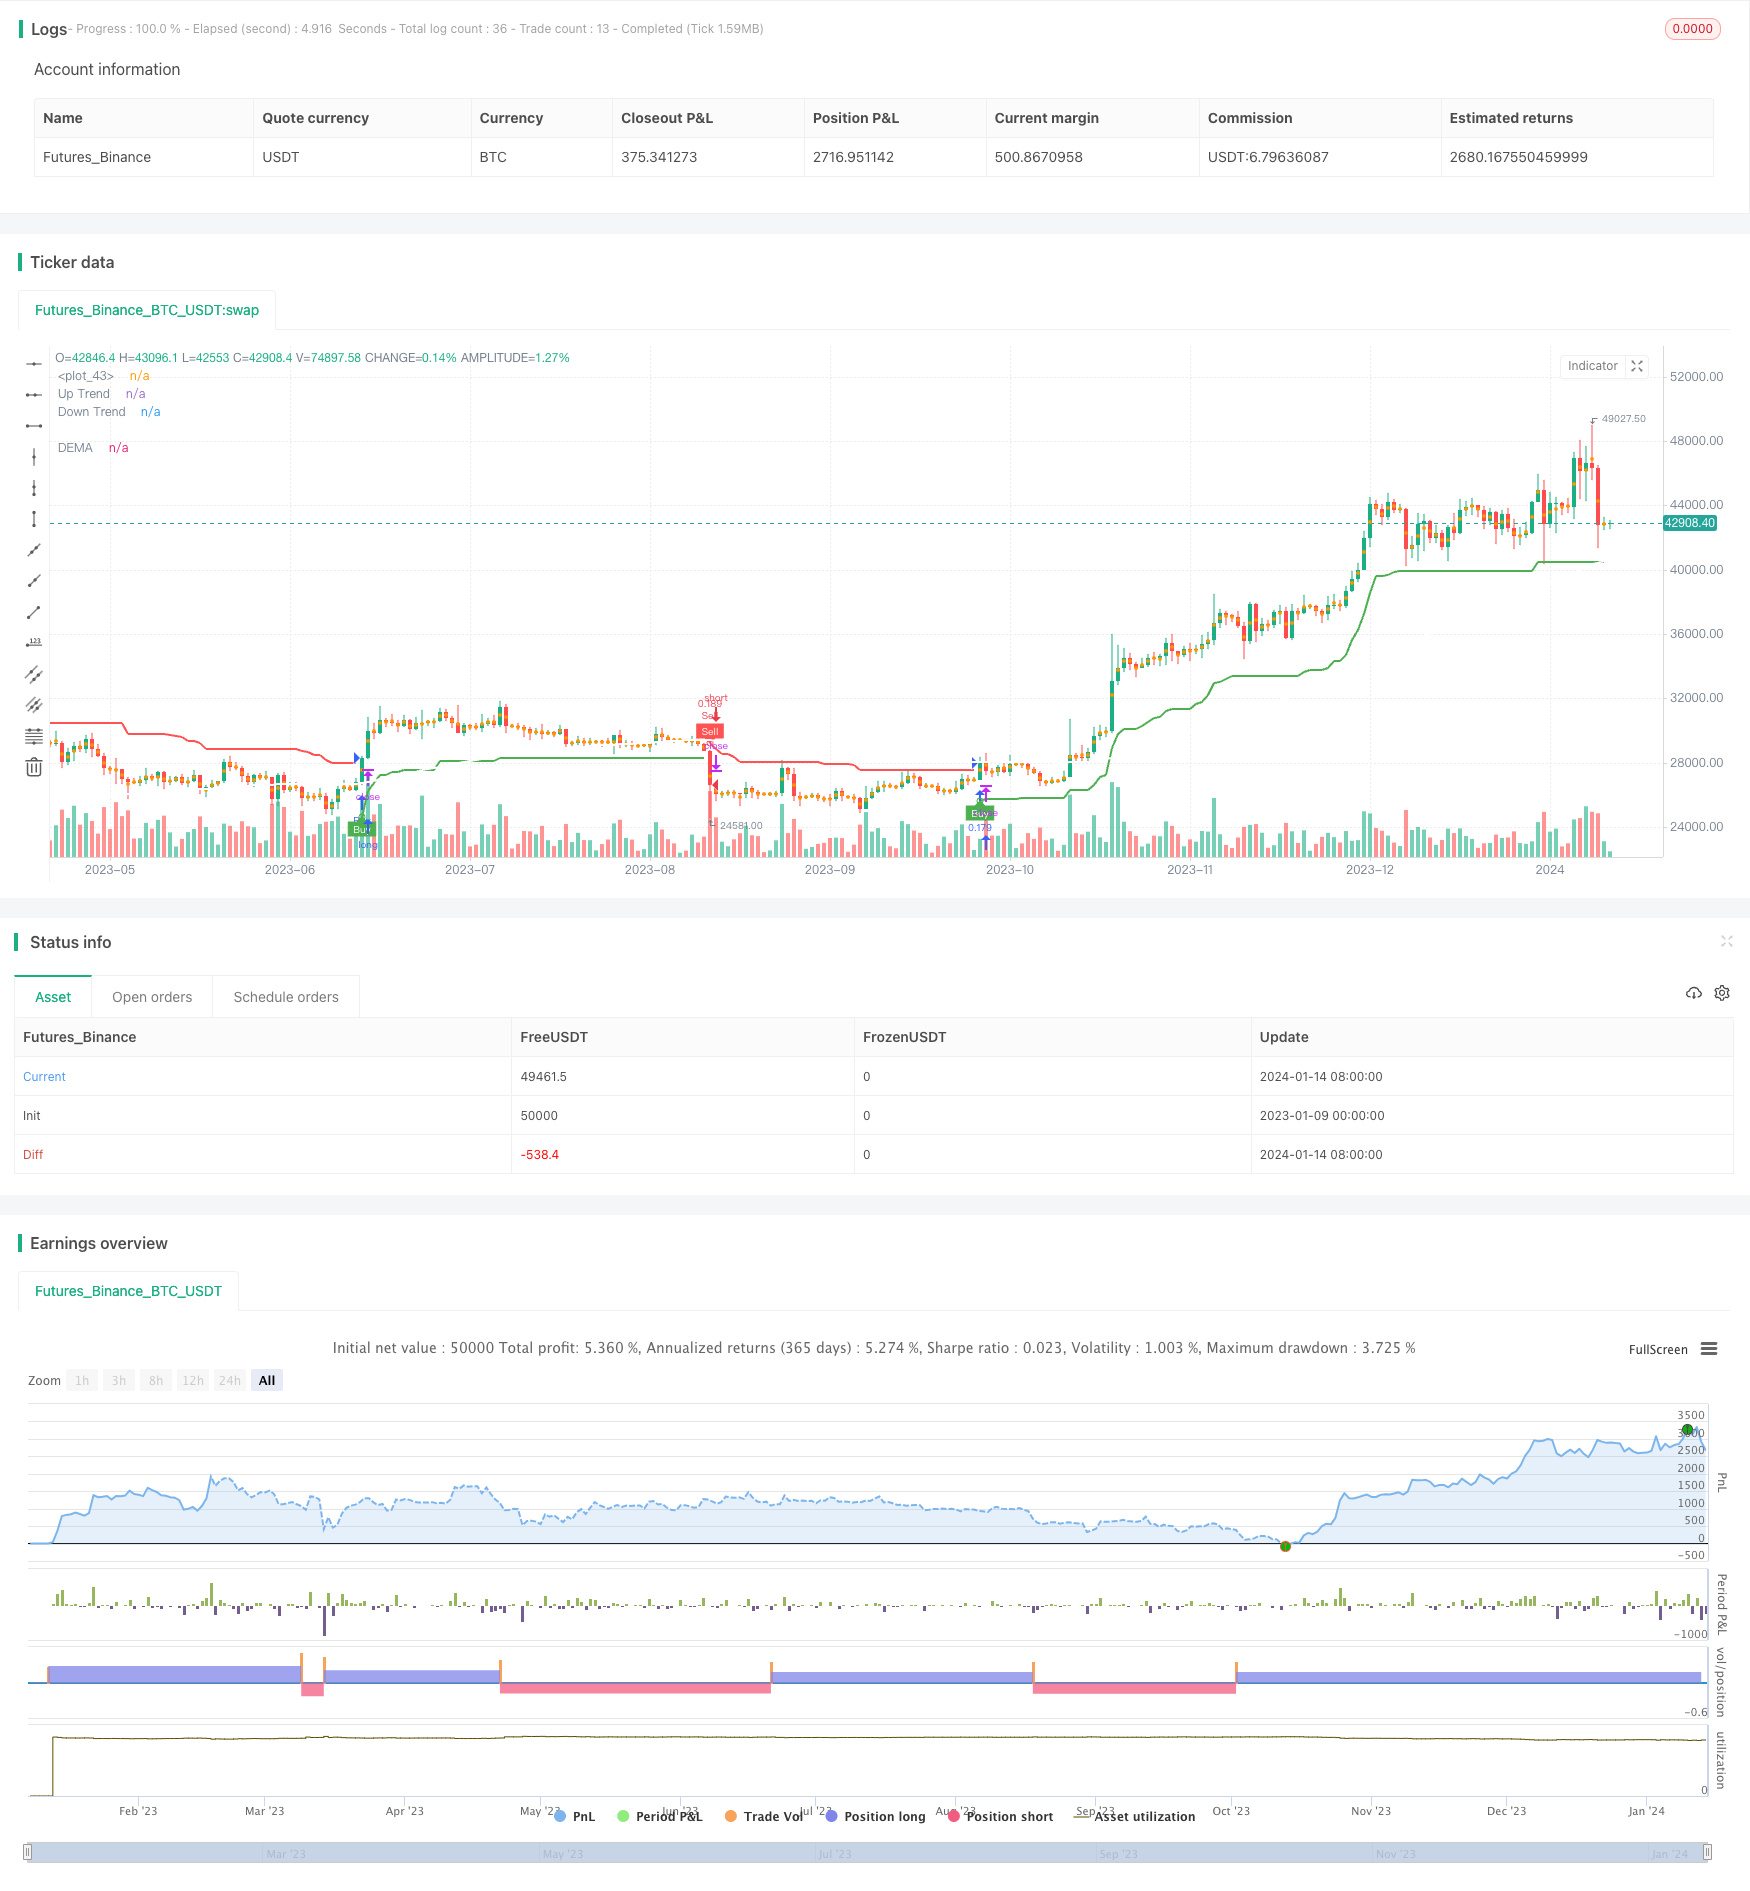
双重趋势追踪策略是一个结合超级趋势指标、双指数移动平均线(DEMA)和布林带的复合策略。它旨在利用多种技术指标的优势,在趋势反转时及时捕捉买卖信号。
该策略主要由三个部分组成:
-
超级趋势指标:计算向上突破线和向下突破线,判断目前的趋势方向。当价格从下向上突破超级趋势线时生成买入信号;从上向下突破时生成卖出信号。
-
双指数移动平均线(DEMA):一种趋势跟踪指标,结合了简单移动平均线和指数移动平均线的特点,能更快地响应价格变动。策略中设置200日的DEMA,用来判断长期趋势方向。
-
布林带:表示价格波动的范围。布林带异常收缩或扩张时,预示着可能的趋势反转。
当超级趋势指标和DEMA都发出买入/卖出信号时,即进入相应的仓位。此外,布林带的异常也可作为辅助判断的信号。
- 多指标组合,综合判断,减少假信号。
- 超级趋势指标对细小价格变动不敏感,只在趋势转折点产生信号,避免过于频繁交易。
- DEMA平滑曲线,判断长期趋势准确可靠。
- 布林带辅助判断趋势反转点。
- 超级趋势指标参数设置过于灵敏,可能产生较多噪音。可调整ATR周期和倍数参数实现优化。
- DEMA周期过长追随趋势能力差。可以测试缩短至100天等参数。
- 多指标组合判断时信号不一致的情况。这时可遵循超级趋势指标为主信号。
- 测试不同的ATR周期和倍数参数设定,找到超级趋势指标最佳参数。
- 优化DEMA周期参数。
- 添加其他指标辅助判断,如KDJ、MACD等。
- 增加止损策略。
双重趋势追踪策略多指标组合,综合利用超级趋势、DEMA和布林带三者的优势,在抓取趋势的同时提高信号质量,通过参数优化可期望获得更好的策略效果。止损机制的添加也是未来的优化重点。
||
The Dual Trend Tracking Strategy is a composite strategy combining the Supertrend indicator, Double Exponential Moving Average (DEMA) and Bollinger Bands. It aims to timely capture buy and sell signals when trends reverse by leveraging the advantages of multiple technical indicators.
The strategy consists of three main parts:
-
Supertrend Indicator: Calculates the up breakout line and down breakout line to determine the current trend direction. It generates buy signals when the price breaks out upwards from the supertrend line, and sell signals when the price breaks out downwards.
-
Double Exponential Moving Average (DEMA): A trend tracking indicator that combines the features of simple moving average and exponential moving average, which can respond to price changes faster. The strategy sets a 200-day DEMA to judge the long-term trend direction.
-
Bollinger Bands: Represents the fluctuation range of prices. Abnormal contraction or expansion of Bollinger Bands signals potential trend reversals.
When the Supertrend indicator and DEMA both issue buy/sell signals, the strategy enters the corresponding position. In addition, anomalies of Bollinger Bands can serve as auxiliary judgment signals.
-
Combination of multiple indicators reduces false signals.
-
Supertrend indicator is insensitive to minor price changes and only generates signals at trend turning points, avoiding excessive frequency of trading.
-
DEMA smooth curve accurately and reliably judges long-term trends.
-
Bollinger Bands assist in determining trend reversal points.
-
Overly sensitive supertrend parameters may generate more noise. Optimizing the ATR period and multiplier parameters can improve it.
-
Long DEMA period results in poor trend following capability. Can test shortened periods like 100-day.
-
Inconsistent signals when combining judgment of multiple indicators. In this case, the supertrend indicator can be considered the primary signal.
-
Test different ATR periods and multiplier parameters to find the optimal combination for the supertrend indicator.
-
Optimize the DEMA period parameter.
-
Add other auxiliary indicators like KDJ, MACD etc.
-
Introduce stop loss strategies.
The Dual Trend Tracking Strategy combines the strengths of Supertrend, DEMA and Bollinger Bands by using multiple indicators, improving signal quality while capturing trends. Further performance improvements can be expected through parameter optimization and adding stop loss mechanisms.
[/trans]
Strategy Arguments
| Argument | Default | Description |
|---|---|---|
| v_input_1 | 12 | ATR Period |
| v_input_2_hl2 | 0 | Source: hl2 |
| v_input_3 | 3 | ATR Multiplier |
| v_input_4 | true | Change ATR Calculation Method? |
| v_input_5 | true | Show Supertrend Indicator? |
| v_input_6 | 200 | DEMA Period |
| v_input_7 | true | Show DEMA Indicator? |
Source (PineScript)
/*backtest
start: 2023-01-09 00:00:00
end: 2024-01-15 00:00:00
period: 1d
basePeriod: 1h
exchanges: [{"eid":"Futures_Binance","currency":"BTC_USDT"}]
*/

//@version=4
strategy("Supertrend + DEMA + Bollinger Bands", overlay=true, default_qty_type=strategy.percent_of_equity, default_qty_value=10, precision=2)

// Input parameters for Supertrend
atrLength = input(title="ATR Period", type=input.integer, defval=12)
src = input(hl2, title="Source")
multiplier = input(title="ATR Multiplier", type=input.float, step=0.1, defval=3.0)
changeATR = input(title="Change ATR Calculation Method?", type=input.bool, defval=true)
showSupertrend = input(title="Show Supertrend Indicator?", type=input.bool, defval=true)

// Input parameters for DEMA
demaLength = input(200, title="DEMA Period")
showDEMA = input(title="Show DEMA Indicator?", type=input.bool, defval=true)

// Calculate ATR for Supertrend
atr2 = sma(tr, atrLength)
atr = changeATR ? atr(atrLength) : atr2

// Calculate Supertrend
up = src - (multiplier * atr)
up1 = nz(up[1], up)
up := close[1] > up1 ? max(up, up1) : up

dn = src + (multiplier * atr)
dn1 = nz(dn[1], dn)
dn := close[1] < dn1 ? min(dn, dn1) : dn

trend = 1
trend := nz(trend[1], trend)
trend := trend == -1 and close > dn1 ? 1 : trend == 1 and close < up1 ? -1 : trend

// Plot Supertrend
upPlot = plot(showSupertrend ? (trend == 1 ? up : na) : na, title="Up Trend", style=plot.style_linebr, linewidth=2, color=color.new(color.green, 0))
buySignal = trend == 1 and trend[1] == -1
plotshape(buySignal ? up : na, title="UpTrend Begins", location=location.absolute, style=shape.circle, size=size.tiny, color=color.new(color.green, 0))
plotshape(buySignal ? up : na, title="Buy", text="Buy", location=location.absolute, style=shape.labelup, size=size.tiny, color=color.new(color.green, 0), textcolor=color.new(color.white, 0))

dnPlot = plot(showSupertrend ? (trend == 1 ? na : dn) : na, title="Down Trend", style=plot.style_linebr, linewidth=2, color=color.new(color.red, 0))
sellSignal = trend == -1 and trend[1] == 1
plotshape(sellSignal ? dn : na, title="DownTrend Begins", location=location.absolute, style=shape.circle, size=size.tiny, color=color.new(color.red, 0))
plotshape(sellSignal ? dn : na, title="Sell", text="Sell", location=location.absolute, style=shape.labeldown, size=size.tiny, color=color.new(color.red, 0), textcolor=color.new(color.white, 0))

mPlot = plot(ohlc4, title="", style=plot.style_circles, linewidth=0)

longFillColor = (trend == 1 ? color.new(color.green, 80) : color.new(color.white, 0))
shortFillColor = (trend == -1 ? color.new(color.red, 80) : color.new(color.white, 0))

fill(mPlot, upPlot, title="UpTrend Highlighter", color=longFillColor)
fill(mPlot, dnPlot, title="DownTrend Highlighter", color=shortFillColor)

// Alert conditions
alertcondition(buySignal, title="Custom Supertrend Buy", message="Custom Supertrend Buy!")
alertcondition(sellSignal, title="Custom Supertrend Sell", message="Custom Supertrend Sell!")

// Calculate DEMA
ema1 = ema(close, demaLength)
dema = 2 * ema1 - ema(ema1, demaLength)

// Plot DEMA with white color
plot(showDEMA ? dema : na, color=color.new(color.white, 0), title="DEMA", linewidth=2)

// Add push notification on mobile if buy and sell occurred
if (buySignal)
    strategy.entry("Buy", strategy.long)
    strategy.exit("Sell")
    alert("Buy Signal - Supertrend")

if (sellSignal)
    strategy.entry("Sell", strategy.short)
    strategy.exit("Cover")
    alert("Sell Signal - Supertrend")
Detail
https://www.fmz.com/strategy/438938
Last Modified
2024-01-16 15:03:55
