Name
超级趋势RSI与EMA交叉策略SuperTrend-RSI-EMA-Crossover-Strategy
Author
ChaoZhang
Strategy Description
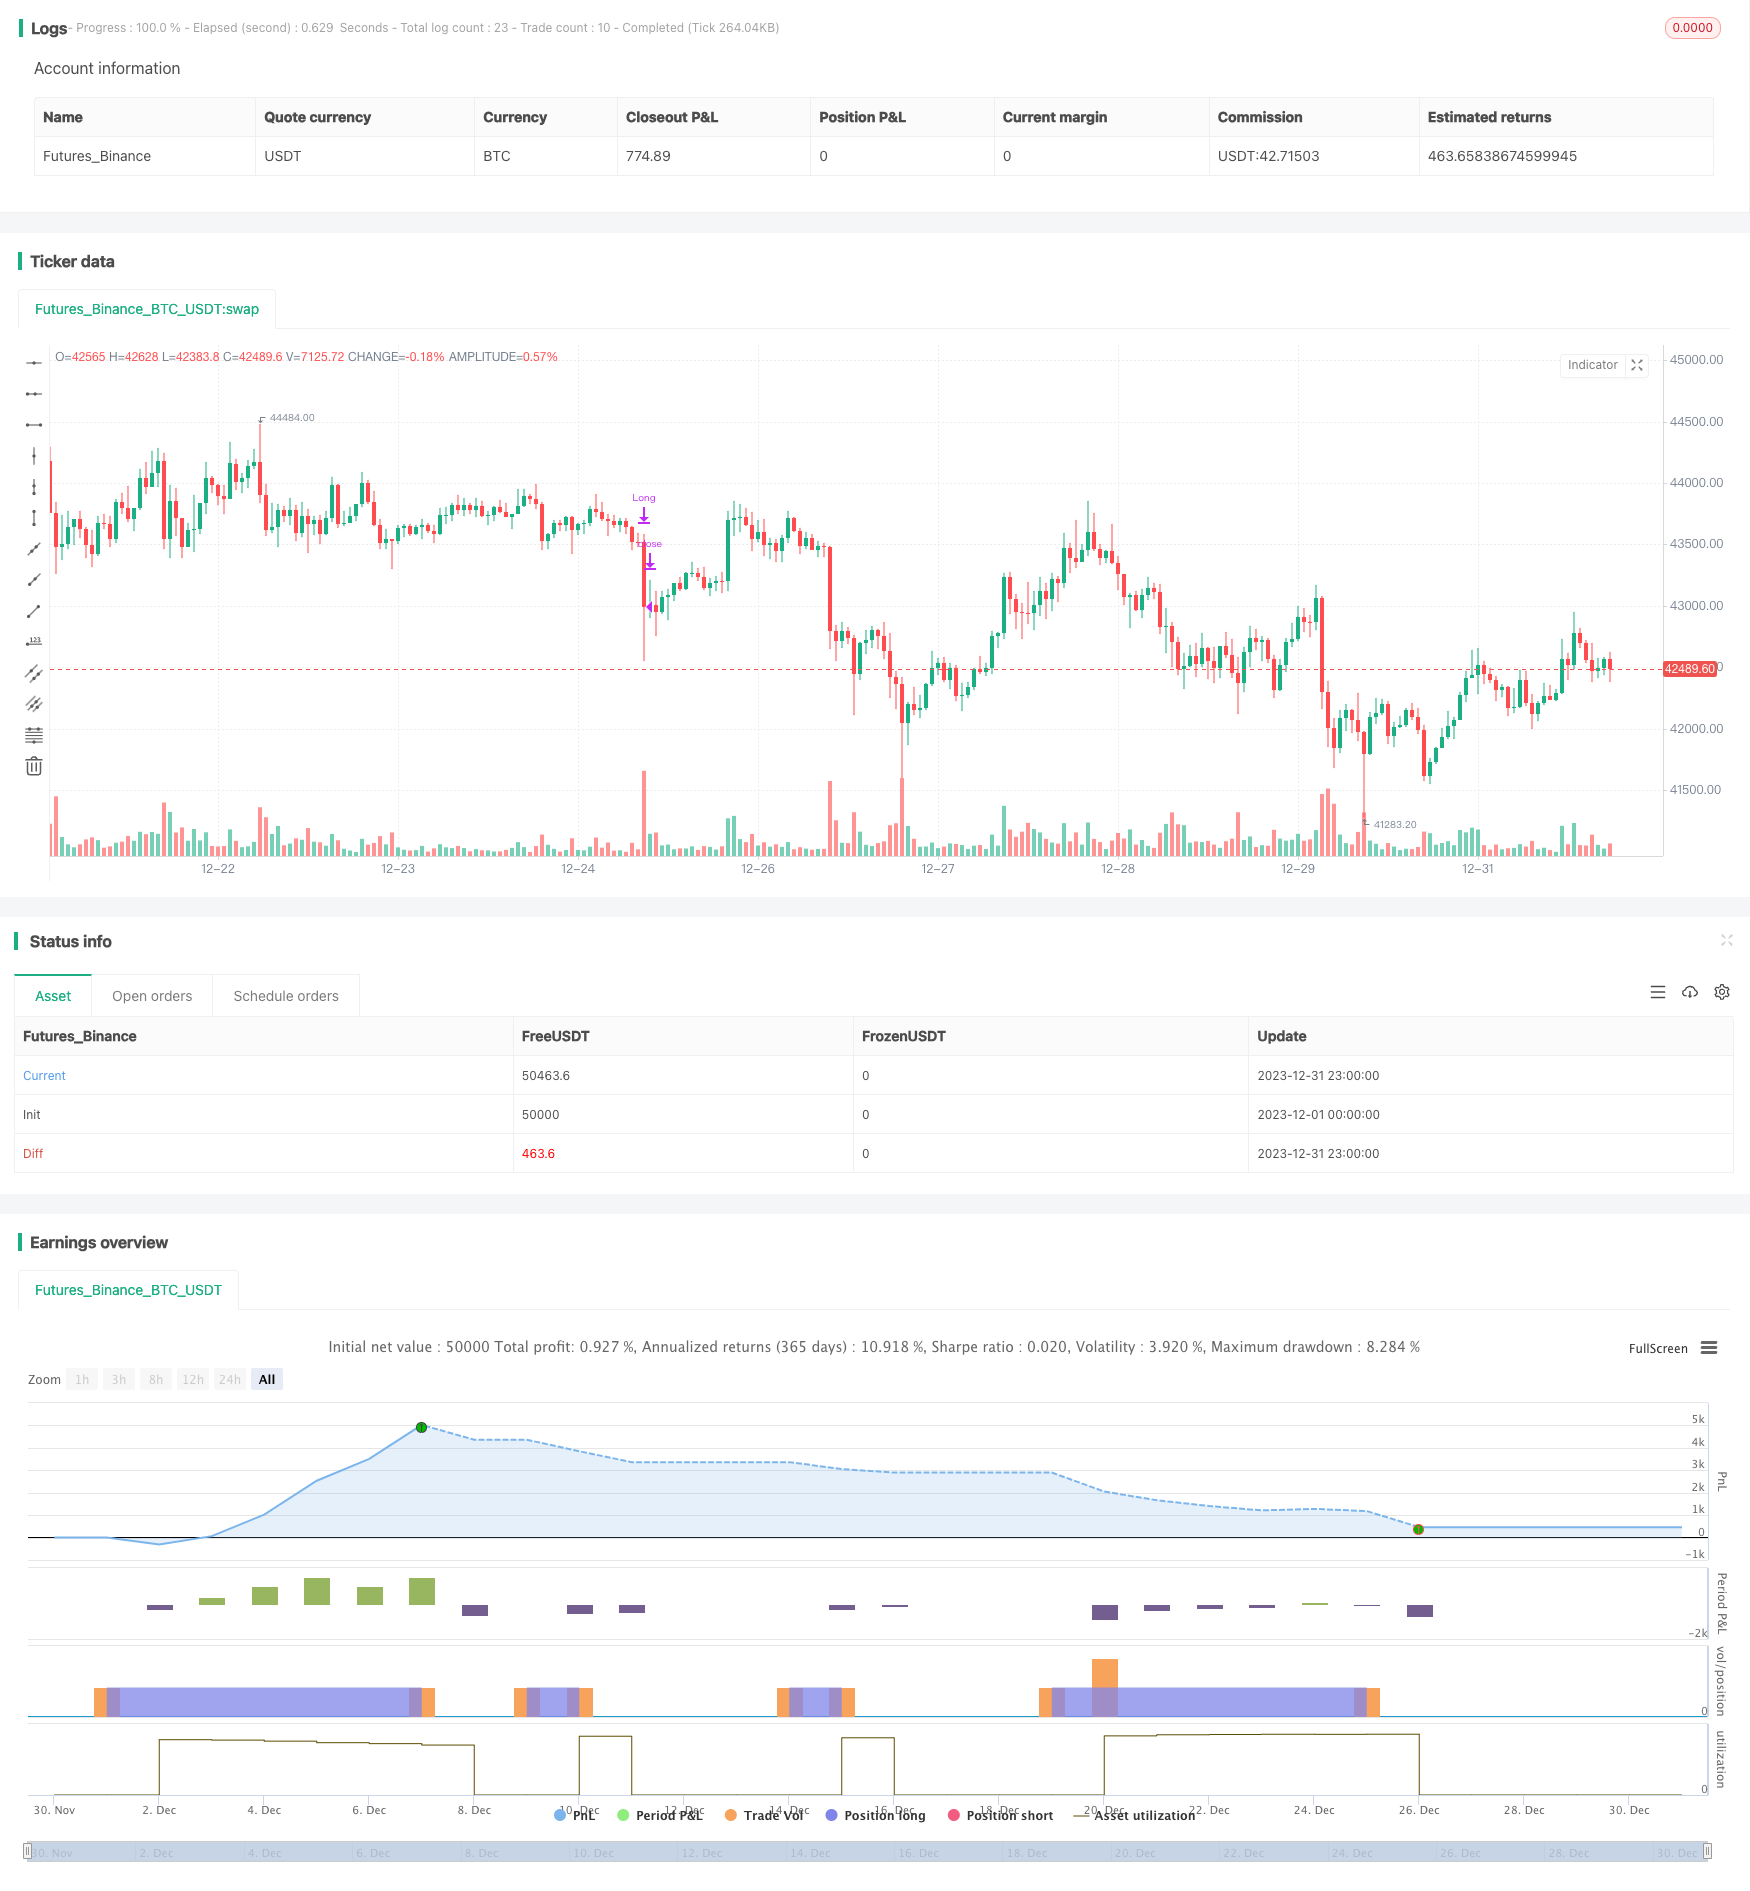
策略概述:该策略综合运用了超级趋势指标、相对强弱指标(RSI)和指数移动平均线(EMA)来识别买入时机。只有当收盘价高于超级趋势线,RSI大于70并且价格高于9日EMA时,才产生买入信号。
策略原理:
-
超级趋势指标用于判断价格趋势和超买超卖区域。当价格高于超级趋势时为上涨趋势,当价格低于超级趋势时为下跌趋势。
-
RSI指标判断价格是否进入超买或超卖状态。RSI大于70代表进入超买状态,小于30代表进入超卖状态。
-
EMA指标判断价格在上涨趋势时能否突破其短期均线。只有价格高于9日EMA时才具有突破信号意义。
-
本策略在超级趋势、RSI和EMA三个指标发出同步信号时,即认为具有较强的买入时机。这可以有效过滤掉一些假突破带来的噪音交易。
优势分析:
-
综合多个指标判断,可以有效过滤假突破交易,提高策略胜率。
-
同时考量趋势、强弱指标和均线指标,识别高概率买点的可能性较大。
-
相对简单的策略逻辑,容易理解实现,适合量化交易的算法化。
-
可根据不同市场调整参数,适应性较强。
风险分析:
-
单一的买入规则,没有考虑降低风险的止损机制。
-
没有卖出退出机制,需要人工止损止盈,增加操作风险。
-
指标参数设置不当可能错过买入时机或者产生错误信号。
-
需要对参数组合进行大量回测实验,找到最优参数。
优化方向:
-
增加止损止盈机制,让策略退出亏损交易,自动止盈。
-
优化指标参数,找到最佳参数组合。可以考虑遗传算法、网格搜索等方法。
-
增加卖出信号判断,形成完整的决策系统。卖出信号可以结合Volatility Stop等方法。
-
可以考虑加入机器学习模型,利用LSTM、RNN等进行特征提取,提高决策的准确性。
-
将策略容器化,利用Kubernetes进行弹性扩展,提高策略的并行化程度。
总结:本策略综合运用超级趋势、RSI和EMA多种指标判断,在三者发出同步信号时产生买入,可以有效过滤假突破带来的噪音,提高决策准确率。但策略可以进一步优化,增加止损机制,找出最优参数,增加卖出机制等,从而构建一个更加完整和优化的量化交易系统。
||
Strategy Overview: This strategy combines the SuperTrend indicator, Relative Strength Index (RSI) and Exponential Moving Average (EMA) to identify buy signals. It generates buy signals only when the close price is above the SuperTrend line, RSI is greater than 70 and the price is above the 9-day EMA.
Strategy Logic:
-
SuperTrend indicator is used to determine the price trend and overbought/oversold areas. Price above SuperTrend suggests an uptrend while price below SuperTrend suggests a downtrend.
-
RSI indicates whether the price has entered overbought or oversold status. RSI above 70 represents an overbought state while below 30 is oversold.
-
EMA checks if the price can break through its short-term moving average during an uptrend. Only when price is higher than the 9-day EMA, it has a breakthrough signal meaning.
-
This strategy believes there is a stronger buy signal when SuperTrend, RSI and EMA indicators give synchronized signals. This can effectively filter out some false breakthrough noise trades.
Advantage Analysis:
-
Integrating multiple indicators can effectively filter out false breakthrough trades and improve strategy win rate.
-
Considering trend, strength index and moving average indicators together can identify high probability buy points.
-
Relatively simple strategy logic, easy to understand and implement, suitable for algorithmic trading.
-
Parameters can be adjusted for different markets, better adaptability.
Risk Analysis:
-
Single buy rule without considering stop loss to reduce risk.
-
No sell exit mechanism requires manual stop loss tracking, increasing operation risk.
-
Improper parameter settings may miss buy opportunities or generate wrong signals.
-
Massive backtesting experiments needed to find optimum parameters.
Optimization:
-
Add stop loss and take profit to exit loss trades and lock in profits automatically.
-
Optimize parameters to find best combination, using methods like grid search and genetic algorithms.
-
Add sell signals to build a complete system. Sell signals can combine Volatility Stop methods.
-
Consider machine learning models like LSTM and RNN for feature extraction and improve accuracy.
-
Containerize strategy for cloud-native scaling on Kubernetes to improve parallelization.
Conclusion: This strategy combines SuperTrend, RSI and EMA indicators for buying decisions when all three give synchronized signals, which can filter out false signals effectively and improve accuracy. But it can be further optimized by adding stop loss, finding optimum parameters, adding exit rules etc to build a more complete and optimized trading system.
[/trans]
Strategy Arguments
| Argument | Default | Description |
|---|---|---|
| v_input_int_1 | 10 | ATR Length |
| v_input_float_1 | 3 | Factor |
| v_input_int_2 | 14 | RSI Length |
Source (PineScript)
/*backtest
start: 2023-12-01 00:00:00
end: 2023-12-31 23:59:59
period: 1h
basePeriod: 15m
exchanges: [{"eid":"Futures_Binance","currency":"BTC_USDT"}]
*/

//@version=5
strategy("Supertrend, RSI, and EMA Strategy", overlay=true)

// Supertrend Indicator
atrPeriod = input.int(10, "ATR Length", minval=1)
factor = input.float(3.0, "Factor", minval=0.01, step=0.01)
[supertrend, direction] = ta.supertrend(factor, atrPeriod)

// RSI Indicator
rsiLength = input.int(14, "RSI Length")
rsi = ta.rsi(close, rsiLength)

// EMA Indicator
emaLength = 9
ema = ta.ema(close, emaLength)

// Entry Conditions
longCondition1 = close > supertrend and rsi > 70
longCondition2 = close > ema

// Combined Entry Condition
longCondition = longCondition1 and longCondition2
if (longCondition)
    strategy.entry("Long", strategy.long)

// Exit Condition
exitCondition = close < supertrend
if (exitCondition)
    strategy.close("Long")
Detail
https://www.fmz.com/strategy/440553
Last Modified
2024-01-31 16:16:11
