Name
超趋动量波动双重指标择时策略Quadratic-Momentum-Double-Indicators-Timing-Strategy
Author
ChaoZhang
Strategy Description
该策略融合了超趋动指标和艾略特波浪理论,构建了一个稳健的技术交易工具。它采用多层次的趋势分析来提供更全面的市场视角,可以 Early Capture 市场的潜在趋势反转和重要的价格变动。
核心思想在于其多层次的方法:
- 采用 4 个超趋动指标,每个指标使用不同的 ATR 长度和乘数,从短期到长期对趋势进行判断
- 通过指标的融合,可以找出稳健的做多做空信号
- 参考艾略特波浪的模式识别方法,识别类似的市场行为模式,确认交易信号
这样,既利用了多个指标,又增加了模式识别,使策略更稳健。
- 多指标设计,提供全方位判断
- 波浪理论启发,模式识别增加稳定性
- 实时调整方向,适应市场变化
- 参数可配置,适用于不同品种和时间周期
- 参数设置依赖经验,需要调整确定最佳参数组合
- 多指标设计较复杂,增加计算负载
- 无法完全回避错误信号的产生
可以通过参数优化,逐步确定最优参数;采用云计算提高计算性能;设置止损以控制风险。
可以从以下几个方面进行优化:
- 增加自适应参数调整模块,根据市场情况动态调整参数
- 增加机器学习模型,辅助判断交易信号可靠性
- 结合情绪指标、新闻事件等外部因素判断市场模式
- 支持多品种参数模板,减少测试工作量
这将使策略参数更加智能化,判断更加准确,实际应用更加方便。
该策略综合考虑了趋势、模式两个维度,既保证判断的稳健性,又增加策略的灵活性。多指标和参数设置保证了全市场适用性。如果进一步引入智能化、自动化的方法,将大大增强策略的实战水平。它为技术交易的发展提供了有益的启发和借鉴。
||
This strategy fuses the SuperTrend indicator with Elliott Wave theory to build a robust technical trading tool. It employs multi-level trend analysis to provide a more comprehensive market perspective that can early capture potential trend reversals and significant price moves.
The core idea lies in its multi-tiered approach:
- Use 4 SuperTrend indicators, each with different ATR lengths and multipliers, to judge the trend from short to long term
- Pinpoint robust long and short signals through indicator convergence
- Refer to Elliott Wave's pattern recognition method to identify similar market behaviors to confirm trade signals
Thus, it utilizes multiple indicators and adds pattern recognition to make the strategy more robust.
- Multi-indicator design provides comprehensive judgment
- Wave theory inspiration increases stability through pattern recognition
- Real-time direction adjustment adapts to market changes
- Configurable parameters suit different products and time frames
- Parameter setting relies on experience, requiring tuning to determine optimal parameter combinations
- Multi-indicator design is complex, increasing computational load
- Cannot completely avoid incorrect signal generation
Parameters can be optimized to gradually determine the optimum; cloud computing can improve computational performance; stop losses can control risk.
Optimizations can be made in several aspects:
- Add adaptive parameter adjustment module to dynamically tune parameters based on market conditions
- Incorporate machine learning models to aid in judging signal reliability
- Combine sentiment indicators, news events etc. to determine market regimes
- Support multi-product parameter templates to reduce testing workload
This will make strategy parameters more intelligent, judgments more accurate, and practical application more convenient.
The strategy comprehensively considers both trend and pattern dimensions, ensuring judgment robustness while increasing flexibility. Multi-indicators and parameter settings ensure full market applicability. With further incorporation of intelligent and automated methods, strategy practicality can be greatly enhanced. It provides valuable inspiration and reference for the advancement of technical trading.
[/trans]
Strategy Arguments
| Argument | Default | Description |
|---|---|---|
| v_input_string_1 | 0 | Select Trading Direction: Both |
| v_input_1 | 7 | ATR Length for SuperTrend 1 |
| v_input_2 | 4 | Multiplier for SuperTrend 1 |
| v_input_3 | 14 | ATR Length for SuperTrend 2 |
| v_input_4 | 3.618 | Multiplier for SuperTrend 2 |
| v_input_5 | 21 | ATR Length for SuperTrend 3 |
| v_input_6 | 3.5 | Multiplier for SuperTrend 3 |
| v_input_7 | 28 | ATR Length for SuperTrend 3 |
| v_input_8 | 3.382 | Multiplier for SuperTrend 3 |
Source (PineScript)
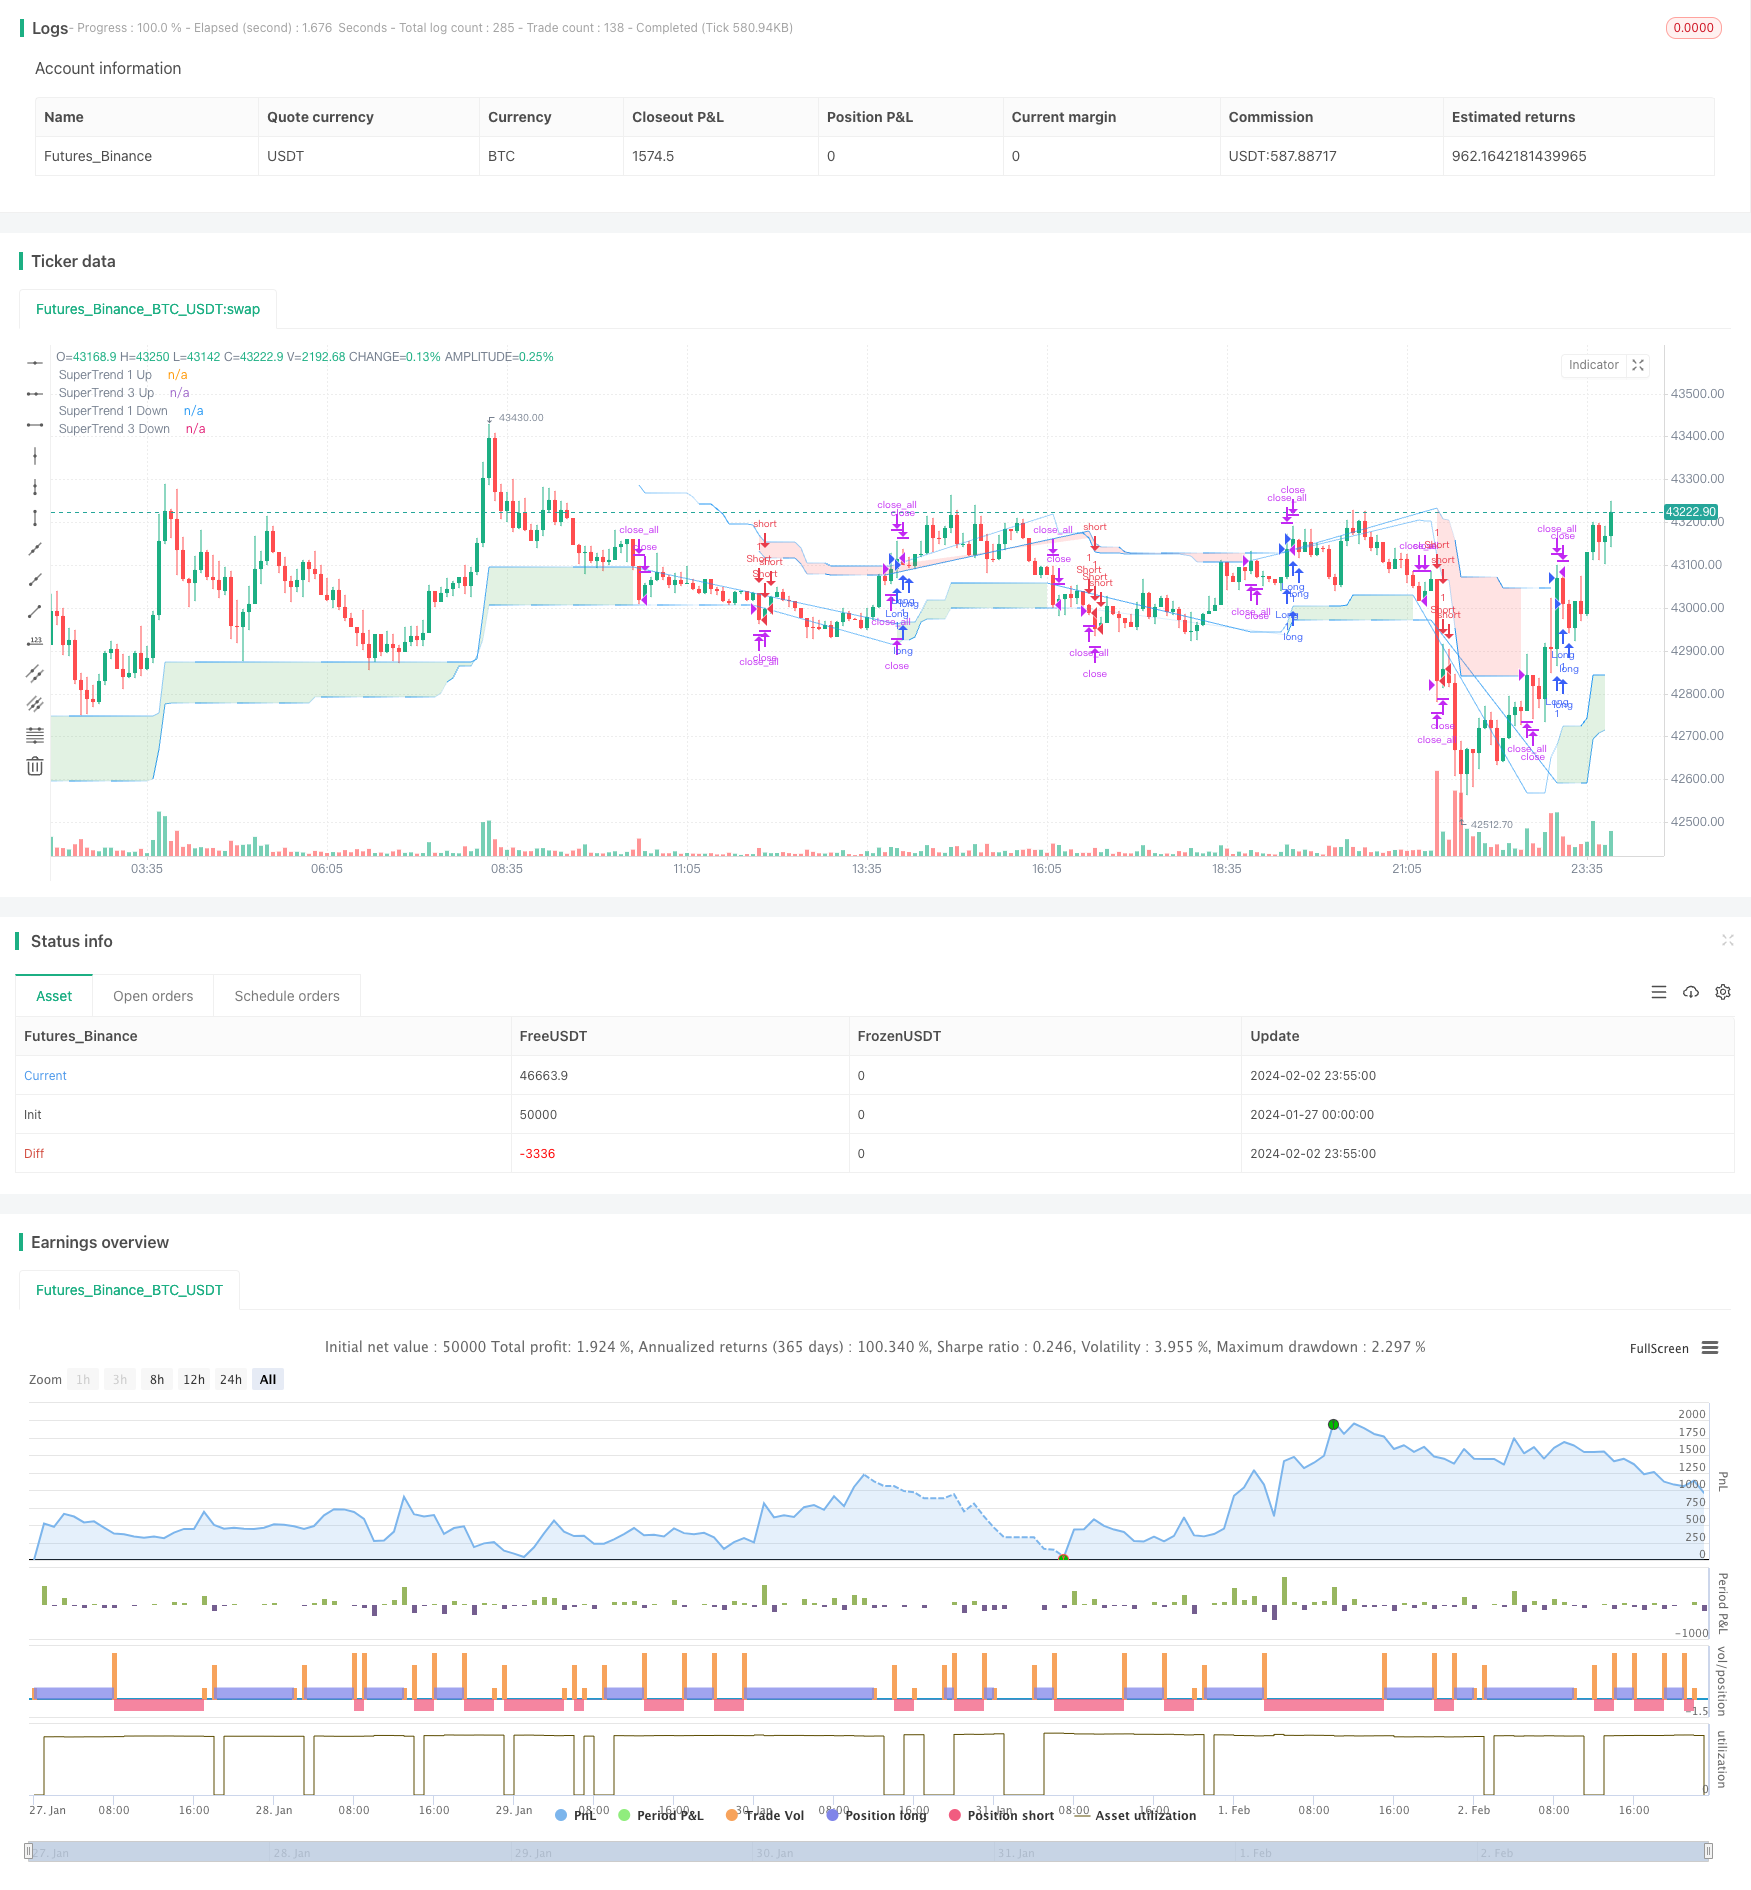
/*backtest
start: 2024-01-27 00:00:00
end: 2024-02-03 00:00:00
period: 5m
basePeriod: 1m
exchanges: [{"eid":"Futures_Binance","currency":"BTC_USDT"}]
*/

//@version=5
strategy("Elliott's Quadratic Momentum - Strategy [presentTrading]",shorttitle = "EQM Strategy [presentTrading]", overlay=true )

// Inputs for selecting trading direction
tradingDirection = input.string("Both", "Select Trading Direction", options=["Long", "Short", "Both"])


// SuperTrend Function
supertrend(src, atrLength, multiplier) =>
    atr = ta.atr(atrLength)
    up = hl2 - (multiplier * atr)
    dn = hl2 + (multiplier * atr)
    trend = 1
    trend := nz(trend[1], 1)
    up := src > nz(up[1], 0) and src[1] > nz(up[1], 0) ?   math.max(up, nz(up[1], 0)) : up
    dn := src < nz(dn[1], 0) and src[1] < nz(dn[1], 0) ? math.min(dn, nz(dn[1], 0)) : dn
    trend := src > nz(dn[1], 0) ?  1 : src < nz(up[1], 0)? -1 : nz(trend[1], 1)
    [up, dn, trend]

// Inputs for SuperTrend settings
atrLength1 = input(7, title="ATR Length for SuperTrend 1")
multiplier1 = input(4.0, title="Multiplier for SuperTrend 1")
atrLength2 = input(14, title="ATR Length for SuperTrend 2")
multiplier2 = input(3.618, title="Multiplier for SuperTrend 2")
atrLength3 = input(21, title="ATR Length for SuperTrend 3")
multiplier3 = input(3.5, title="Multiplier for SuperTrend 3")
atrLength4 = input(28, title="ATR Length for SuperTrend 3")
multiplier4 = input(3.382, title="Multiplier for SuperTrend 3")

// Calculate SuperTrend
[up1, dn1, trend1] = supertrend(close, atrLength1, multiplier1)
[up2, dn2, trend2] = supertrend(close, atrLength2, multiplier2)
[up3, dn3, trend3] = supertrend(close, atrLength3, multiplier3)
[up4, dn4, trend4] = supertrend(close, atrLength4, multiplier4)


// Entry Conditions based on SuperTrend and Elliott Wave-like patterns
longCondition = trend1 == 1 and trend2 == 1 and trend3 == 1 and trend4 == 1
shortCondition = trend1 == -1 and trend2 == -1 and trend3 == -1 and trend4 == - 1

// Strategy Entry logic based on selected trading direction
if tradingDirection == "Long" or tradingDirection == "Both"
    if longCondition
        strategy.entry("Long", strategy.long)
        // [Any additional logic for long entry]

if tradingDirection == "Short" or tradingDirection == "Both"
    if shortCondition
        strategy.entry("Short", strategy.short)
        // [Any additional logic for short entry]


// Exit conditions - Define your own exit strategy
// Example: Exit when any SuperTrend flips
if trend1 != trend1[1] or trend2 != trend2[1] or trend3 != trend3[1] or trend4 != trend4[1]
    strategy.close_all()

// Function to apply gradient effect
gradientColor(baseColor, length, currentBar) =>
    var color res = color.new(baseColor, 100)
    if currentBar <= length
        res := color.new(baseColor, int(100 * currentBar / length))
    res

// Apply gradient effect
color1 = gradientColor(color.blue, atrLength1, bar_index % atrLength1)
color4 = gradientColor(color.blue, atrLength4, bar_index % atrLength3)


// Plot SuperTrend with gradient for upward trend
plot1Up = plot(trend1 == 1 ? up1 : na, color=color1, linewidth=1, title="SuperTrend 1 Up")
plot4Up = plot(trend4 == 1 ? up4 : na, color=color4, linewidth=1, title="SuperTrend 3 Up")

// Plot SuperTrend with gradient for downward trend
plot1Down = plot(trend1 == -1 ? dn1 : na, color=color1, linewidth=1, title="SuperTrend 1 Down")
plot4Down = plot(trend4 == -1 ? dn4 : na, color=color4, linewidth=1, title="SuperTrend 3 Down")

// Filling the area between the first and third SuperTrend lines for upward trend
fill(plot1Up, plot4Up, color=color.new(color.green, 80), title="SuperTrend Upward Band")

// Filling the area between the first and third SuperTrend lines for downward trend
fill(plot1Down, plot4Down, color=color.new(color.red, 80), title="SuperTrend Downward Band")
Detail
https://www.fmz.com/strategy/440998
Last Modified
2024-02-04 15:53:48