Name
超趋势MACD量化策略Supertrend-MACD-Quantitative-Strategy
Author
ChaoZhang
Strategy Description
该策略综合利用了超趋势指标和MACD指标的潜在趋势反转信号,配合RSI指标的超买超卖信号,形成了一个较为稳定和高效的开仓及平仓信号体系。策略名称为“超趋势MACD量化策略”。
该策略的核心逻辑在于综合利用超趋势指标和MACD指标作为开仓信号的判定标准。
超趋势部分,策略采用超趋势指标的方向改变作为潜在反转信号。当超趋势指标方向从上转向下时产生买入信号;当超趋势指标方向从下转向上时产生卖出信号。
MACD部分,策略采用MACD指标在较低时间框架(日线)上的斜率和零轴交叉来判断潜在反转机会。当MACD斜率绝对值较大(大于阈值)且斜率保持同向上升时产生信号;如果MACD指标交叉零轴时也会产生辅助信号。MACD部分信号较超趋势部分更加平滑。
在开仓信号上,策略要求超趋势信号和MACD信号保持一致方向才会发出开仓指令。
此外,在平仓部分策略还引入了RSI指标的超买超卖信号。当RSI指标大于80时产生卖出信号,小于20时产生买入信号,来辅助判断反转时机。
该策略最大的优势在于指标信号的多样性。不同指标之间可以形成互补,使整体信号更加平稳和可靠。
超趋势指标的反转信号可以捕捉比较有力的短期趋势;MACD斜率可以判断中长期趋势力度,避免被假反转误导;而RSI则可以在区间震荡行情中提示超买超卖的最佳开仓和平仓时机。多个指标信号的叠加,可以过滤掉一些噪声交易,取得更高的胜率。
此外,策略的时间框架设定也较为合理。超趋势采用小时级时间框架, MACD指标采用日线,这样既保证了交易频率,也兼顾了趋势判断的稳定性。
该策略的主要风险在于指标之间产生混淆信号的概率较大。比如超趋势产生假反转,而MACD信号并未同步产生。这时就可能导致不必要的亏损。
此外,RSI指标用于判断平仓的时机也可能会过早或过晚,使得策略的持仓时间无法获得最大化。
最后,MACD指标的斜率阈值设置过大也会导致错过较弱的反转机会。
该策略可以从以下几个方面进行进一步优化:
-
引入止损机制。当亏损超过一定比例时止损。
-
对MACD斜率的判断加入动态阈值。当市场波动较大时提高斜率阈值,市场稳定时降低阈值。
-
对于RSI指标平仓判断加入回调条件。即RSI超过80后要求有一次明显回调再考虑平仓。
-
Testing MACD with volume and see if it improves signal reliability
-
Trying automated parameter tuning to find optimal settings
“超趋势MACD量化策略”综合多个指标提供开仓和平仓信号。其优点是信号稳定,胜率较高,通过参数优化还可进一步提升。风险和优化方向也主要集中在参数设定 overfitting 的问题上。整体而言,该策略具有很强的实战应用价值。
||
This strategy combines the potential trend reversal signals from the Supertrend indicator and MACD indicator, together with the overbought/oversold signals from RSI indicator, to form a relatively stable and efficient system for entry and exit signals. The strategy name is “Supertrend MACD Quantitative Strategy”.
The core logic of this strategy lies in the combined use of Supertrend indicator and MACD indicator as criteria for entry signals.
On the Supertrend part, the strategy adopts the direction change of Supertrend indicator as the potential reversal signal. When Supertrend direction turns from up to down, a buy signal is generated. When the direction turns from down to up, a sell signal is generated.
On the MACD part, the strategy uses the slope and zero line crossover of MACD indicator on lower timeframe (daily) to identify potential reversal opportunities. When MACD slope absolute value is large (above threshold) and the slope maintains upward trend, a signal is generated. If MACD line crosses zero line, an auxiliary signal is generated. MACD signals are usually more smooth than Supertrend ones.
For entry signals, the strategy requires Supertrend signal and MACD signal to be in the same direction before sending out trading orders.
In addition, for exit signals, the strategy also adopts the overbought/oversold signals from RSI indicator. When RSI goes above 80, a sell signal is generated. When RSI drops below 20, a buy signal is generated. These help determine reversal timing.
The biggest advantage of this strategy is the diversity of indicator signals. Different indicators can complement each other and make the overall signal more steady and reliable.
Supertrend reversal signals can capture relatively strong short-term trends; MACD slope can judge mid-long term trend strength to avoid being misguided by false reversals; RSI can provide the best entry and exit timing in range-bound market by indicating overbought/oversold levels. Stacking signals from multiple indicators can filter out some noisy trades and achieve higher win rate.
In addition, the timeframe design is also reasonable. Supertrend uses hourly timeframe while MACD uses daily timeframe. This ensures both trading frequency and stability in trend judgment.
The main risk of this strategy is the high probability of confusing signals between different indicators. For example, Supertrend may give false reversal while MACD signal does not synchronize. This could lead to unnecessary losses.
In addition, RSI for determining exit timing can also be too early or too late, preventing maximum holding period.
Finally, oversized MACD slope threshold may also miss weaker reversal opportunities.
This strategy can be further optimized from the following aspects:
-
Introduce stop loss mechanism. Stop loss when loss exceeds certain percentage.
-
Add dynamic threshold for MACD slope judgment. Raise slope threshold when market volatility is high, and lower threshold when market is stable.
-
Add pullback condition for RSI exit judgment. Require a significant callback after RSI exceeds 80 before considering closing position.
-
Testing MACD with volume and see if it improves signal reliability
-
Trying automated parameter tuning to find optimal settings
The “Supertrend MACD Quantitative Strategy” combines signals from multiple indicators to provide entry and exit signals. Its advantages lie in stable signals and relatively high win rate. Further improvements can be achieved through parameter optimization. Risks and optimization directions mainly center around parameter overfitting issues. Overall, this strategy has strong practical value for live trading.
[/trans]
Strategy Arguments
| Argument | Default | Description |
|---|---|---|
| v_input_1 | 10 | Supertrend ATR Length |
| v_input_float_1 | 2 | Supertrend Factor |
| v_input_2 | 12 | MACD Fast Length |
| v_input_3 | 26 | MACD Slow Length |
| v_input_4 | 9 | MACD Signal Length |
| v_input_timeframe_1 | D | MACD Timeframe |
| v_input_5 | 7 | MACD Slope Lookback - Open |
| v_input_6 | 3 | MACD Slope Lookback - Close |
| v_input_float_2 | 0.75 | MACD Slope Open Threshold |
| v_input_7 | 14 | RSI Period |
Source (PineScript)
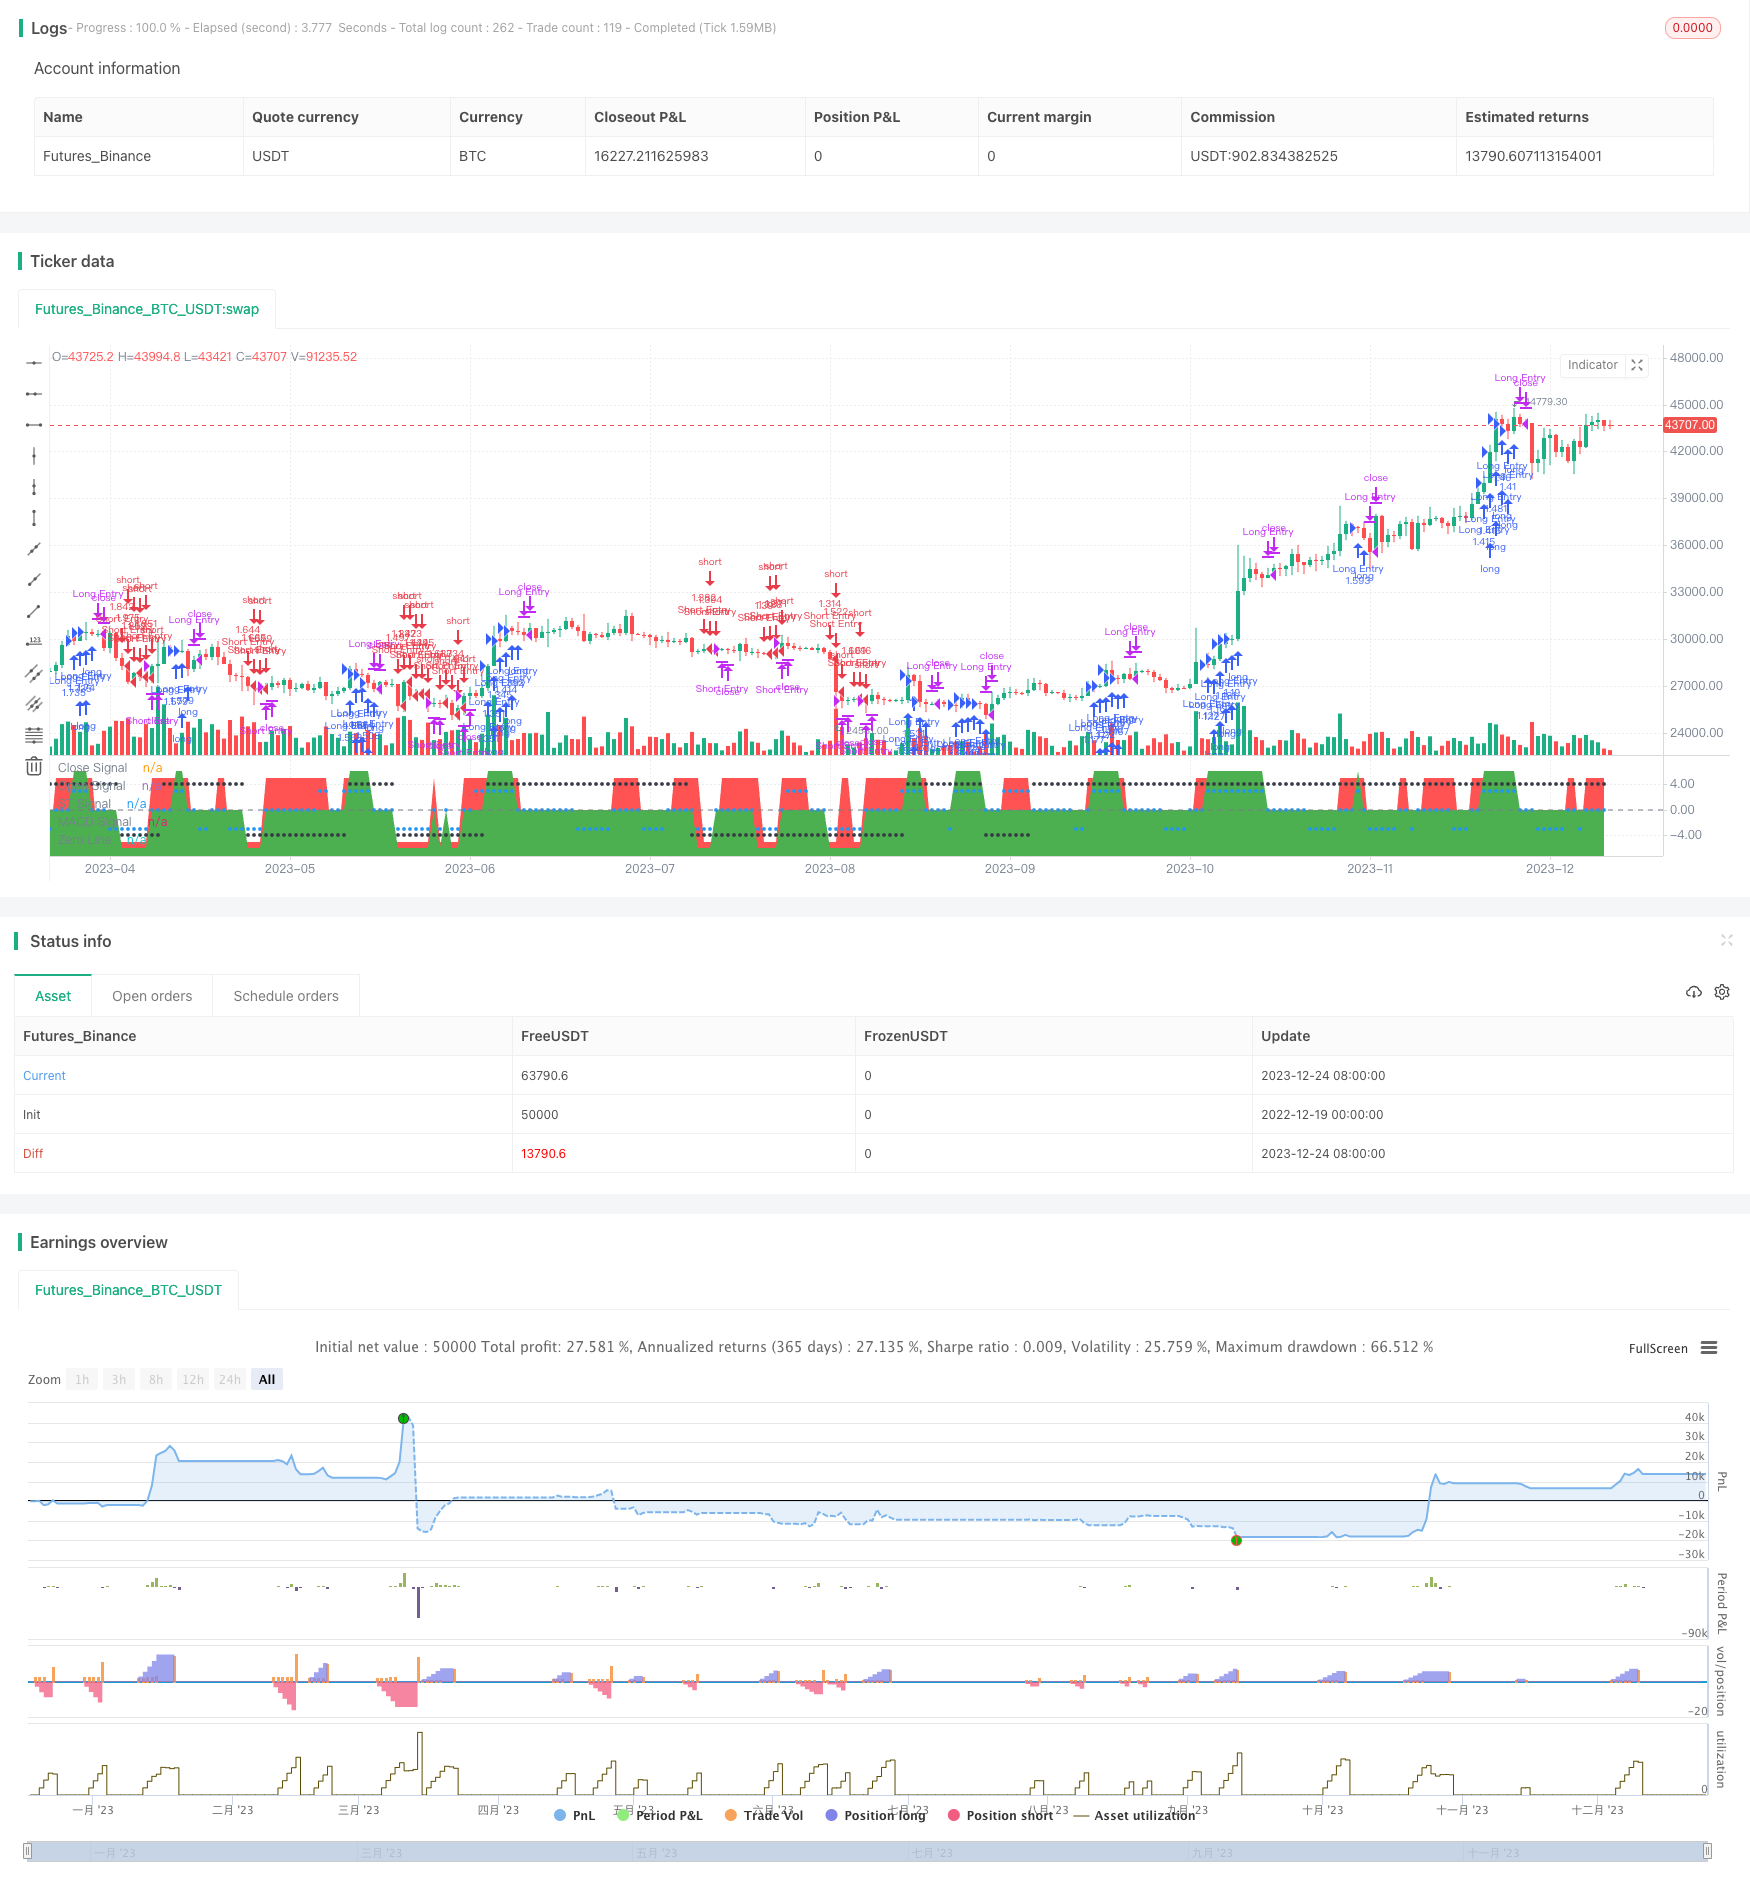
/*backtest
start: 2022-12-19 00:00:00
end: 2023-12-25 00:00:00
period: 1d
basePeriod: 1h
exchanges: [{"eid":"Futures_Binance","currency":"BTC_USDT"}]
*/

//@version=5

strategy("SuperTrend.MACD Strategy", overlay=false, default_qty_type=strategy.percent_of_equity, default_qty_value=100, initial_capital=100000, pyramiding=5, process_orders_on_close=true)

// ---------------- Utility Functions ----------------
getArrayValue(float[] arr, int ago) =>
    if ago >= 0
        array.get(arr, ago >= array.size(arr) ? na: array.size(arr) + -1 * ago -1)
    else
        na

filterNA(float[] a, s, int y) =>
    int x = 0
    if not na(s[0])
        array.push(a, s[0])
        if array.size(a) > y
            array.shift(a)
    a

pine_rsi(float[] x, int y) =>
    x0 = getArrayValue(x, 0)
    x1 = getArrayValue(x, 1)

    u = math.max(x0 - x1, 0) // upward ta.change
    d = math.max(x1 - x0, 0) // downward ta.change
    rs = ta.rma(u, y) / ta.rma(d, y)
    res = 100 - 100 / (1 + rs)
    res

turnAround(float[] arr) =>
    int isTurnAround = 0

    now = getArrayValue(arr, 0)
    p1 = getArrayValue(arr, 1)
    p2 = getArrayValue(arr, 2)

    if p1 > now and p1 > p2
        isTurnAround := -1
    else if p1 < now and p1 < p2
        isTurnAround := 1

intergerizeSignal(i) =>
    i>0 ? 1 : i<0 ? -1 : 0

linreg(float[] y, int n, int offset=0) =>
    float slope = na
    float intercept = na

    int endcursor = offset + n - 1

    if array.size(y) > endcursor
        float sumX = 0
        float sumX2 = 0
        float sumY = 0
        float sumY2 = 0
        float sumXY = 0

        for i=offset to endcursor
            yv = array.get(y, i)
            sumY += yv
            sumY2 += math.pow(yv, 2)
            sumX += i
            sumX2 += math.pow(i, 2)
            sumXY += i*yv

        // Pearson correlation coefficient
        r = (n * sumXY - sumX * sumY) / math.sqrt((n * sumY2 - math.pow(sumY, 2)) * (n * sumX2 - math.pow(sumX, 2)))

        // Coefficient of determination
        r2 = math.pow(r, 2)

        meanX = sumX / n
        meanY = sumY / n

        slope := (n * sumXY - sumX * sumY) / (n * sumX2 - math.pow(sumX, 2))
        intercept := meanY - slope * meanX

    [slope, intercept]

isStartOfDay() => dayofweek != dayofweek[1]

// ---------------- Variables ----------------

varip float st_signal = 0
varip float macd_signal = 0
varip float macd_close_signal = 0
varip float histo_signal = 0

var int openSignal = 0
var int closeSignal = 0

// -------------------------------- Supertrend Signal (Open) --------------------------------

// ST calculation
atrPeriod = input(10, "Supertrend ATR Length")
factor = input.float(2.0, "Supertrend Factor", step = 0.01)

[_, direction] = ta.supertrend(factor, atrPeriod)

st_direction_change = ta.change(direction)
if st_direction_change < 0
    st_signal := 4
if st_direction_change > 0
    st_signal := -4

// -------------------------------- MACD Signal (Open + Close) --------------------------------

// MACD Calculation
fastLength = input(12, title="MACD Fast Length")
slowLength = input(26, title="MACD Slow Length")
signalLength = input(9, title="MACD Signal Length")
macdSlowTimeframe = input.timeframe("D", "MACD Timeframe")
macdSlopeLookbackOpen = input(7, title="MACD Slope Lookback - Open")
macdSlopeLookbackClose = input(3, title="MACD Slope Lookback - Close")

dailyClose = request.security(syminfo.tickerid, macdSlowTimeframe, close, barmerge.gaps_on)
[macdLine, signalLine, _] = ta.macd(dailyClose, fastLength, slowLength, signalLength)

// MACD Slope calculation

varip macdHistory = array.new<float>(0)
varip macdSlowSlopeArr = array.new<float>(0)
varip float macdSlowSlope = na
varip float macdCloseSlope = na

if not na(macdLine[0])
    array.push(macdHistory, macdLine[0])
    if array.size(macdHistory) > macdSlopeLookbackOpen
        array.shift(macdHistory)
    [s1, _] = linreg(macdHistory, macdSlopeLookbackOpen)
    macdSlowSlope := s1

    array.push(macdSlowSlopeArr, macdSlowSlope)
    if array.size(macdSlowSlopeArr) > macdSlopeLookbackClose
        array.shift(macdSlowSlopeArr)
    [s2, _] = linreg(macdSlowSlopeArr, macdSlopeLookbackClose)
    macdCloseSlope := s2

// MACD Signal Calculation
// > open signal
threshold_macdSlowSlope = input.float(0.75, "MACD Slope Open Threshold", step = 0.05)

macdSlowSlopeOverThreshold = math.abs(macdSlowSlope) >= threshold_macdSlowSlope
macdSlowSlopeTrend = macdSlowSlope - getArrayValue(macdSlowSlopeArr, 1)
macdSlowSlopeTrendConfirm = macdSlowSlope*macdSlowSlopeTrend >0

if (macdSlowSlopeOverThreshold and macdSlowSlopeTrendConfirm)
    macd_signal := 3*macdSlowSlope/math.abs(macdSlowSlope)
else
    macd_signal := 0

// > close signal
int macdCloseSignal = 0
macdCloseSignal := intergerizeSignal(macdCloseSlope)

// Histogram signal Calculation
histSlow = macdLine - signalLine

if (ta.crossover(histSlow, 0))
	histo_signal := 2
if (ta.crossunder(histSlow, 0))
	histo_signal := -2

// -------------------------------- RSI Signal (Close) --------------------------------
int rsiCloseSignal = 0
varip float rsiSlow = na

rsiPeriod = input(14, title="RSI Period")

varip dailyCloseRSIFilter = array.new_float()

// rewrite pine_rsi to remove NaN value from series at calculation
dailyCloseRSIFilter := filterNA(dailyCloseRSIFilter, dailyClose, rsiPeriod)

if not na(dailyClose[0])
    rsiSlow := pine_rsi(dailyCloseRSIFilter, rsiPeriod)

if rsiSlow > 80
    rsiCloseSignal := -1
else if rsiSlow < 20
    rsiCloseSignal := 1
else
    rsiCloseSignal := 0

// -------------------------------- Overall Signal --------------------------------

// Close signal
closeSignals = array.from(macdCloseSignal, rsiCloseSignal)
closeSignal := array.includes(closeSignals, 1) ? 1 : array.includes(closeSignals, -1) ? -1 : 0
closeSignal := closeSignal * 5

// Open signal
if (macd_signal * st_signal > 0) and (macd_signal * macd_close_signal >= 0)
    openSignal := intergerizeSignal(st_signal)
    openSignal := openSignal * 6
else
    openSignal := 0

// -------------------------------- Order --------------------------------
// if strategy.position_size == 0
if openSignal * closeSignal >=0
    if openSignal > 0
        strategy.entry("Long Entry", strategy.long)
    else if openSignal < 0
        strategy.entry("Short Entry", strategy.short)

if strategy.position_size != 0
    if closeSignal < 0
        strategy.close("Long Entry")
    if closeSignal > 0
        strategy.close("Short Entry")


// -------------------------------- Plot --------------------------------

plot(closeSignal, title="Close Signal", color=color.red, linewidth = 1, style=plot.style_area)
plot(openSignal, title="Open Signal", color=color.green, linewidth = 1, style=plot.style_area)
plot(st_signal, title="ST Signal", color=color.black, linewidth = 1, style=plot.style_circles)
plot(macd_signal, title="MACD Signal", color=color.blue, linewidth = 1, style=plot.style_circles)
// plot(macdSlowSlope, title="macd slow slope", color=color.purple, linewidth = 1, style=plot.style_line)
// plot(macdCloseSlope, title="macd slow slope", color=color.lime, linewidth = 1, style=plot.style_line)

hline(0, "Zero Line", color=color.gray)
Detail
https://www.fmz.com/strategy/436607
Last Modified
2023-12-26 11:13:24