Name
逆转均值突破策略Reverse-Mean-Breakthrough-Strategy
Author
ChaoZhang
Strategy Description
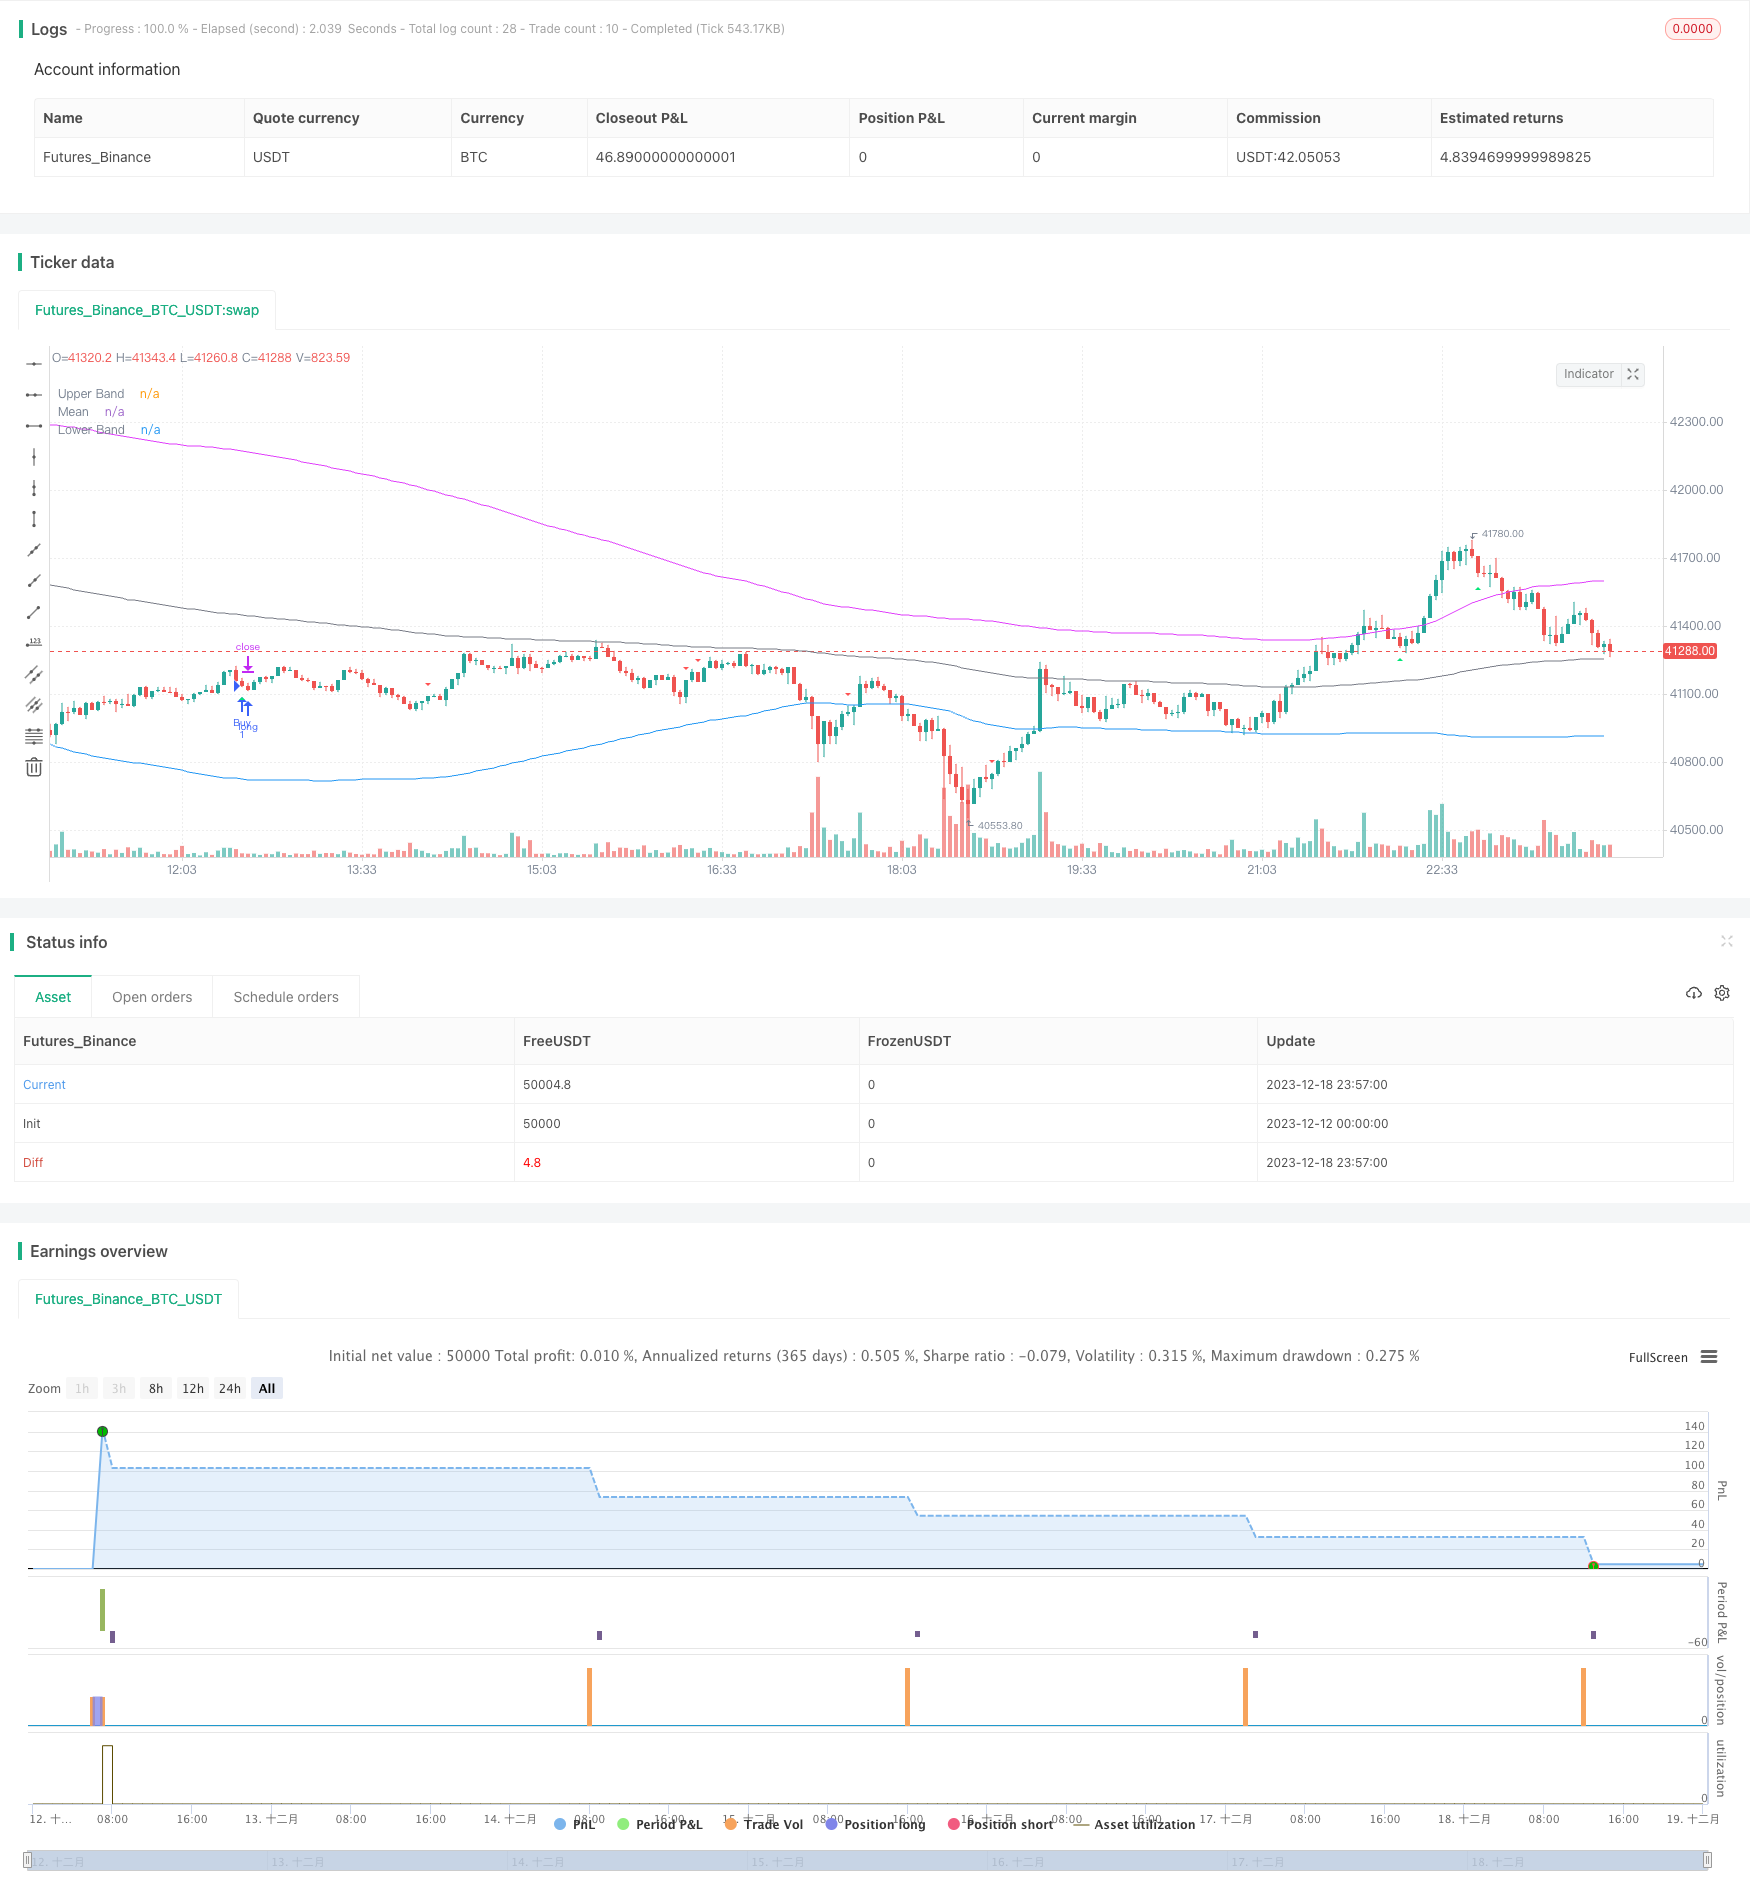
逆转均值突破策略是一种多因子组合的趋势反转策略。它结合了移动平均线、布林带、CCI指标、RSI指标等多种技术指标,旨在捕捉价格从超买超卖区域反转的机会。该策略同时结合了正则散度分析,可检测当前趋势与之前是否一致,从而避免交易假突破。
该策略的核心逻辑是,当价格从超买超卖区域反转时,采取适当做空做多。具体来说,策略从四个方面判断反转机会:
-
CCI指标或动量指标发出金叉死叉信号,判断超买超卖。
-
RSI指标判断是否处于超买超卖区域。规定RSI高于65为超买区,低于35为超卖区。
-
利用布林带上下轨,判断价格是否偏离常态区域。当价格重新进入常态区域,可能反转。
-
检测RSI指标的正则散度,避免追逐假突破。
满足上述条件时,策略会采取反方向入场。并设置止损位,控制风险。
该策略最大的优势在于组合多个指标判断反转机会,平均获胜率较高。具体来说,主要有以下几点:
-
多因子判断,可靠性较高。不会单纯依赖单一指标,减少了误判概率。
-
反转交易获胜概率大。趋势反转是一种较为可靠的交易方式。
-
检测散度,避免追逐假突破,减少系统性风险。
-
止损机制控制风险。可以最大限度避免单笔损失过大。
该策略也存在一些风险,主要集中在以下几点:
-
反转时间点判断不准。导致止损被触发。可适当扩大止损范围。
-
布林带参数设置不当,将正常价格当成异常。应该配合市场波动率设置参数。
-
交易次数可能较多。适当扩大CCI等判断参数范围,减少交易频率。
-
多空平衡可能差异大。应根据历史数据判断指标参数是否合理。
该策略可从以下几个方向进行优化:
-
利用机器学习算法自动优化指标参数。避免人工经验误差。
-
增加页岩指标、幅度指标等判断超买超卖强度。
-
增加交易量指标判断反转可靠性。例如成交量,持仓 Daten 等。
-
结合区块链数据判断市场情绪面。提高策略的适应性。
-
引入自适应止损机制。根据市场波动率变化调整止损位。
逆转均值突破策略综合运用多种指标判断反转机会。在控制风险的前提下,其获胜概率较大。该策略有很强的实用性,也有进一步优化的空间。如果参数设置得当,应能获得较为理想的效果。
||
The Reverse Mean Breakthrough Strategy is a multi-factor trend reversal strategy. It combines moving average, Bollinger Bands, CCI, RSI and other technical indicators to capture price reversal opportunities from overbought and oversold areas. The strategy also incorporates regular divergence analysis to detect inconsistencies between current and previous trends, thus avoiding false breakouts.
The core logic of this strategy is to take appropriate short or long positions when prices reverse from overbought or oversold zones. Specifically, the strategy judges reversal opportunities from four aspects:
-
CCI indicator or momentum indicator issues golden cross dead cross signals to determine overbought or oversold status.
-
RSI indicator judges whether it is in overbought or oversold zone. Overbought above 65 and oversold below 35.
-
Use Bollinger Bands upper and lower rail to determine if price deviates from normal range. Prices may reverse when return to normal range.
-
Detect regular divergence of RSI indicator to avoid chasing false breakouts.
When the above conditions are met, the strategy will take reverse direction entry. And set stop loss to control risk.
The biggest advantage of this strategy is that it combines multiple indicators to determine reversal opportunities with relatively high winning rate. Specifically:
-
Reliability is higher by using multiple factors. Avoid relying solely on single indicator thus reduce misjudgment.
-
Trend reversal has larger winning probability. It's a relatively reliable trading method.
-
Detecting divergence avoids chasing false breakout and reduces systemic risk.
-
Stop loss mechanism controls risk. Can minimize single ticket loss as much as possible.
There are also some risks with this strategy:
-
Judgment inaccuracies on reversal timing point. Stop loss can be triggered. Expand stop loss range appropriately.
-
Bollinger Bands parameters set inappropriately, takes normal price action as abnormal. Parameters should cater to market volatility.
-
Number of trades could be relatively high. Expand CCI etc. judgment range properly to reduce trading frequency.
-
Long short imbalance. Judge if parameters suit historical data.
The strategy can be optimized in the following aspects:
-
Use machine learning algorithms to automatically optimize parameters. Avoid artificial empirical errors.
-
Increase shale index, amplitude index etc. to determine overbought & oversold strength.
-
Add trading volume indicators to determine reversal reliability, e.g. volume, open interest etc.
-
Incorporate blockchain data to gauge market sentiment. Improve strategy adaptivity.
-
Introduce adaptive stop loss mechanism based on market volatility.
The reverse mean breakthrough strategy integrates multiple indicators to determine reversal trades. With proper risk control, it has relatively large winning rate. The strategy is practical with room for further optimization. With proper parameter tuning, it should yield fairly ideal results.
[/trans]
Strategy Arguments
| Argument | Default | Description |
|---|---|---|
| v_input_int_1 | 10 | Stop Loss (in Pips) |
| v_input_string_1 | 0 | Entry Signal Source: CCI |
| v_input_int_2 | 10 | CCI/Momentum Length |
| v_input_bool_1 | false | Find Regular Bullish/Bearish Divergence |
| v_input_int_3 | 65 | RSI Overbought Level |
| v_input_int_4 | 35 | RSI Oversold Level |
| v_input_int_5 | 14 | RSI Length |
| v_input_bool_2 | true | Plot Mean Reversion Bands on the chart |
| v_input_1 | 200 | Lookback Period (EMA) |
| v_input_float_1 | 1.6 | Outer Bands Multiplier |
Source (PineScript)
/*backtest
start: 2023-12-12 00:00:00
end: 2023-12-19 00:00:00
period: 3m
basePeriod: 1m
exchanges: [{"eid":"Futures_Binance","currency":"BTC_USDT"}]
*/

//@version=5
strategy(title='BroTheJo Strategy', shorttitle='BTJ INV', overlay=true)

// Input settings
stopLossInPips = input.int(10, minval=0, title='Stop Loss (in Pips)')
ccimomCross = input.string('CCI', 'Entry Signal Source', options=['CCI', 'Momentum'])
ccimomLength = input.int(10, minval=1, title='CCI/Momentum Length')
useDivergence = input.bool(false, title='Find Regular Bullish/Bearish Divergence')
rsiOverbought = input.int(65, minval=1, title='RSI Overbought Level')
rsiOversold = input.int(35, minval=1, title='RSI Oversold Level')
rsiLength = input.int(14, minval=1, title='RSI Length')
plotMeanReversion = input.bool(true, 'Plot Mean Reversion Bands on the chart')
emaPeriod = input(200, title='Lookback Period (EMA)')
bandMultiplier = input.float(1.6, title='Outer Bands Multiplier')

// CCI and Momentum calculation
momLength = ccimomCross == 'Momentum' ? ccimomLength : 10
mom = close - close[momLength]
cci = ta.cci(close, ccimomLength)
ccimomCrossUp = ccimomCross == 'Momentum' ? ta.cross(mom, 0) : ta.cross(cci, 0)
ccimomCrossDown = ccimomCross == 'Momentum' ? ta.cross(0, mom) : ta.cross(0, cci)

// RSI calculation
src = close
up = ta.rma(math.max(ta.change(src), 0), rsiLength)
down = ta.rma(-math.min(ta.change(src), 0), rsiLength)
rsi = down == 0 ? 100 : up == 0 ? 0 : 100 - 100 / (1 + up / down)
oversoldAgo = rsi[0] <= rsiOversold or rsi[1] <= rsiOversold or rsi[2] <= rsiOversold or rsi[3] <= rsiOversold
overboughtAgo = rsi[0] >= rsiOverbought or rsi[1] >= rsiOverbought or rsi[2] >= rsiOverbought or rsi[3] >= rsiOverbought

// Regular Divergence Conditions
bullishDivergenceCondition = rsi[0] > rsi[1] and rsi[1] < rsi[2]
bearishDivergenceCondition = rsi[0] < rsi[1] and rsi[1] > rsi[2]

// Mean Reversion Indicator
meanReversion = plotMeanReversion ? ta.ema(close, emaPeriod) : na
stdDev = plotMeanReversion ? ta.stdev(close, emaPeriod) : na
upperBand = plotMeanReversion ? meanReversion + stdDev * bandMultiplier : na
lowerBand = plotMeanReversion ? meanReversion - stdDev * bandMultiplier : na

// Entry Conditions
prevHigh = ta.highest(high, 1)
prevLow = ta.lowest(low, 1)
shortEntryCondition = ccimomCrossUp and oversoldAgo and (not useDivergence or bullishDivergenceCondition) and (prevHigh >= meanReversion) and (prevLow >= meanReversion)
longEntryCondition = ccimomCrossDown and overboughtAgo and (not useDivergence or bearishDivergenceCondition) and (prevHigh <= meanReversion) and (prevLow <= meanReversion)

// Plotting
oldShortEntryCondition = ccimomCrossUp and oversoldAgo and (not useDivergence or bullishDivergenceCondition)
oldLongEntryCondition = ccimomCrossDown and overboughtAgo and (not useDivergence or bearishDivergenceCondition)
plotshape(oldLongEntryCondition, title='BUY', style=shape.triangleup, text='B', location=location.belowbar, color=color.new(color.lime, 0), textcolor=color.new(color.white, 0), size=size.tiny)
plotshape(oldShortEntryCondition, title='SELL', style=shape.triangledown, text='S', location=location.abovebar, color=color.new(color.red, 0), textcolor=color.new(color.white, 0), size=size.tiny)

// Strategy logic
if (longEntryCondition)
    stopLoss = close - stopLossInPips
    strategy.entry("Buy", strategy.long)
    strategy.exit("exit", "Buy", stop=stopLoss)
if (shortEntryCondition)
    stopLoss = close + stopLossInPips
    strategy.entry("Sell", strategy.short)
    strategy.exit("exit", "Sell", stop=stopLoss)

// Close all open positions when outside of bands
closeAll = (high >= upperBand) or (low <= lowerBand)

if (closeAll)
    strategy.close_all("Take Profit/Cut Loss")

// Plotting
plot(upperBand, title='Upper Band', color=color.fuchsia, linewidth=1)
plot(meanReversion, title='Mean', color=color.gray, linewidth=1)
plot(lowerBand, title='Lower Band', color=color.blue, linewidth=1)
Detail
https://www.fmz.com/strategy/435969
Last Modified
2023-12-20 14:48:57