Name
量化交易双重指标策略Quantitative-Trading-Dual-Indicator-Strategy
Author
ChaoZhang
Strategy Description
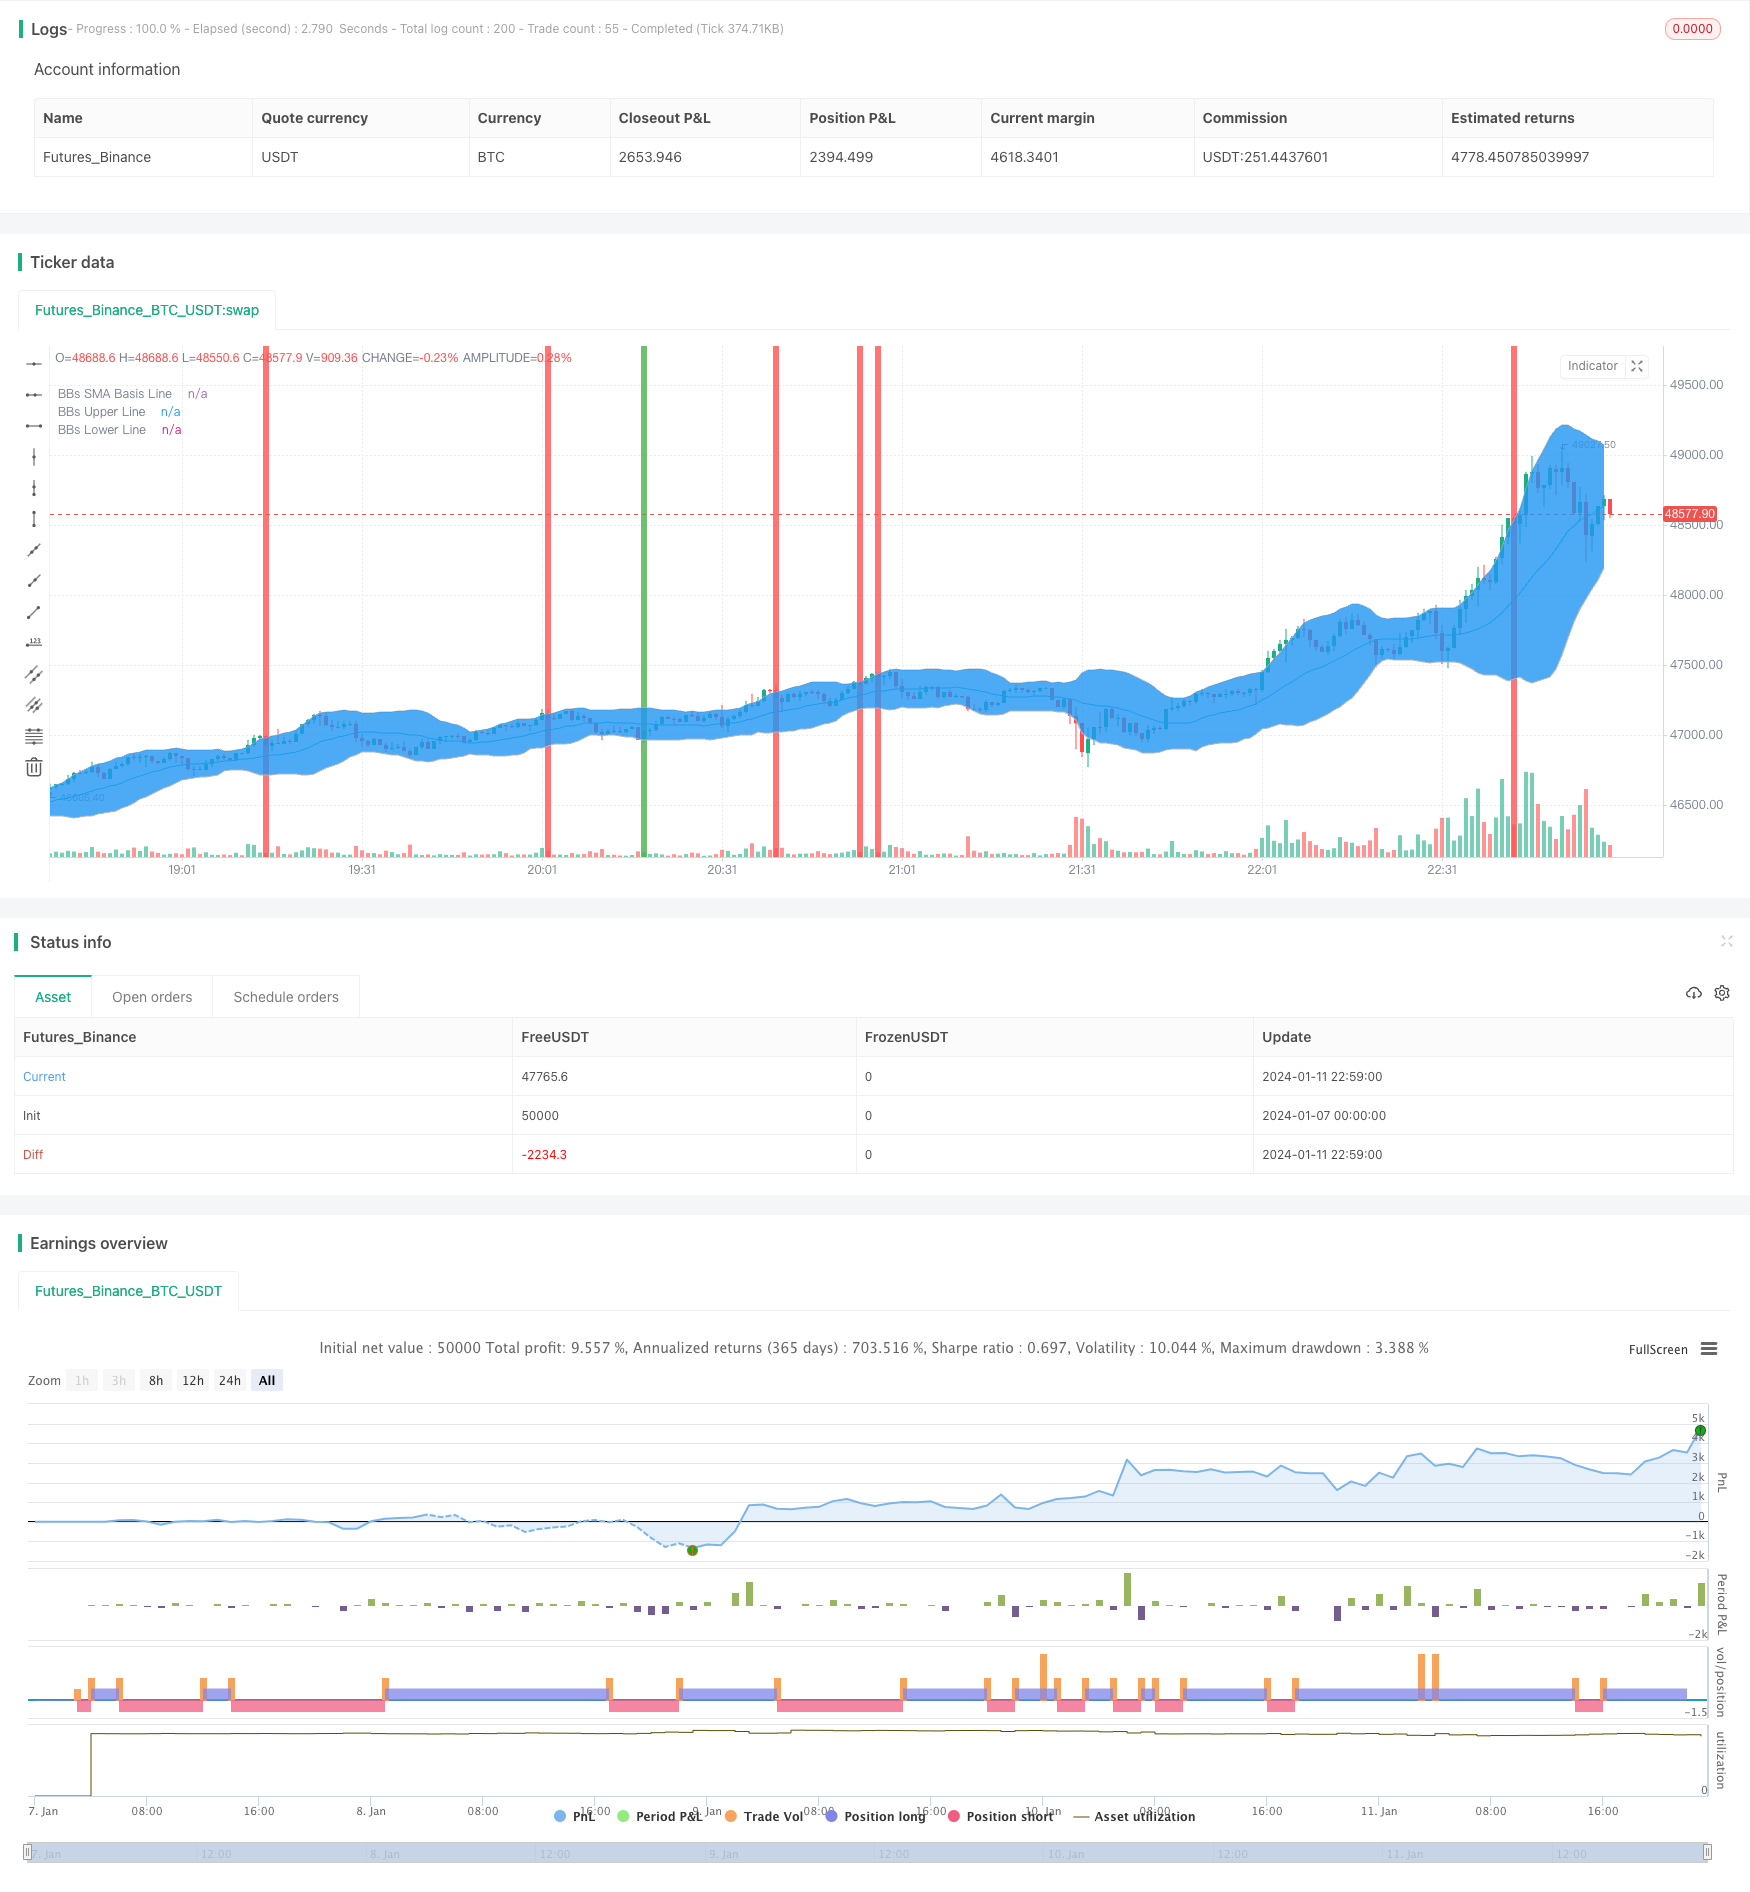
本策略名称为“量化交易双重指标策略”。该策略同时利用布林带指标和相对强弱指标两个指标作为交易信号,实现了一种双重指标过滤的交易策略。
本策略的核心逻辑是同时利用布林带和RSI两个指标判断市场的超买超卖情况,进行交易信号过滤。
具体来说,布林带的上轨和下轨可以判断价格是否处于波动范围之外,从而判断市场是否超买或超卖。相对强弱指标RSI则可以判断市场力量的强弱,RSI高于55时为超买信号,低于45时为超卖信号。
本策略设置为,仅当布林带指标和RSI指标同时显示超买或超卖信号时,才会进行相应的买入或卖出操作。这样可以过滤掉部分误导性信号,提高策略稳定性。
本策略最大的优势在于利用双重指标进行过滤,可以减少误导性交易,提高信号的可靠性。
相比单一布林带指标,双重指标策略可以大幅度降低假信号的概率。相比单一RSI指标,则可以利用布林带判断目前是否处于震荡区间之外,防止在震荡市场中产生错误信号。
整体来说,双重指标策略综合考虑了多种情况,适应性和稳定性都较好。
本策略的主要风险在于布林带参数设置和RSI参数设置都可能不当。如果布林带参数设置得过于敏感,容易产生多余信号;如果RSI参数设置得过于宽松,效果减弱。
此外,双重指标组合本身就意味着信号会更少。如果市场只符合一个指标的信号而另一个指标未达到触发水平,那么本策略就不会产生信号。因此相比单一指标策略,本策略的交易频率会更低。
解决方法主要有设置更加恰当的参数,修改RSI和布林带的触发水平等。如果交易频率过低,可以考虑降低参数要求,提高入场机会。
本策略可以从以下几个方向进行优化:
-
测试不同的布林带参数和RSI参数组合,寻找更匹配的组合。现有参数可能并不完全适合所有品种和时间段。
-
增加止损止盈策略,提高盈利结果。当前的策略没有这些方面的考虑。
-
增加仓位管理机制。使用动态仓位可以在走势好的时候加大头寸,在走势差时减少亏损。
-
增加基于历史数据的参数自适应功能。让指标参数可以自动优化,适应最新市况。
本策略作为一种双重指标过滤的策略,总体稳定性和适应性较好。它在降低假信号比例的同时,也降低了交易频率。通过优化指标参数和增加辅助功能,可以进一步增强策略的盈利空间。
||
The strategy is named "Quantitative Trading Dual Indicator Strategy". It utilizes both Bollinger Bands and the Relative Strength Index (RSI) as trading signals to implement a dual indicator filtered trading strategy.
The core logic of this strategy is to use both Bollinger Bands and RSI to judge overbought and oversold conditions in the market for trading signal filtering.
Specifically, Bollinger Bands upper and lower bands can determine if prices are outside the volatility range, thereby judging if the market is overbought or oversold. The Relative Strength Index (RSI) can judge the strength of market forces. RSI above 55 is an overbought signal, and below 45 an oversold signal.
The strategy is set so that buy or sell operations are only carried out when Bollinger Bands and RSI both display overbought or oversold signals at the same time. This filters out some misleading signals and improves the stability of the strategy.
The biggest advantage of this strategy is the use of dual indicators for filtering, which can reduce misleading trades and improve signal reliability.
Compared to a single Bollinger Bands indicator, the dual indicator strategy can greatly reduce the probability of false signals. Compared to a single RSI indicator, Bollinger Bands can be used to determine if it is currently outside the oscillation range to prevent wrong signals in an oscillating market.
Overall, the dual indicator strategy comprehensively considers multiple situations and has better adaptability and stability.
The main risk of this strategy is that the parameter settings of both Bollinger Bands and RSI may be inappropriate. If Bollinger Bands parameters are set to be too sensitive, it is prone to generate redundant signals. If RSI parameters are set too loose, the effect will be weakened.
In addition, the dual indicator combination itself means fewer signals. If the market only meets the signals of one indicator while the other has not reached the trigger level, this strategy will not generate any signals. Therefore, compared to single indicator strategies, the trading frequency of this strategy will be lower.
The solutions mainly include setting more appropriate parameters, modifying RSI and Bollinger Bands trigger levels, etc. If the trading frequency is too low, consider reducing parameter requirements to increase entry opportunities.
This strategy can be optimized in the following aspects:
-
Test different combinations of Bollinger Bands and RSI parameters to find better matches. Existing parameters may not be suitable for all products and time periods.
-
Add stop loss and take profit strategies to improve profitability. Currently there are no considerations in these regards.
-
Add position sizing mechanisms. Use dynamic position sizing to increase positions when the trend goes well, and reduce losses when the trend goes badly.
-
Add parameter self-adaptivity based on historical data. Allow indicator parameters to be automatically optimized to suit latest market conditions.
As a dual indicator filtered strategy, this strategy has good overall stability and adaptability. While reducing the proportion of false signals, it also reduces the trading frequency. By optimizing indicator parameters and adding auxiliary functions, the profit potential of the strategy can be further enhanced. [/trans]
Strategy Arguments
| Argument | Default | Description |
|---|---|---|
| v_input_1 | 20 | Bollinger Bands SMA Period Length |
| v_input_2 | 2 | Bollinger Bands Standard Deviation |
| v_input_3_close | 0 | Source: close |
| v_input_4 | 16 | RSI Period Length |
| v_input_5 | 45 | RSI Value Range |
| v_input_6 | true | Enable Bar Color? |
| v_input_7 | true | Enable Background Color? |
Source (PineScript)
/*backtest
start: 2024-01-07 00:00:00
end: 2024-01-11 23:00:00
period: 1m
basePeriod: 1m
exchanges: [{"eid":"Futures_Binance","currency":"BTC_USDT"}]
*/

//@version=2
strategy("Bollinger Bands + RSI, Double Strategy (by SlumdogTrader)", shorttitle="BolBand_RSI_Strat", overlay=true)

// SlumdogTrader's Bollinger Bands + RSI Double Strategy - Profit Trailer
//
// Version 1.0
// Script by SlumdogTrader on July Fri 13(!), 2018.
//
// This strategy uses a normalise Bollinger Bands + RSI.
//
// Bollinger Band triggers
// SELL - when the price is above the upper band.
// BUY - when the price is below the lower band.
//
// RSI triggers
// SELL - when the price is above 55.
// BUY - when the price is below 45.
//
// This simple strategy only triggers when
// both the BB and the RSI
// indicators, at the same time, are in
// a overbought or oversold condition.
//
// Visit my TradingView work at:
// https://www.tradingview.com/u/SlumdogTrader/
//
// Visit my website at:
// https://www.slumdogtrader.com
//

///////////// Bollinger Bands Settings
BBlength = input(20, minval=1,title="Bollinger Bands SMA Period Length")
BBmult = input(2.0, minval=0.001, maxval=50,title="Bollinger Bands Standard Deviation")
price = input(close, title="Source")
BBbasis = sma(price, BBlength)
BBdev = BBmult * stdev(price, BBlength)
BBupper = BBbasis + BBdev
BBlower = BBbasis - BBdev
source = close
buyEntry = crossover(source, BBlower)
sellEntry = crossunder(source, BBupper)
plot(BBbasis, color=aqua,title="BBs SMA Basis Line")
p1 = plot(BBupper, color=silver,title="BBs Upper Line")
p2 = plot(BBlower, color=silver,title="BBs Lower Line")
fill(p1, p2)

///////////// RSI Settings
RSIlength = input( 16 ,title="RSI Period Length")
RSIvalue = input( 45 ,title="RSI Value Range")
RSIoverSold = 0 + RSIvalue
RSIoverBought = 100 - RSIvalue
vrsi = rsi(price, RSIlength)


///////////// Colour Settings
switch1=input(true, title="Enable Bar Color?")
switch2=input(true, title="Enable Background Color?")
TrendColor = RSIoverBought and (price[1] > BBupper and price < BBupper) ? red : RSIoverSold and (price[1] < BBlower and price > BBlower)  ? green : na
barcolor(switch1?TrendColor:na)
bgcolor(switch2?TrendColor:na,transp=50)


///////////// RSI + Bollinger Bands Strategy
if (not na(vrsi))

    if (crossover(vrsi, RSIoverSold) and crossover(source, BBlower))
        strategy.entry("RSI_BB_L", strategy.long, stop=BBlower,  comment="RSI_BB_L")
    else
        strategy.cancel(id="RSI_BB_L")

    if (crossunder(vrsi, RSIoverBought) and crossunder(source, BBupper))
        strategy.entry("RSI_BB_S", strategy.short, stop=BBupper,  comment="RSI_BB_S")
    else
        strategy.cancel(id="RSI_BB_S")

//plot(strategy.equity, title="equity", color=red, linewidth=2, style=areabr)
Detail
https://www.fmz.com/strategy/438780
Last Modified
2024-01-15 12:18:53
