Name
量化趋势追踪策略Quantitative-Trend-Tracking-Strategy
Author
ChaoZhang
Strategy Description
该策略采用了布林带、RSI、ADX、MACD等多个指标对市场趋势进行判断,具有较强的趋势识别能力。当指标信号同时 bullish 时,采取追涨策略;当指标信号同时 bearish 时,平仓止损。
- 使用布林带判断价格是否处在布林带上轨或下轨附近,作为判定趋势是否形成的依据
- 结合RSI指标判断是否处于超买超卖区域,避免假突破
- 使用ADX判断趋势力度,只有在趋势力度较强时才发出信号
- 采用MACD判断短期和长期趋势一致性
- 结合日内时间段,只在指定交易时段交易
通过多指标组合判断,准确识别价格趋势,在趋势发生时及时追踪,实现超额收益。
该策略最大的优势在于指标组合判断较为全面和准确,能有效识别价格趋势,避免因单一指标造成的假信号。
具体来说,优势有:
- 布林带能判断价格波动范围和强弱程度
- RSI避免买进超买区域,卖出超卖区域
- ADX判断趋势力度,只跟随强势趋势
- MACD判断短长线一致性
- 限定交易时段,避免隔夜风险
通过指标组合判断,能最大程度减少假信号,增强策略稳定性。
该策略主要风险来自:
- 突发事件造成指标失效
- 震荡行情中产生大量假信号
针对风险1,由于依赖多个指标,能够一定程度上避免单一指标失效的问题,但仍需完善风控机制。
针对风险2,可适当调整参数,缩小交易区间,减少交易频率,降低风险。
该策略主要可优化的方向包括:
- 增加止损机制,如移动止损、时间止损、突破止损等,避免拉回过深
- 优化参数,调整指标参数组合,寻找最优参数
- 增加过滤条件,如成交量过滤,避免量小的假突破
- 结合更多指标,如KDJ、OBV等,提升信号准确性
- 采用机器学习方法自动优化参数
通过持续优化,不断提高策略参数健壮性,降低假信号概率。
该策略整体来说识别趋势信号能力较强,通过指标组合判断,能有效识别价格趋势,max|max|
但是也存在一定风险,需要不断完善风控机制,持续优化参数,才能长期稳定运作。如果后期能引入机器学习等方法实现参数自动优化,将大大增强策略的鲁棒性和收益能力。
||
This strategy adopts multiple indicators such as Bollinger Bands, RSI, ADX, MACD to judge market trends and has strong trend identification capability. It takes trend following strategy when indicator signals are bullish simultaneously. It closes positions to stop loss when indicator signals are bearish simultaneously.
- Use Bollinger Bands to judge whether price is near upper or lower rail to determine whether a trend is formed
- Combine with RSI indicator to avoid overbought and oversold areas to prevent false breakouts
- Use ADX to determine trend strength and only signal when trend strength is strong
- Adopt MACD to judge consistency of short-term and long-term trends
- Limit to trading sessions to avoid overnight risks
Through the combination judgement of multiple indicators, it can accurately identify price trends and timely track them when trend occurs to achieve excess returns.
The biggest advantage of this strategy is that the indicator combination judgement is more comprehensive and accurate, which can effectively identify price trends and avoid false signals caused by single indicators.
Specifically, the advantages are:
- Bollinger Bands can determine price fluctuation range and strength
- RSI avoids buying in overbought areas and selling in oversold areas
- ADX determines trend strength, only follows strong trends
- MACD judges consistency of short and long term
- Limits trading sessions to avoid overnight risks
Through indicator combination judgement, it can maximize reduce false signals and enhance stability of the strategy.
The main risks of this strategy come from:
- Market events causing indicator failure
- Frequent false signals in range-bound markets
For risk 1, reliance on multiple indicators can mitigate the problem of single indicator failure to some extent, but risk management mechanisms still need to be improved.
For risk 2, parameters can be adjusted appropriately to narrow trading range and reduce trading frequency to mitigate risks.
The main optimizable aspects of this strategy include:
- Add stop loss mechanisms such as trailing stop loss, time stop loss, breakout stop loss, etc. to avoid pulling back too deep
- Optimize parameters, adjust indicator parameters combination to find optimum
- Add filters such as volume filter to avoid false breakouts in low volume
- Incorporate more indicators like KDJ, OBV to improve signal accuracy
- Adopt machine learning methods to auto-optimize parameters
By continuous optimization, continuously improve parameter robustness and reduce probabilities of false signals.
Overall this strategy has relatively strong capability of identifying trend signals through indicator combination judgements which can effectively identify price trends.
But it also has certain risks, risk management and parameter optimization needs to be continuously improved for steady long-term operations. If methods like machine learning can be introduced later to achieve auto-optimization of parameters, it will greatly enhance robustness and profitability of the strategy.
[/trans]
Strategy Arguments
| Argument | Default | Description |
|---|---|---|
| v_input_1 | 0930-1500 | Trading Session |
| v_input_2_high | 0 | Bollinger Band Source: high |
| v_input_3 | 3 | Bollinger Band Length |
| v_input_4 | 4.989 | Bollinger Band Std Dev |
| v_input_5_close | 0 | RSI Source: close |
| v_input_6 | 16 | RSI Length |
| v_input_7 | 39.2 | RSI Comparator |
| v_input_8 | 14 | ADX Length |
| v_input_9 | 14 | ADX Comparator |
| v_input_10_high | 0 | MACD Source: high |
| v_input_11 | 12 | MACD Fast |
| v_input_12 | 20 | MACD Slow |
| v_input_13 | 15 | MACD Signal |
Source (PineScript)
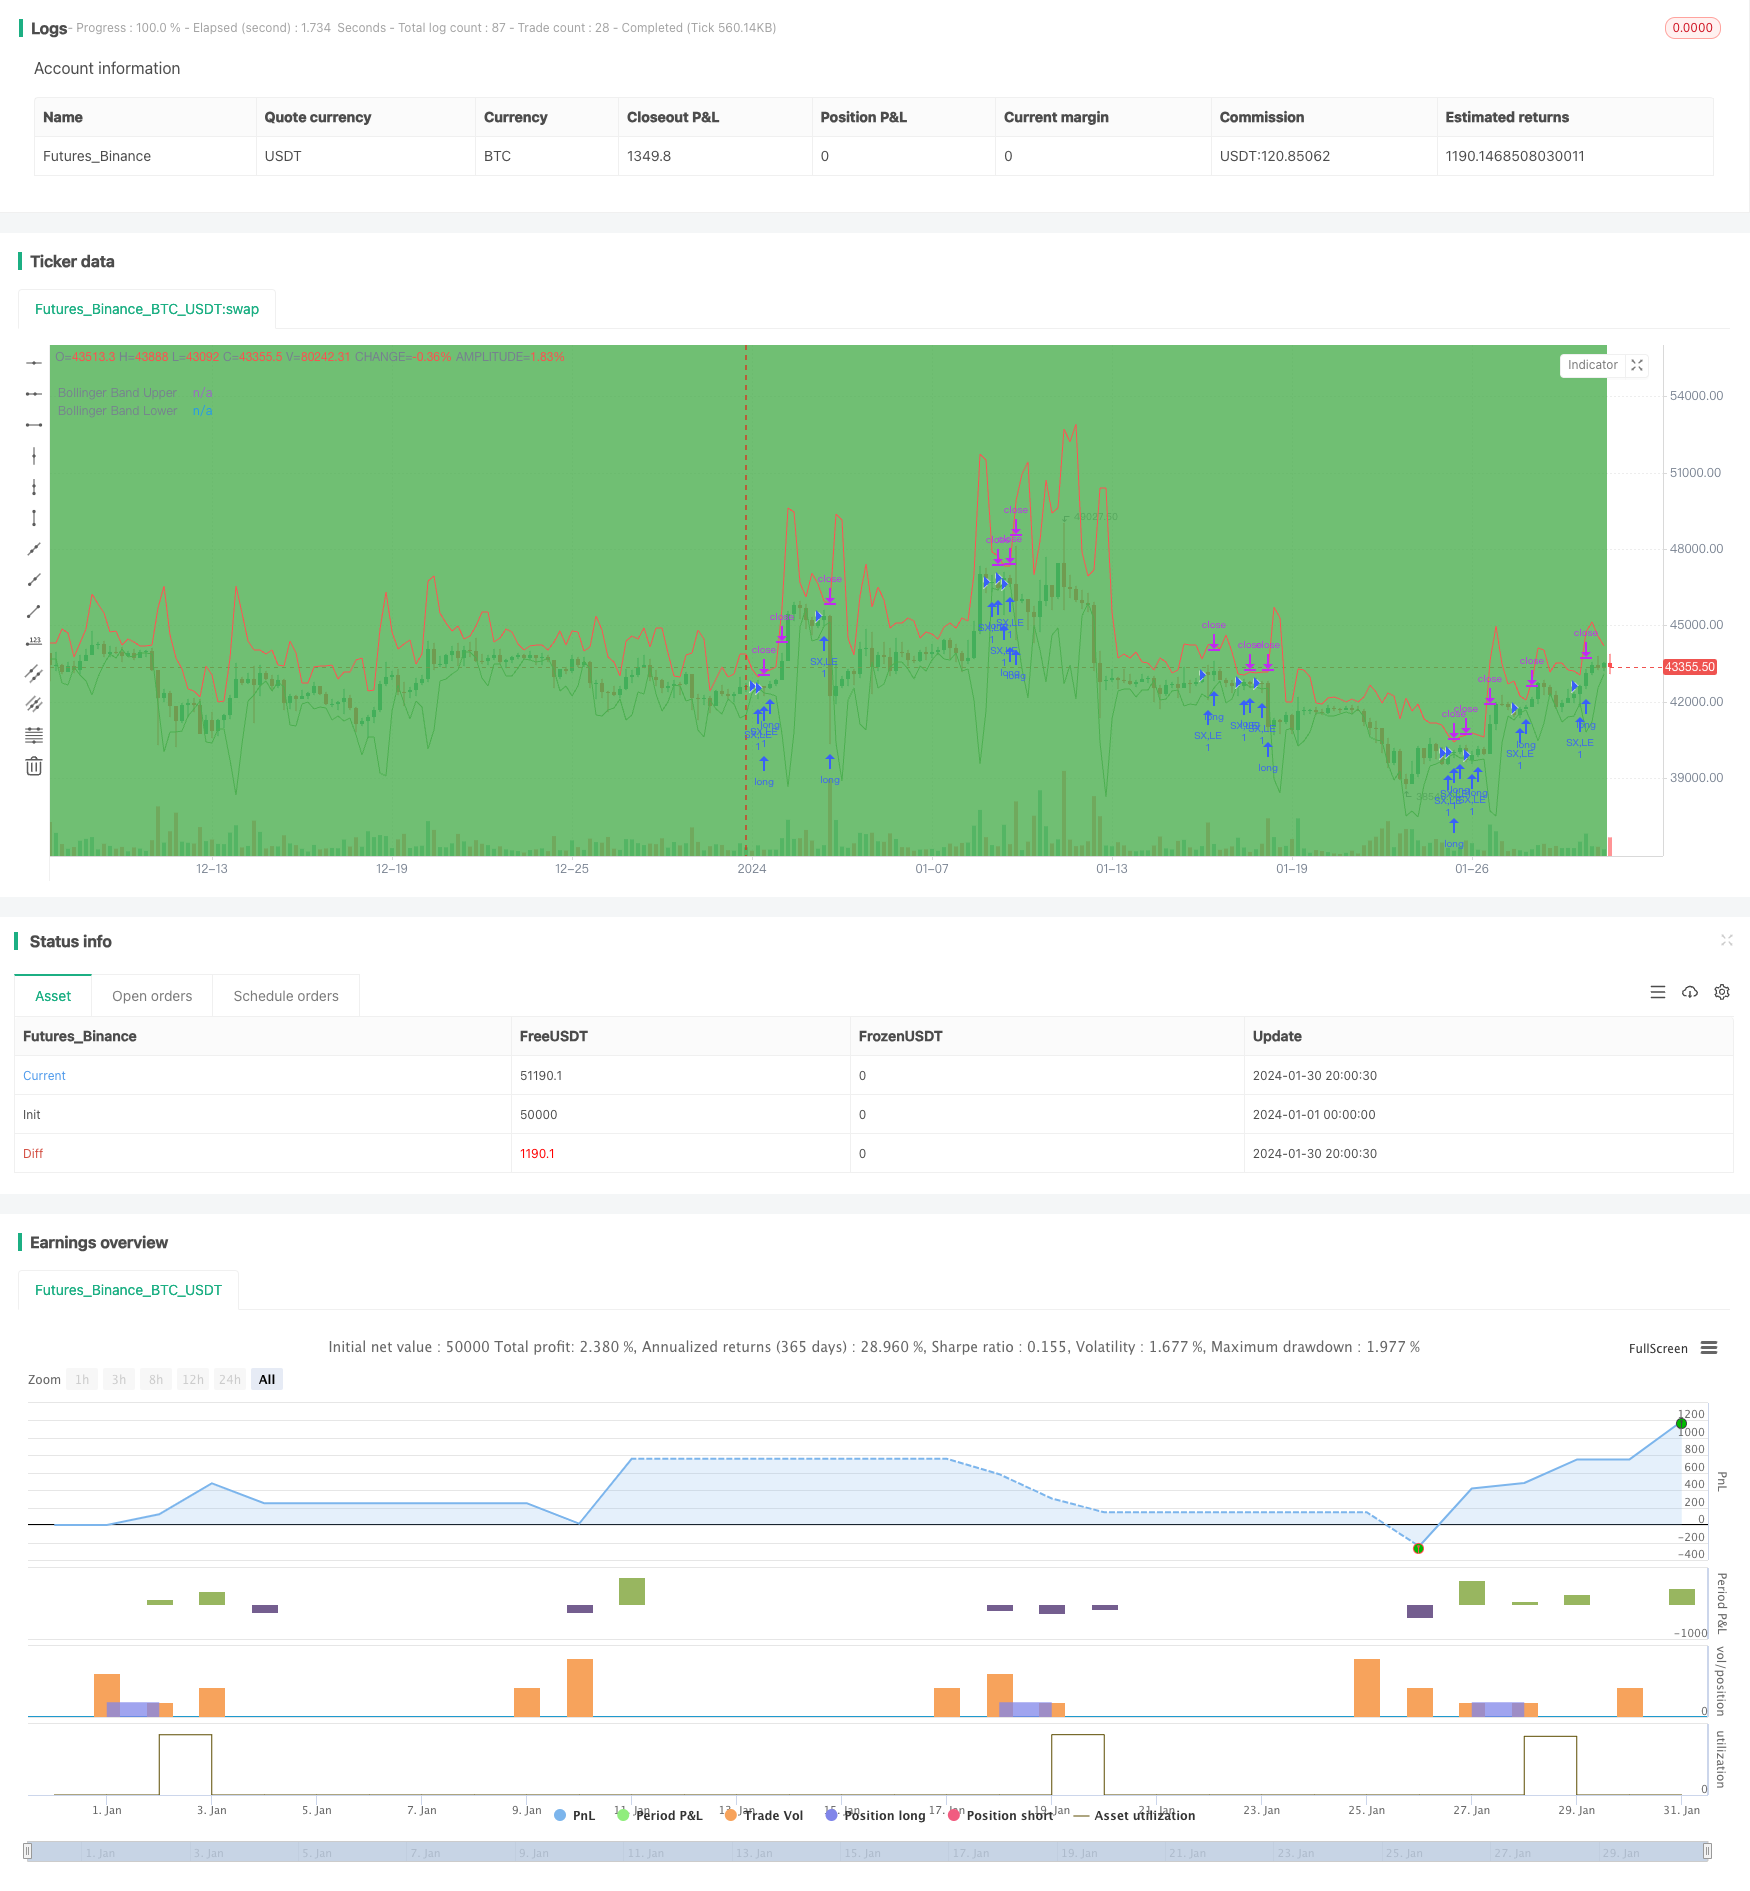
/*backtest
start: 2024-01-01 00:00:00
end: 2024-01-31 00:00:00
period: 5h
basePeriod: 15m
exchanges: [{"eid":"Futures_Binance","currency":"BTC_USDT"}]
*/

// This source code is subject to the terms of the Mozilla Public License 2.0 at https://mozilla.org/MPL/2.0/
// © abilash.s.90


dIMinusCalc(adxLen) =>

    smoothedTrueRange = 0.0
    smoothedDirectionalMovementMinus = 0.0
    dIMinus = 0.0
    trueRange = 0.0
    directionalMovementMinus = 0.0

    trueRange := max(max(high-low, abs(high-nz(close[1]))), abs(low-nz(close[1])))
    directionalMovementMinus := nz(low[1])-low > high-nz(high[1]) ? max(nz(low[1])-low, 0): 0

    smoothedTrueRange := nz(smoothedTrueRange[1]) - (nz(smoothedTrueRange[1])/adxLen) + trueRange
    smoothedDirectionalMovementMinus := nz(smoothedDirectionalMovementMinus[1]) - (nz(smoothedDirectionalMovementMinus[1])/adxLen) + directionalMovementMinus

    dIMinus := smoothedDirectionalMovementMinus / smoothedTrueRange * 100

    dIMinus

dIPlusCalc(adxLen) =>

    smoothedTrueRange = 0.0
    smoothedDirectionalMovementPlus = 0.0
    dIPlus =  0.0
    trueRange = 0.0
    directionalMovementPlus = 0.0

    trueRange := max(max(high-low, abs(high-nz(close[1]))), abs(low-nz(close[1])))
    directionalMovementPlus := high-nz(high[1]) > nz(low[1])-low ? max(high-nz(high[1]), 0): 0

    smoothedTrueRange := nz(smoothedTrueRange[1]) - (nz(smoothedTrueRange[1])/adxLen) + trueRange
    smoothedDirectionalMovementPlus := nz(smoothedDirectionalMovementPlus[1]) - (nz(smoothedDirectionalMovementPlus[1])/adxLen) + directionalMovementPlus

    dIPlus := smoothedDirectionalMovementPlus / smoothedTrueRange * 100

    dIPlus


Adx(adxLen) =>
    dIPlus =  0.0
    dIMinus = 0.0
    dX = 0.0
    aDX = 0.0
    dIPlus := dIPlusCalc(adxLen)
    dIMinus := dIMinusCalc(adxLen)
    dX := abs(dIPlus-dIMinus) / (dIPlus+dIMinus)*100
    aDX := sma(dX, adxLen)

    aDX

BarInSession(sess) => time(timeframe.period, sess) != 0


//@version=4
strategy("Bollinger Band + RSI + ADX + MACD", overlay=true)

//Session

session = input(title="Trading Session", type=input.session, defval="0930-1500")

sessionColor = BarInSession(session) ? color.green : na

bgcolor(color=sessionColor, transp=95)

// Bollinger Bands
src = input(high, title="Bollinger Band Source", type=input.source)
length = input(3, minval=1, type=input.integer, title="Bollinger Band Length")
mult = input(4.989, minval=0.001, maxval=50, step=0.001, type=input.float, title="Bollinger Band Std Dev")
basis = sma(src, length)
dev = mult * stdev(src, length)
upper = basis + dev
lower = basis - dev


plot(upper, title="Bollinger Band Upper", color=color.red)
plot(lower, title="Bollinger Band Lower", color=color.green)

// RSI
rsiSrc = input(close, title="RSI Source", type=input.source)
rsiLength = input(16, minval=1, type=input.integer, title="RSI Length")
rsiComparator = input(39.2, title="RSI Comparator", type=input.float, step=0.1)

rsi = rsi(rsiSrc, rsiLength)

// ADX
adxLength = input(14, minval=1, type=input.integer, title="ADX Length")
adxComparator = input(14, minval=1, type=input.integer, title="ADX Comparator")

adx = Adx(adxLength)

// Heikinashi

haClose = security(heikinashi(syminfo.ticker), timeframe.period, close)
haOpen = security(heikinashi(syminfo.ticker), timeframe.period, open)

nextHaOpen = (haOpen + haClose) / 2

//MACD

macdCalcTypeProcessed = input(title="MACD Source", type=input.source, defval=high)
fast = input(12, title="MACD Fast")
slow = input(20, title="MACD Slow")
signalLen = input(15, title="MACD Signal")

fastMA = ema(macdCalcTypeProcessed, fast)
slowMA = ema(macdCalcTypeProcessed, slow)
macd = fastMA - slowMA
signal = sma(macd, signalLen)


longCondition() =>
    (low < lower) and (rsi[0] > rsiComparator) and (adx > adxComparator) and (close > nextHaOpen) and BarInSession(session) and macd > signal

stop = (close - max((low - (low * 0.0022)), (close - (close * 0.0032)))) / syminfo.mintick
target = (max(upper, (close + (close * 0.0075))) - close) / syminfo.mintick


strategy.entry("SX,LE", strategy.long, when=longCondition(), comment="SX,LE")
strategy.close_all(when=(not BarInSession(session)))
strategy.exit("LX", from_entry="SX,LE", profit=target, loss=stop)
Detail
https://www.fmz.com/strategy/440700
Last Modified
2024-02-01 11:42:22