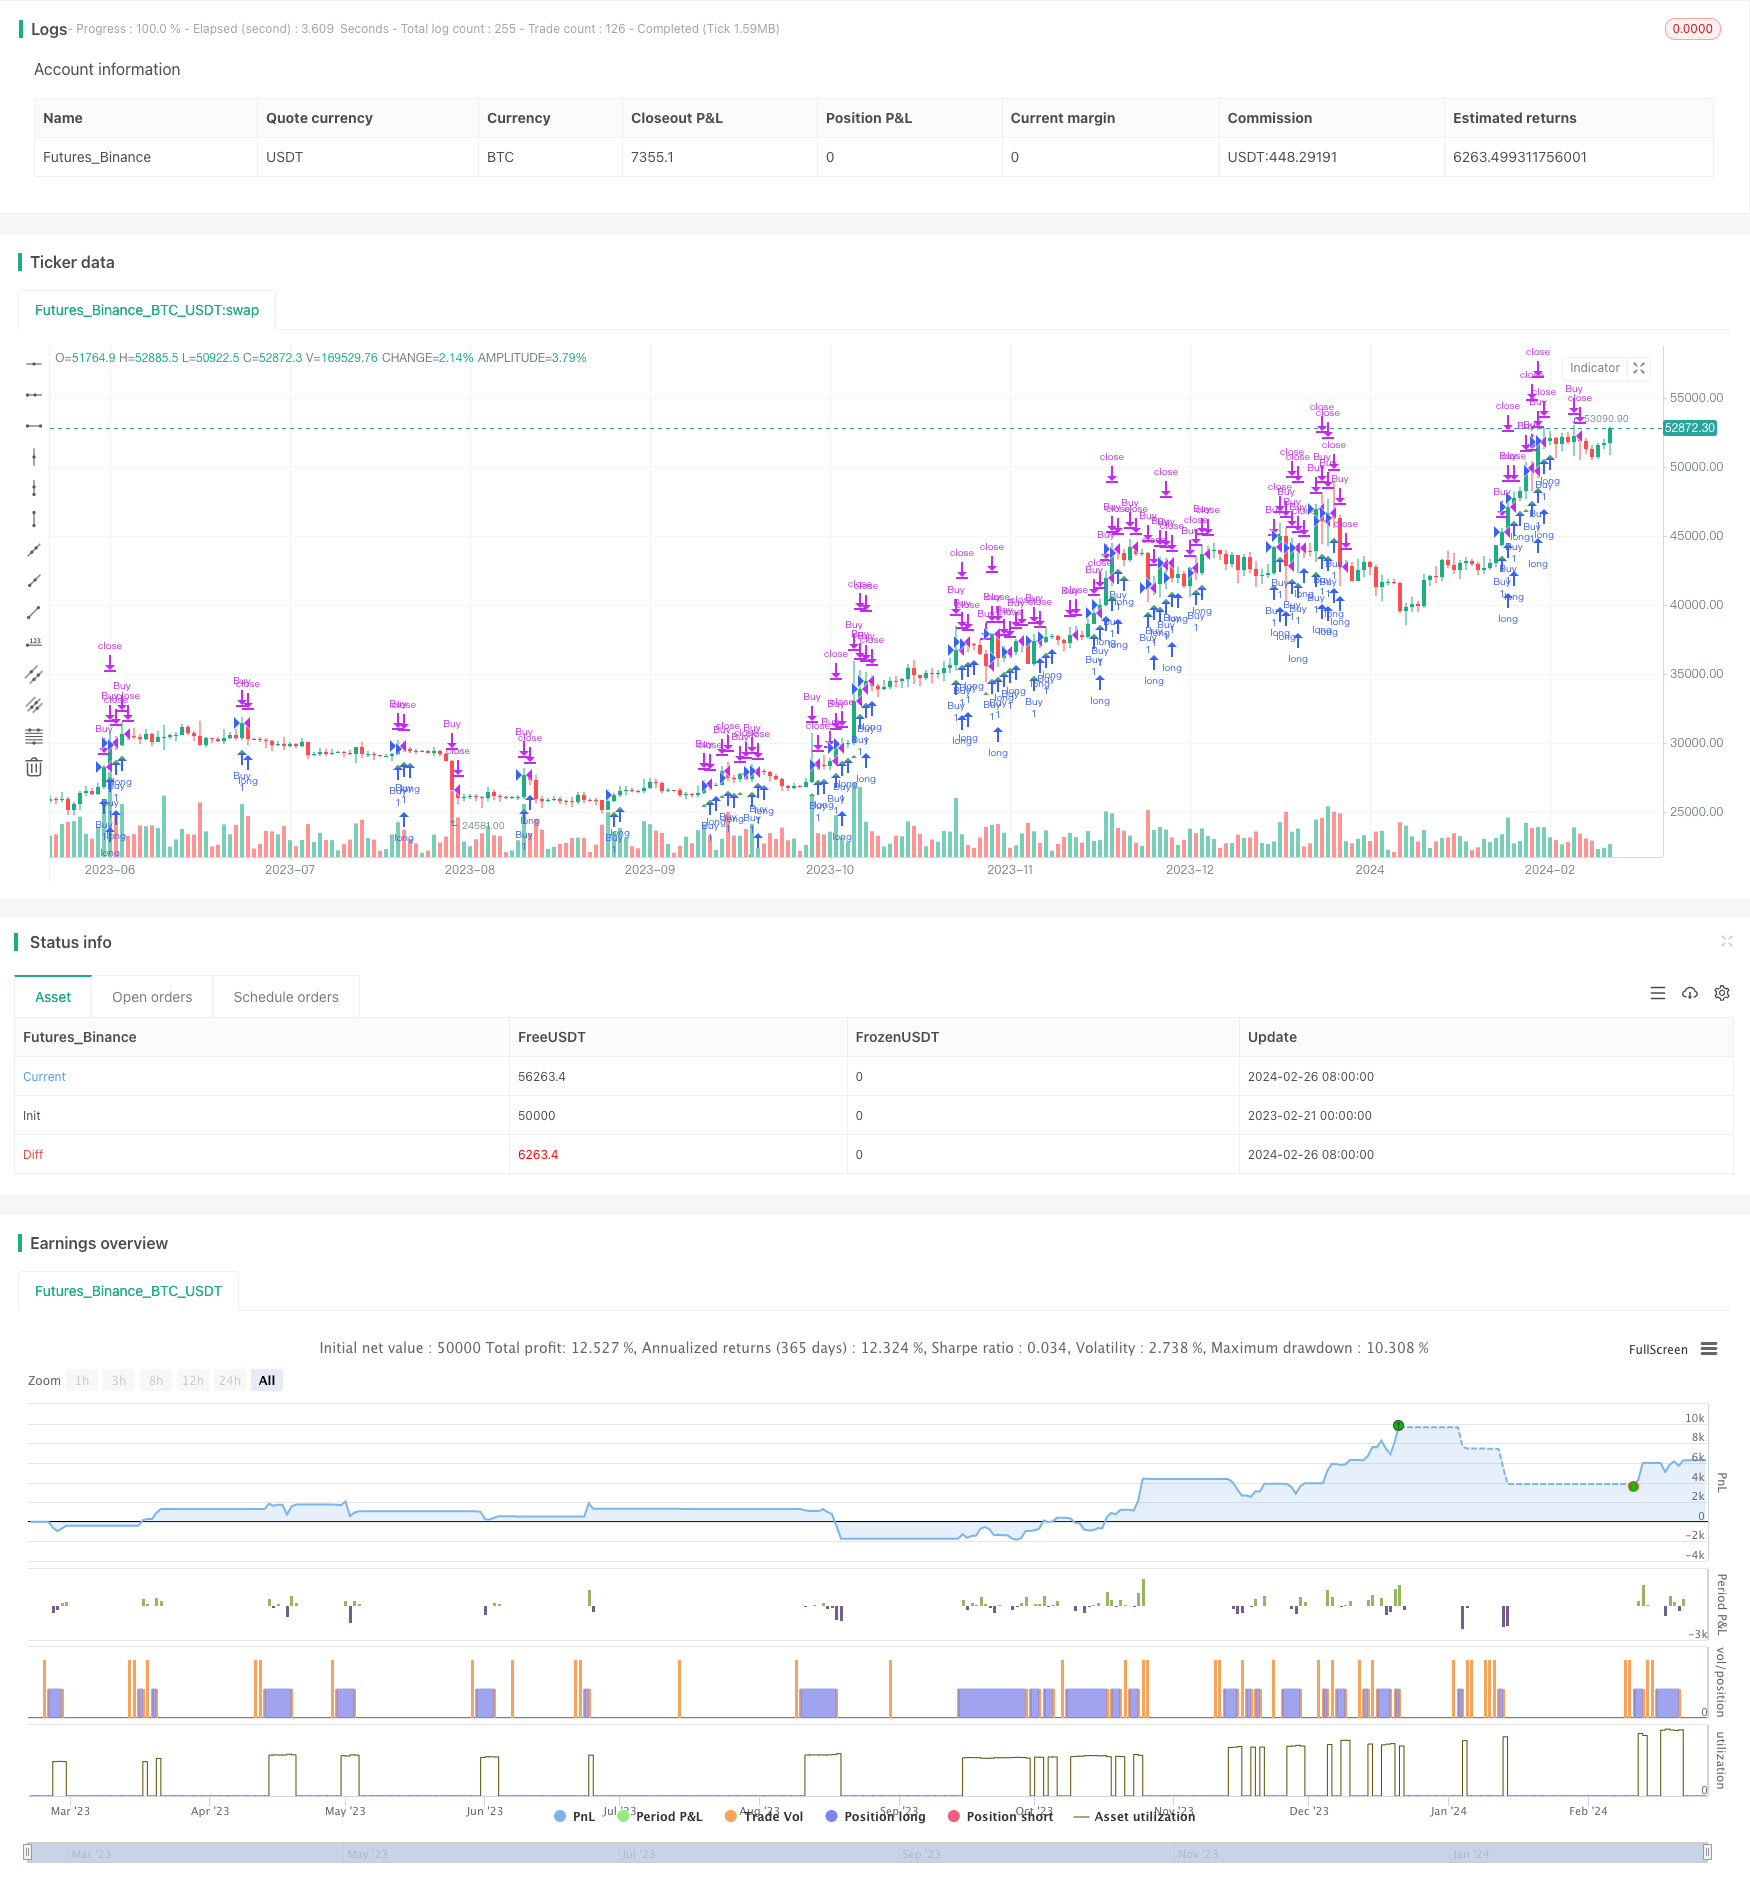
Name
防跳空开仓策略Gap-Opening-Strategy
Author
ChaoZhang
Strategy Description

- 使用20周期的简单移动平均线判断市场总体走势
- 使用3周期的最高价与最低价差值判断最近价格波动幅度
- 当价格高于移动平均线且差值大于自身20周期平均值时,做多开仓
- 当价格跌破开仓价格的98%时,平仓止损
该策略结合移动平均线和价格波动幅度判断,旨在捕捉趋势行情中的价格上涨机会。
当价格上涨突破移动平均线时,表示当前处于多头行情。此时若最近3周期的最高价与最低价差值大于自身的20周期平均值,说明最近波动范围加大,价格可能出现较大幅度上涨,这时做多开仓。
在开仓后,设定一个固定比例的止损价格,当价格跌破该价格时主动止损平仓,控制下side风险。
- 结合趋势和波动判断,避免在震荡行情中频繁开仓
- 利用价格差值判断来确定更有力的突破信号
- 设定止损价格有助于控制风险
- 移动平均线和差值判断参数设置不当可能错过交易机会
- 止损位置设置过于宽松,可能带来较大亏损
- 突破信号可能是假突破,需要结合更多因素判断
风险解决方法:
- 对参数进行优化,确定最佳参数组合
- 设置多级止损,或根据市场波动调整止损位置
- 结合交易量等指标来验证突破信号的可靠性
- 增加波动力度指标,如布林带通道,更准确判断 entry 时机
- 增加交易量的分析来验证 entry 信号
- 结合股指期货判断整体市场环境,避免不利行情的交易
- 设置移动止损、跟踪止损来锁定更大利润
本策略通过简单有效的指标判断来实现在趋势行情中高效开仓的思路,可有效过滤震荡小行情,避免无谓交易。同时,策略风险控制也比较到位,能够很好控制潜在亏损。通过进一步优化,可望获得更好的交易效果。
||
This strategy judges market trend direction by calculating moving average and price difference to determine long entry, avoiding frequent opening during shocks.
- Use 20-period simple moving average to determine overall market trend
- Use 3-period high-low price difference to judge recent price fluctuation
- Go long when price is above MA and difference is greater than 20-period average
- Exit when price drops below 98% of entry price
This strategy combines MA and price fluctuation to capture upside opportunities during trends.
When price breaks above MA, it indicates an upward trend. If recent 3-period HL difference is larger than 20-period average, it suggests increased fluctuation and potential for a big rise for entry.
After opening, set a fixed percentage stop loss price. Exit when price drops below to control downside risk.
- Avoid frequent opening during shocks by judging both trend and volatility
- More solid breakout signal using price difference
- Stop loss helps control risk
- Improper parameter tuning leads to missing trades
- Too wide stop loss brings large loss
- Breakout could be false, needs more factors
Risk Solutions:
- Optimize parameters for best combination
- Use multiple stops or adaptive stops per market volatility
- Add indicators like volume to confirm signal reliability
- Add volatility indicators like BB for better entry
- Analyze volume to confirm entry signals
- Judge overall market using stock index to avoid bad trades
- Use moving/trailing stop to lock in more profit
This strategy effectively filters out shocks and volatility before entering in trending markets with simple but useful indicators, avoiding unnecessary trades. Also, risk is well controlled to limit losses. Further optimizations can lead to even better results.
[/trans]
Strategy Arguments
| Argument | Default | Description |
|---|---|---|
| v_input_1 | 20 | Longitud MA |
| v_input_2 | 3 | Longitud HL |
| v_input_3 | 0.98 | Salir por debajo de precio |
Source (PineScript)
/*backtest
start: 2023-02-21 00:00:00
end: 2024-02-27 00:00:00
period: 1d
basePeriod: 1h
exchanges: [{"eid":"Futures_Binance","currency":"BTC_USDT"}]
*/

//@version=5
strategy("Estrategia de Diferencia HL y MA para Criptomonedas", shorttitle="HL MA Crypto Strategy-Ortiz", overlay=true)

// Definir longitud de MA y HL
ma_length = input(20, title="Longitud MA")
hl_length = input(3, title="Longitud HL")
exit_below_price = input(0.98, title="Salir por debajo de precio")

// Calcular MA
ma = ta.sma(close, ma_length)

// Calcular HL
hh = ta.highest(high, hl_length)
ll = ta.lowest(low, hl_length)
hl = hh - ll

// Condiciones de tendencia alcista
bullish_trend = close > ma

// Condiciones de entrada y salida
long_condition = close > ma and close > ma[1] and hl > ta.sma(hl, ma_length)
short_condition = false // No operar en tendencia bajista
exit_condition = low < close * exit_below_price

// Entrada y salida de la estrategia
if (long_condition)
    strategy.entry("Buy", strategy.long)
if (short_condition)
    strategy.entry("Sell", strategy.short)
if (exit_condition)
    strategy.close("Buy")

// Plot de señales en el gráfico
plotshape(long_condition, style=shape.triangleup, location=location.belowbar, color=color.green, size=size.small, title="Buy Signal")
plotshape(short_condition, style=shape.triangledown, location=location.abovebar, color=color.red, size=size.small, title="Sell Signal")
Detail
https://www.fmz.com/strategy/443035
Last Modified
2024-02-28 17:12:52