Name
随机漩涡策略Stochastic-Vortex-Strategy
Author
ChaoZhang
Strategy Description
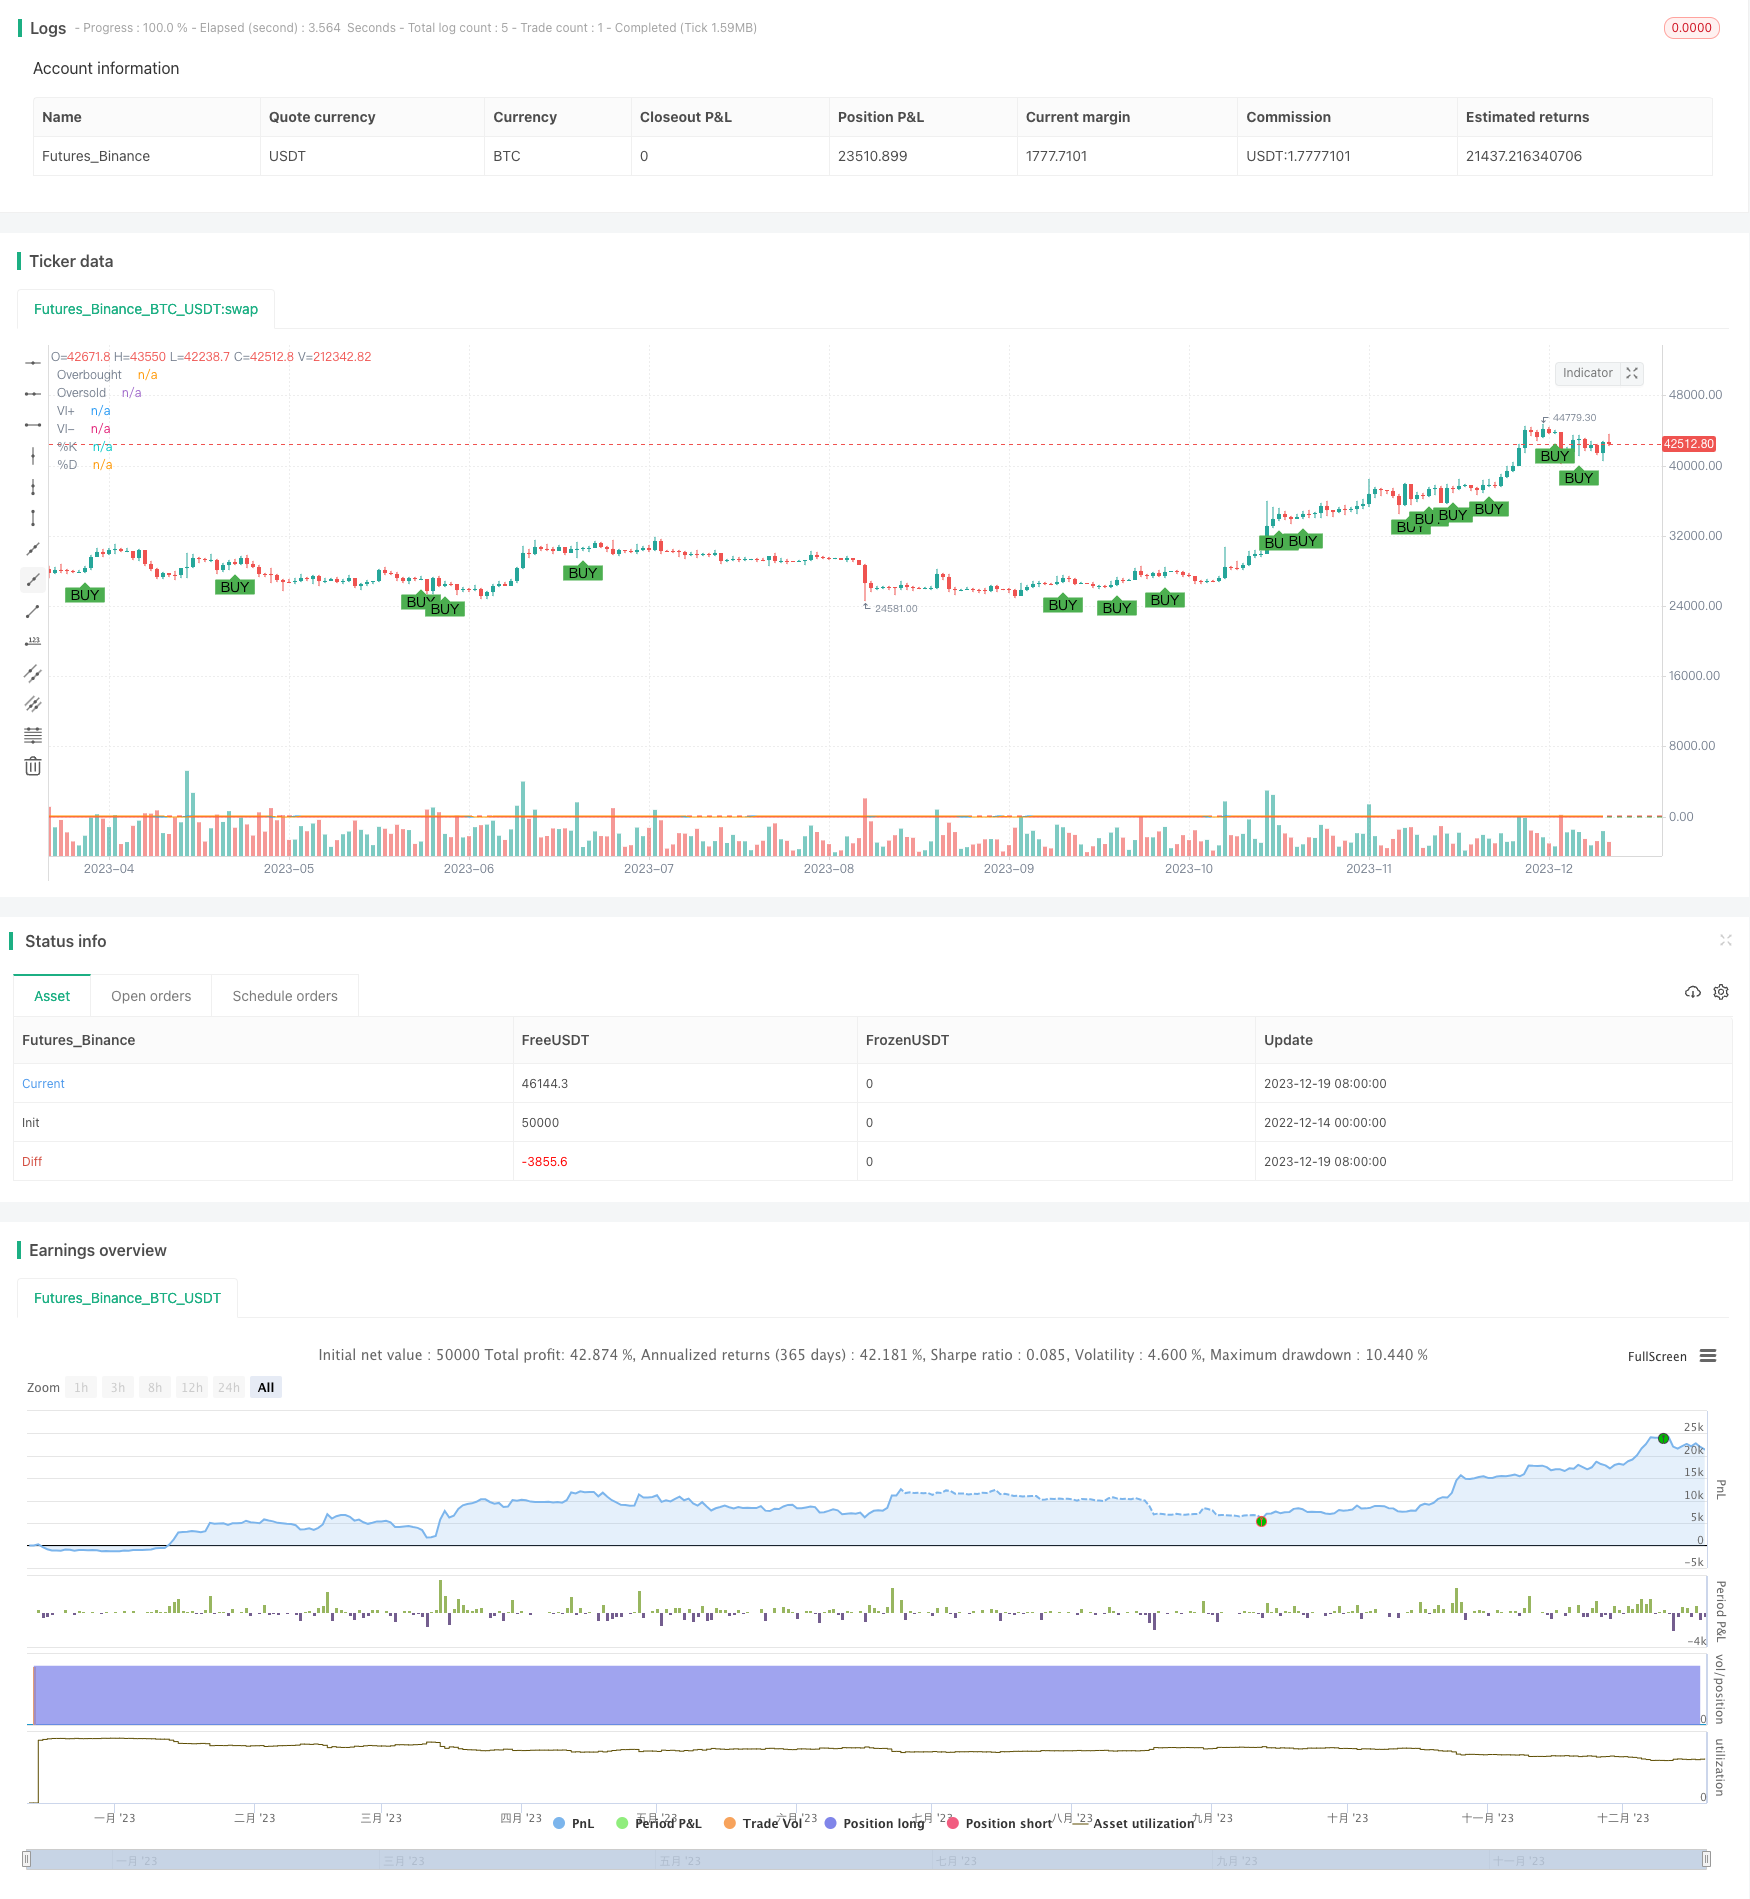
随机漩涡策略是一种当随机指数的K线跨过D线且正漩涡指数高于负漩涡指数时,产生买入信号的策略。该策略结合了随机指数指标和漩涡指数指标的优势,旨在在股价反转时抓住机会进入市场。
该策略主要基于两个指标:
-
随机指数(Stochastic Oscillator):该指标将当天的收盘价与一定周期内的最高价和最低价进行比较,反映市场是过卖还是过买。当随机指数的快线K上穿慢线D时,视为买入信号。
-
漩涡指数(Vortex Indicator):该指标通过比较一定周期内波动的最大和最小值,反映市场的漩涡式上升或下跌运动。当正漩涡指数高于负漩涡指数时,意味着股价上涨势头强于下跌势头,可以买入。
本策略的买入信号来自随机指数的快线K上穿慢线D,说明股价从过卖区域反转上涨;而正漩涡指数高于负漩涡指数意味着股价上涨势头强劲,因此结合这两个信号产生最终的买入判断。
该策略结合随机指数和漩涡指数两个指标的优势,主要有以下特点:
-
能及时抓住股价反转上涨的机会,随机指数K线上穿D线反映股价反转;
-
漩涡指数判断了上涨势头,避免假突破;
-
Parameters可以调整指标参数,优化策略;
-
可视化的买入信号提示直观判断;
-
随机指数和漩涡指数内置机制,不需要大量历史数据支持,适合实盘。
该策略也存在一些风险:
-
买入信号可能出现误报,无法完全避免亏损;
-
指标参数设置不当可能影响策略效果;
-
股价出现剧烈波动时,指标失效的概率较大;
-
无法判断市场趋势,在熊市中也会产生买入信号。
这些风险可以通过调整指标参数、设置止损、考虑大市趋势等方法尽量规避。但任何量化策略都无法完全避免亏损,需要承担一定程度的风险。
该策略还可以从以下几个方向进行优化:
-
结合其他技术指标判断大致趋势,避免高位开仓;
-
增加止损机制来控制单次最大损失;
-
测试不同的指标参数组合,寻找最优参数;
-
增加开仓条件以减少误报概率;
-
考虑交易成本,设置最小利润目标。
这些优化可以提高策略的稳定性,降低损失,并最大限度挖掘策略的价值。
随机漩涡策略综合考虑了股价反转信号和上涨势头信号,是一种典型的反转策略。它及时抓住股价从过卖区反转上涨的机会,同时利用漩涡指数判断上涨动量,避免假突破。该策略运用灵活,易于实盘,风险可控,是一种可供选择的量化策略。但任何策略都无法完全规避市场风险,需谨慎对待,同时也要关注可能的优化空间,以发掘策略的更大价值。
||
The Stochastic Vortex strategy is a strategy that generates buy signals when the K line of the Stochastic Oscillator crosses above the D line and the positive VI is higher than the negative VI. This strategy combines the advantages of the Stochastic Oscillator indicator and the Vortex Indicator to catch opportunities when stock prices reverse.
The strategy is mainly based on two indicators:
-
Stochastic Oscillator: This indicator compares the closing price of the day to the highest and lowest prices over a certain period to reflect whether the market is oversold or overbought. When the fast line K of the Stochastic Oscillator crosses above the slow line D, it is considered a buy signal.
-
Vortex Indicator: This indicator reflects the whirlpool-like upward or downward movements in the market by comparing fluctuations over a certain period. When the positive vortex index is higher than the negative vortex index, it means the upward momentum of the stock price is stronger than the downward momentum, so we can buy.
The buy signal of this strategy comes from the fast line K crossing above the slow line D of the Stochastic Oscillator, indicating the stock price rebounds from the oversold area. And the positive vortex index higher than the negative vortex index means strong upward momentum of the stock price. So the combination of these two signals generates the final buy decision.
The main features of this strategy are:
-
Catch the rebound of stock prices in a timely manner. The K line crossing above the D line reflects the price reversal.
-
The Vortex Index determines the upward momentum to avoid false breakouts.
-
Adjustable parameters to optimize the strategy.
-
Visualized buy signal for intuitive judgement.
-
The stochastic and vortex have built-in mechanisms without too much historical data. Suitable for live trading.
There are some risks in this strategy:
-
Buy signals may have errors and losses cannot be completely avoided.
-
Inappropriate parameter settings may affect strategy performance.
-
The probability of indicator failure is greater when stock prices fluctuate sharply.
-
It cannot determine market trends and will also generate buy signals in bear markets.
These risks can be mitigated by adjusting parameters, setting stop loss, considering market trends, etc. But no quantitative strategies can completely avoid losses. Certain risks need to be taken.
The strategy can also be optimized in the following aspects:
-
Combine other technical indicators to determine overall trend to avoid opening positions at high levels.
-
Increase stop loss mechanisms to control maximum single loss.
-
Test different combinations of indicator parameters to find the optimal parameters.
-
Increase opening conditions to reduce false positive probabilities.
-
Consider trading costs and set minimum profit targets.
These optimizations can improve the stability of strategies, reduce losses, and maximize the value of strategies.
The Stochastic Vortex Strategy takes into account the price reversal signals and upward momentum signals. It is a typical reversal strategy. It seizes opportunities when stock prices rebound from oversold areas and uses the Vortex Index to determine upward momentum to avoid false breakouts. This flexible, easy-to-implement strategy has controllable risks and is a good quantitative strategy. But no strategy can completely avoid market risk. We should treat it cautiously and pay attention to possible optimization spaces to discover greater value of the strategy.
[/trans]
Strategy Arguments
| Argument | Default | Description |
|---|---|---|
| v_input_1 | 14 | K Period |
| v_input_2 | 3 | D Period |
| v_input_3 | 3 | Slowing |
| v_input_4 | 14 | Vortex Length |
Source (PineScript)
/*backtest
start: 2022-12-14 00:00:00
end: 2023-12-20 00:00:00
period: 1d
basePeriod: 1h
exchanges: [{"eid":"Futures_Binance","currency":"BTC_USDT"}]
*/

//@version=4
strategy("Stochastic and Vortex Strategy", overlay=true)

// Stochastic Oscillator settings
kPeriod = input(14, title="K Period")
dPeriod = input(3, title="D Period")
slowing = input(3, title="Slowing")
k = sma(stoch(close, high, low, kPeriod), slowing)
d = sma(k, dPeriod)

// Vortex Indicator settings
lengthVI = input(14, title="Vortex Length")
tr = max(max(high - low, abs(high - close[1])), abs(low - close[1]))
vmPlus = abs(high - low[1])
vmMinus = abs(low - high[1])
viPlus = sum(vmPlus, lengthVI) / sum(tr, lengthVI)
viMinus = sum(vmMinus, lengthVI) / sum(tr, lengthVI)

// Buy condition
buyCondition = crossover(k, d) and viPlus > viMinus

if (buyCondition)
    strategy.entry("Buy", strategy.long)

plotshape(series=buyCondition, title="Buy Signal", location=location.belowbar, color=color.green, style=shape.labelup, text="BUY")
plot(k, title="%K", color=color.blue)
plot(d, title="%D", color=color.orange)
hline(80, "Overbought", color=color.red)
hline(20, "Oversold", color=color.green)
plot(viPlus, title="VI+", color=color.purple)
plot(viMinus, title="VI-", color=color.red)
Detail
https://www.fmz.com/strategy/436123
Last Modified
2023-12-21 15:12:37