Name
Fisher变换指标回测策略Backtesting-Strategy-Based-on-Fisher-Transform-Indicator
Author
ChaoZhang
Strategy Description
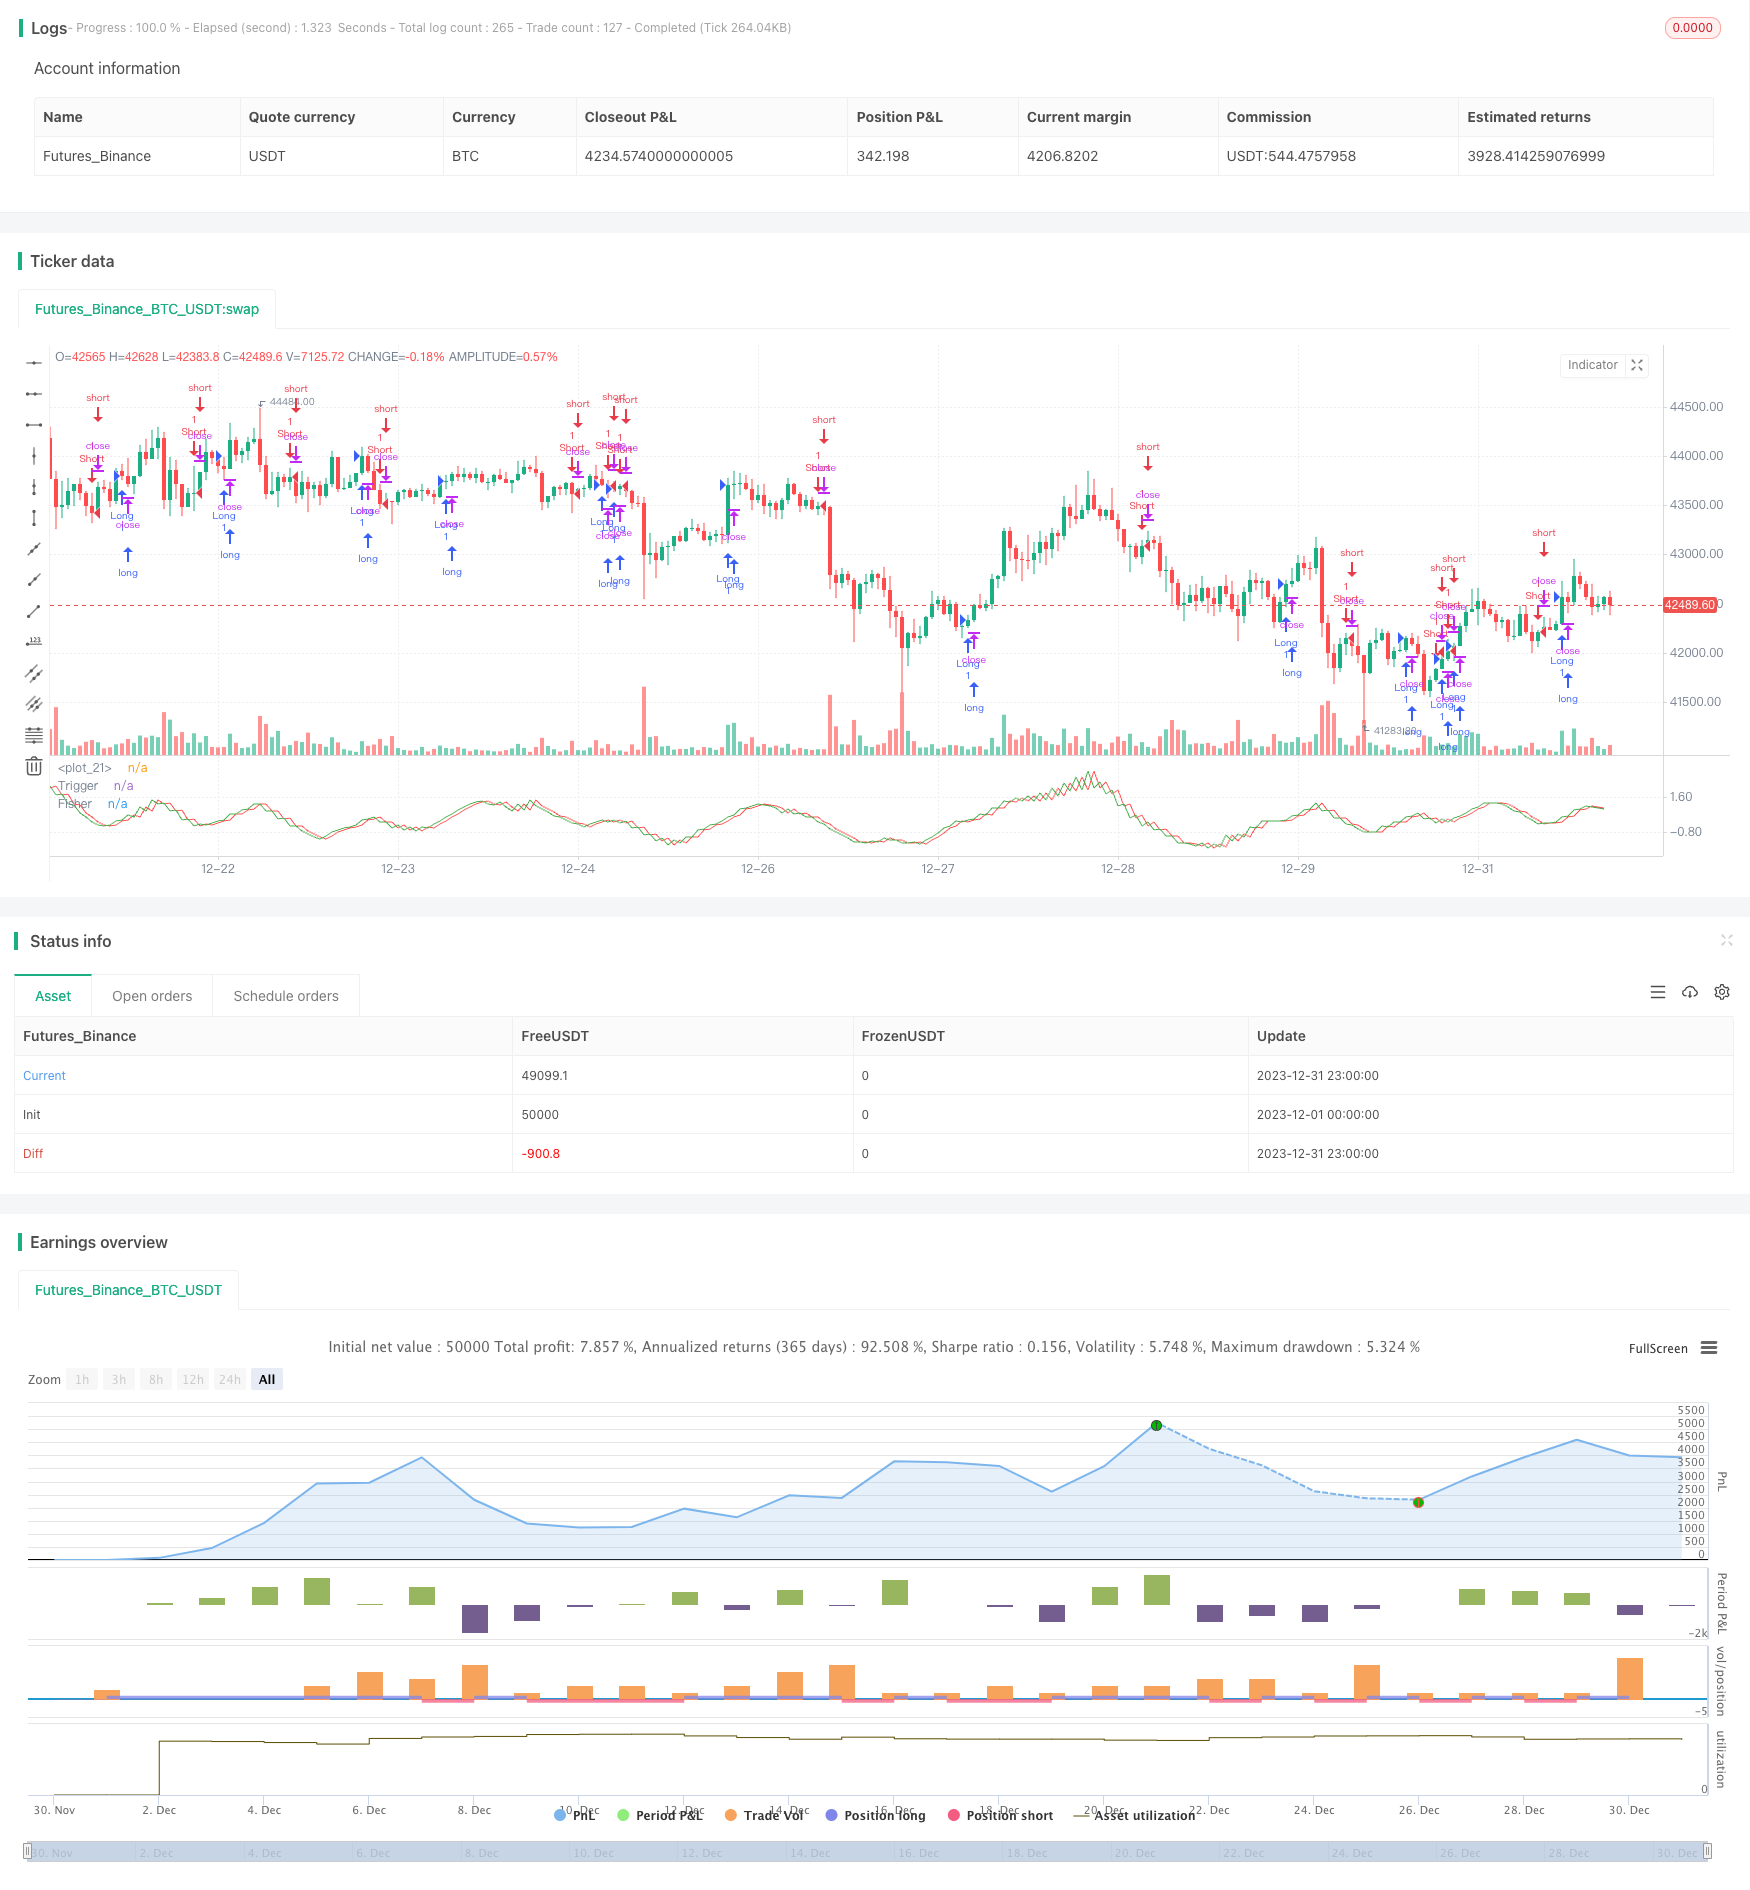
该策略是基于Fisher变换指标的回测策略。Fisher变换公式可以将价格数据转换成正态分布,用来识别价格极值点和转折点。该策略结合Fisher变换指标判断价格趋势,实现automated trading。
- 计算HL2指标
- 计算最近Length周期内HL2的最大值xMaxH和最小值xMinL
- 计算Fisher变换指标:
- nValue1为0.33×(HL2标准化)+0.67×nValue1的前一周期值
- nValue2限制nValue1在-0.99到0.99之间
- nFish为nValue2的对数函数转化
- 判断nFish为正还是负,确定仓位方向
- 仓位信号possig,如果设置反向交易,则仓位取反
- 入场:possig=1做多,possig=-1做空
- Fisher变换指标能识别价格极值点和转折点,判断趋势准确
- 结合HL2指标过滤震荡,提高胜率
- 可设置反向交易,适应不同市场环境
- 自动化交易,无需人工判断,降低交易成本
- Fisher变换指标有滞后,可能错过短线价格变化
- 震荡趋势中止损风险大
- 反向交易设置不当可能导致系统性失误交易
- 未考虑跨时间周期验证,存在一定的假阳性风险
风险解决:
- 适当调整参数,缩短延迟
- 加大止损幅度,控制单笔损失
- 优化反向交易结合其他指标过滤
- 增加趋势、价格等级、波段等多重验证
- 结合趋势指标过滤,确保大趋势一致
- 增加波段指标,提高价格转折判断准确性
- 多时间周期验证,避免假阳性
- 动态调整止损幅度
- 优化参数,最大化胜率和盈利因子
以上优化策略可以进一步提高策略胜率、锁定盈利、控制风险,从而获得更稳定、高效的交易结果。
Fisher变换指标回测策略整合Fisher变换指标判断价格转折点和趋势方向。该策略判断准确,自动化程度高,通过参数优化可以获得稳定而高效的交易结果。但也存在一定滞后、假阳性等风险,需要引入多重验证机制和动态调整方式进一步优化,使策略更具弹性和鲁棒性。
||
This strategy is a backtesting strategy based on the Fisher transform indicator. The Fisher transform formula can convert price data into a normal distribution to identify price extremes and turning points. This strategy combines the Fisher transform indicator to determine price trends and achieve automated trading.
- Calculate the HL2 indicator
- Calculate the maximum xMaxH and minimum xMinL of HL2 in the most recent Length periods
- Calculate the Fisher transform indicator:
- nValue1 is 0.33×(standardized HL2)+0.67×nValue1 of the previous period
- nValue2 limits nValue1 between -0.99 and 0.99
- nFish is the logarithmic transformation of nValue2
- Determine whether nFish is positive or negative to determine the position direction
- Position signal possig, if reverse trading is set, take the opposite position
- Entry signal: possig=1 for long, possig=-1 for short
- The Fisher transform indicator can identify price extremes and turning points to accurately determine trends
- Filtering fluctuations by combining HL2 indicators increases win rate
- Reverse trading can be set to adapt to different market environments
- Automated trading without manual judgment reduces trading costs
- The Fisher transform indicator has lag and may miss short-term price changes
- High risk of stop loss in volatile trends
- Improper reverse trade settings can lead to systemic erroneous trades
- Lack of cross cycle verification, there is a certain false positive risk
Risk Solutions:
- Adjust parameters appropriately to shorten delays
- Increase stop loss range to control single transaction loss
- Optimize reverse trades combined with other indicators for filtering
- Increase multiple verification mechanisms of trends, price levels, cycles etc
- Combine trend indicators to ensure major trends are consistent
- Increase cyclic indicators to improve price reversal judgment accuracy
- Multi-timeframe verification to avoid false positives
- Dynamically adjust stop loss range
- Optimize parameters to maximize win rate and profit factor
The above optimizations can further improve the win rate of the strategy, lock in profits, control risks, and obtain more stable and efficient trading results.
The Fisher transform indicator backtesting strategy integrates the Fisher transform indicator to determine price reversal points and trend directions. This strategy has accurate judgments and a high degree of automation. Through parameter optimization, stable and efficient trading results can be obtained. But there are also certain risks such as lag and false positives. Further optimization is needed by introducing multiple verification mechanisms and dynamic adjustment methods to make the strategy more flexible and robust.
[/trans]
Strategy Arguments
| Argument | Default | Description |
|---|---|---|
| v_input_1 | 10 | Length |
| v_input_2 | false | Trade reverse |
Source (PineScript)
/*backtest
start: 2023-12-01 00:00:00
end: 2023-12-31 23:59:59
period: 1h
basePeriod: 15m
exchanges: [{"eid":"Futures_Binance","currency":"BTC_USDT"}]
*/

//@version = 2
////////////////////////////////////////////////////////////
//  Copyright by HPotter v2.0 22/12/2016
// 	Market prices do not have a Gaussian probability density function
// 	as many traders think. Their probability curve is not bell-shaped.
// 	But trader can create a nearly Gaussian PDF for prices by normalizing
// 	them or creating a normalized indicator such as the relative strength
// 	index and applying the Fisher transform. Such a transformed output
// 	creates the peak swings as relatively rare events.
// 	Fisher transform formula is: y = 0.5 * ln ((1+x)/(1-x))
// 	The sharp turning points of these peak swings clearly and unambiguously
// 	identify price reversals in a timely manner.
//
//  For signal used zero.
// You can change long to short in the Input Settings
// Please, use it only for learning or paper trading. Do not for real trading.
////////////////////////////////////////////////////////////
strategy(title="Fisher Transform Indicator by Ehlers Backtest", shorttitle="Fisher Transform Indicator by Ehlers")
Length = input(10, minval=1)
reverse = input(false, title="Trade reverse")
hline(1, color=white)
xHL2 = hl2
xMaxH = highest(xHL2, Length)
xMinL = lowest(xHL2,Length)
nValue1 = 0.33 * 2 * ((xHL2 - xMinL) / (xMaxH - xMinL) - 0.5) + 0.67 * nz(nValue1[1])
nValue2 =   iff(nValue1 > .99,  .999,
	         iff(nValue1 < -.99, -.999, nValue1))
nFish = 0.5 * log((1 + nValue2) / (1 - nValue2)) + 0.5 * nz(nFish[1])
pos = iff(nFish > 0, 1,
	   iff(nFish < 0, -1, nz(pos[1], 0)))
possig = iff(reverse and pos == 1, -1,
          iff(reverse and pos == -1, 1, pos))
if (possig == 1)
    strategy.entry("Long", strategy.long)
if (possig == -1)
    strategy.entry("Short", strategy.short)
// barcolor(possig == -1 ? red: possig == 1 ? green : blue )
plot(nFish, color=green, title="Fisher")
plot(nz(nFish[1]), color=red, title="Trigger")
Detail
https://www.fmz.com/strategy/439975
Last Modified
2024-01-25 14:22:36