Name
Ichimoku-Entries策略Ichimoku-Entries-Strategy
Author
ChaoZhang
Strategy Description
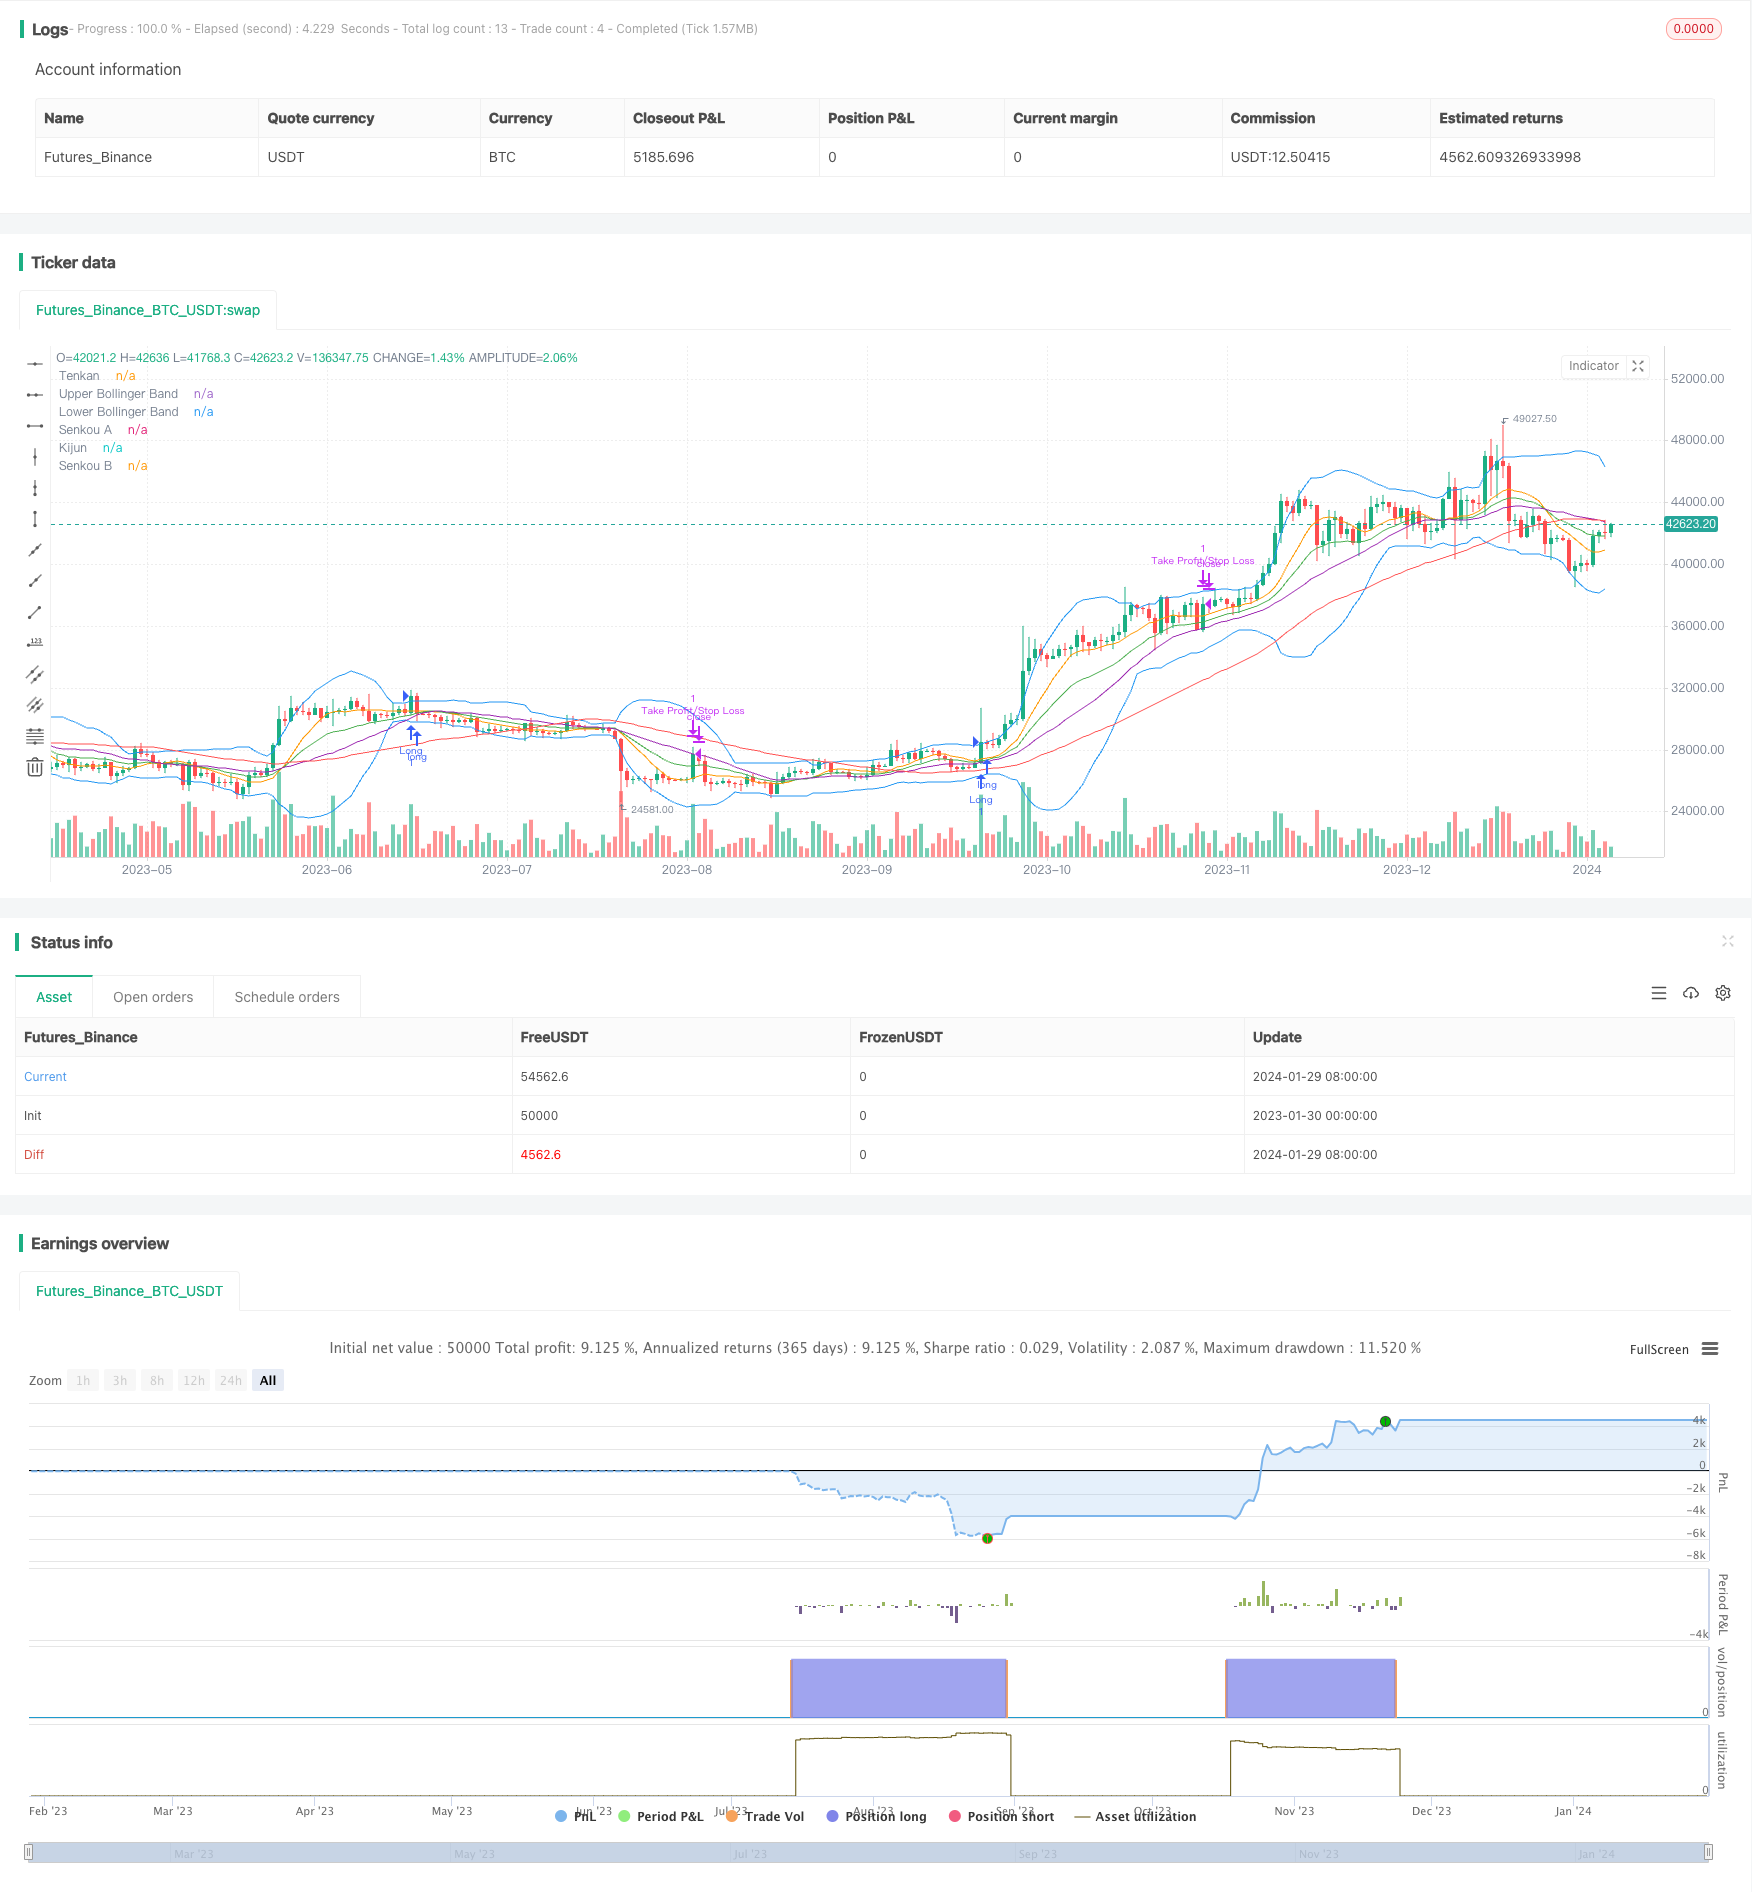
Ichimoku Entries是一个利用Ichimoku云图指标识别趋势方向,并结合布林带、RSI指标发出交易信号的量化策略。该策略主要根据十转线和基线的金叉死叉,判断目前处于多头市场还是空头市场,从而产生长仓和短仓的入场信号。
该策略主要利用Ichimoku云图的两个重要线——十转线和基线。十转线是最近9天的最高价和最低价的平均值,代表短期趋势。基线是最近26天的最高价和最低价的平均值,代表中长期趋势。当短期线十转线上穿中长期线基线时,代表入场做多;当十转线下穿基线时,代表入场做空。这样就判断了目前的趋势方向。
除了Ichimoku云图以外,策略还检测布林带和RSI指标来发出交易信号。只有当收盘价突破布林带上轨或下轨,即表明价格出现异常;同时结合RSI指标判断是否处于超买超卖区域,过滤掉部分假突破情况,从而产生入场信号。
在退出逻辑上,策略判断布林带突破是否成功,以及交易氛围指标TPO是否发生零轴穿越,来确定盈利或止损退出。
该策略最大的优势在于同时利用趋势判断和异常波动来确定交易方向。Ichimoku云图可清晰判断趋势,布林带则可捕捉异常波动。RSI指标可有效过滤假突破。多种指标配合使用,可确保交易信号更加可靠。此外,策略加入止损和止盈逻辑,可锁定盈利,避免巨额损失。
尽管具备识别趋势和异常波动的优势,该策略仍存在一定的风险。由于是追踪趋势进行交易,因此在震荡行情中容易出现较多的虚假信号。此外,参数设置不当也会影响策略表现。建议采用步进优化方法来测试不同参数组合,确定最佳参数。
该策略可从以下几个方面进行优化:
- 测试不同的参数组合,如布林带天数、RSI天数等;
- 增加机器学习算法,根据历史数据训练模型,动态输出参数;
- 结合信息流判断市场情绪,避免在关键时刻作出错误决策;
- 增加止损方式,如随价格移动止损,保持盈利
Ichimoku Entries策略是一个多指标融合的趋势追踪策略。它同时判断趋势方向和价格异常,比较可靠地把握市场节奏。虽然仍有改进空间,但整体来说是一种表现稳定、风险可控的量化交易策略。参数优化和机器学习引入可使该策略的效果更加出色。
||
The Ichimoku Entries is a quantitative strategy that identifies trend direction using Ichimoku cloud charts, and generates trading signals in combination with Bollinger Bands and RSI indicators. This strategy mainly determines whether the market is currently in an uptrend or downtrend based on the golden cross or death cross of the Tenkan Line and Kijun Line, and thus produces entry signals for long and short positions.
The core of this strategy lies in the two important lines of the Ichimoku cloud chart - Tenkan Line and Kijun Line. The Tenkan Line is the average of the highest high and lowest low over the last 9 days, representing the short-term trend. The Kijun Line is the average of the highest high and lowest low over the last 26 days, representing the medium to long-term trend. When the Tenkan Line crosses above the Kijun Line, it signals an entry to go long. When the Tenkan Line falls below the Kijun Line, it signals an entry to go short. This judgments the current trend direction.
In addition to the Ichimoku cloud, the strategy also looks at the Bollinger Bands and RSI indicator to generate trading signals. It is considered a sign of abnormal price activity when the closing price breaks through the upper or lower Bollinger Bands. Filtering out some false breakouts by incorporating the RSI indicator to determine overbought or oversold conditions, valid entry signals can thus be produced.
On the exit logic, the strategy checks whether the Bollinger Bands breakout is successful and if the Trade Proximity Oscillator crosses the 0-axis, to decide on locking in profits or stopping losses.
The biggest advantage of this strategy is that it combines trend determination and abnormal price fluctuations to ascertain trade direction. The Ichimoku cloud clearly reveals the trend, while Bollinger Bands capture anomalies. RSI effectively filters out false breakouts. The use of multiple coordinated indicators makes the trading signals more reliable. In addition, the stop loss and take profit logic helps lock in profits and avoid huge losses.
Despite having the edge to identify trends and anomalies, the strategy still poses some risks. Because it trades along with trends, plenty of false signals may emerge in ranging markets. Improper parameter settings can also deteriorate the strategy's performance. Stepwise optimization is recommended to test different parameter combinations and find the optimum values.
The strategy can be upgraded in the following aspects:
- Test different parameter combinations, like Bollinger period, RSI period, etc.
- Introduce machine learning models, dynamically output parameters based on historical data.
- Incorporate information flow to determine market emotion, avoid wrong moves at critical moments.
- Add conditional stop loss methods, like trailing stop, to preserve profits.
The Ichimoku Entries Strategy is a multi-indicator integrated trend trading strategy. By judging both trend direction and price abnormalities, it captures market rhythm fairly reliably. Although there is room for improvement, overall speaking this is a strategy with consistent performance and controllable risks. Parameter tuning and introduction of machine learning could make this strategy even more outstanding.
[/trans]
Strategy Arguments
| Argument | Default | Description |
|---|---|---|
| v_input_1 | 14 | RSI Length |
| v_input_2 | 20 | Bollinger Bands Length |
| v_input_3 | 2 | Bollinger Bands Multiplier |
| v_input_4 | true | Stop Loss Percentage |
| v_input_5 | 2 | Take Profit Percentage |
| v_input_6 | 14 | Channels Length |
| v_input_7 | 2 | Channels Multiplier |
| v_input_8 | 14 | ATR Length |
| v_input_9 | 1.5 | Threshold Percentage (%) |
Source (PineScript)
/*backtest
start: 2023-01-30 00:00:00
end: 2024-01-30 00:00:00
period: 1d
basePeriod: 1h
exchanges: [{"eid":"Futures_Binance","currency":"BTC_USDT"}]
*/

//@version=5
strategy("ichi strategy", overlay=true)

// Input parameters
rsiLength = input(14, title="RSI Length")
bbLength = input(20, title="Bollinger Bands Length")
bbMultiplier = input(2, title="Bollinger Bands Multiplier")
stopLossPct = input(1, title="Stop Loss Percentage")
takeProfitPct = input(2, title="Take Profit Percentage")

// Calculate Ichimoku Cloud components
tenkan = ta.sma(high + low, 9) / 2
kijun = ta.sma(high + low, 26) / 2
senkouA = (tenkan + kijun) / 2
senkouB = ta.sma(high + low, 52) / 2

// Bollinger Bands
basis = ta.sma(close, bbLength)
upperBB = basis + bbMultiplier * ta.stdev(close, bbLength)
lowerBB = basis - bbMultiplier * ta.stdev(close, bbLength)

// RSI
rsiValue = ta.rsi(close, rsiLength)

// Trade Proximity Oscillator
length = input(14, title="Channels Length")
multiplier = input(2, title="Channels Multiplier")
atr_length = input(14, title="ATR Length")
threshold_percentage = input(1.5, title="Threshold Percentage (%)")

ma = ta.sma(close, length)
std_dev = ta.stdev(close, length)
upper_band = ma + multiplier * std_dev
lower_band = ma - multiplier * std_dev
distance_upper = close - upper_band
distance_lower = lower_band - close
atr_value = ta.atr(atr_length)
threshold = atr_value * threshold_percentage
oscillator = distance_upper - distance_lower

// Strategy logic
longCondition = close > upperBB and tenkan > kijun and ta.crossover(close, basis) and rsiValue < 70
shortCondition = close < lowerBB and tenkan < kijun and ta.crossunder(close, basis) and rsiValue > 30

strategy.entry("Long", strategy.long, when = longCondition)
strategy.entry("Short", strategy.short, when = shortCondition)

// Exit logic
longExitCondition = close < upperBB and ta.crossover(oscillator, 0)
shortExitCondition = close > lowerBB and ta.crossunder(oscillator, 0)

strategy.exit("Take Profit/Stop Loss", from_entry="Long", loss=close - close * stopLossPct / 100, profit=close + close * takeProfitPct / 100, when = longExitCondition)
strategy.exit("Take Profit/Stop Loss", from_entry="Short", loss=close + close * stopLossPct / 100, profit=close - close * takeProfitPct / 100, when = shortExitCondition)

// Plotting
plot(senkouA, color=color.green, title="Senkou A")
plot(senkouB, color=color.red, title="Senkou B")
plot(upperBB, color=color.blue, title="Upper Bollinger Band")
plot(lowerBB, color=color.blue, title="Lower Bollinger Band")

// Additional Plots
plot(tenkan, color=color.orange, title="Tenkan")
plot(kijun, color=color.purple, title="Kijun")
Detail
https://www.fmz.com/strategy/440546
Last Modified
2024-01-31 15:23:21
