Name
RSI收敛破位趋势震荡停损策略Price-Drop-Buy-Strategy-in-Downtrend-with-Stop-Loss
Author
ChaoZhang
Strategy Description
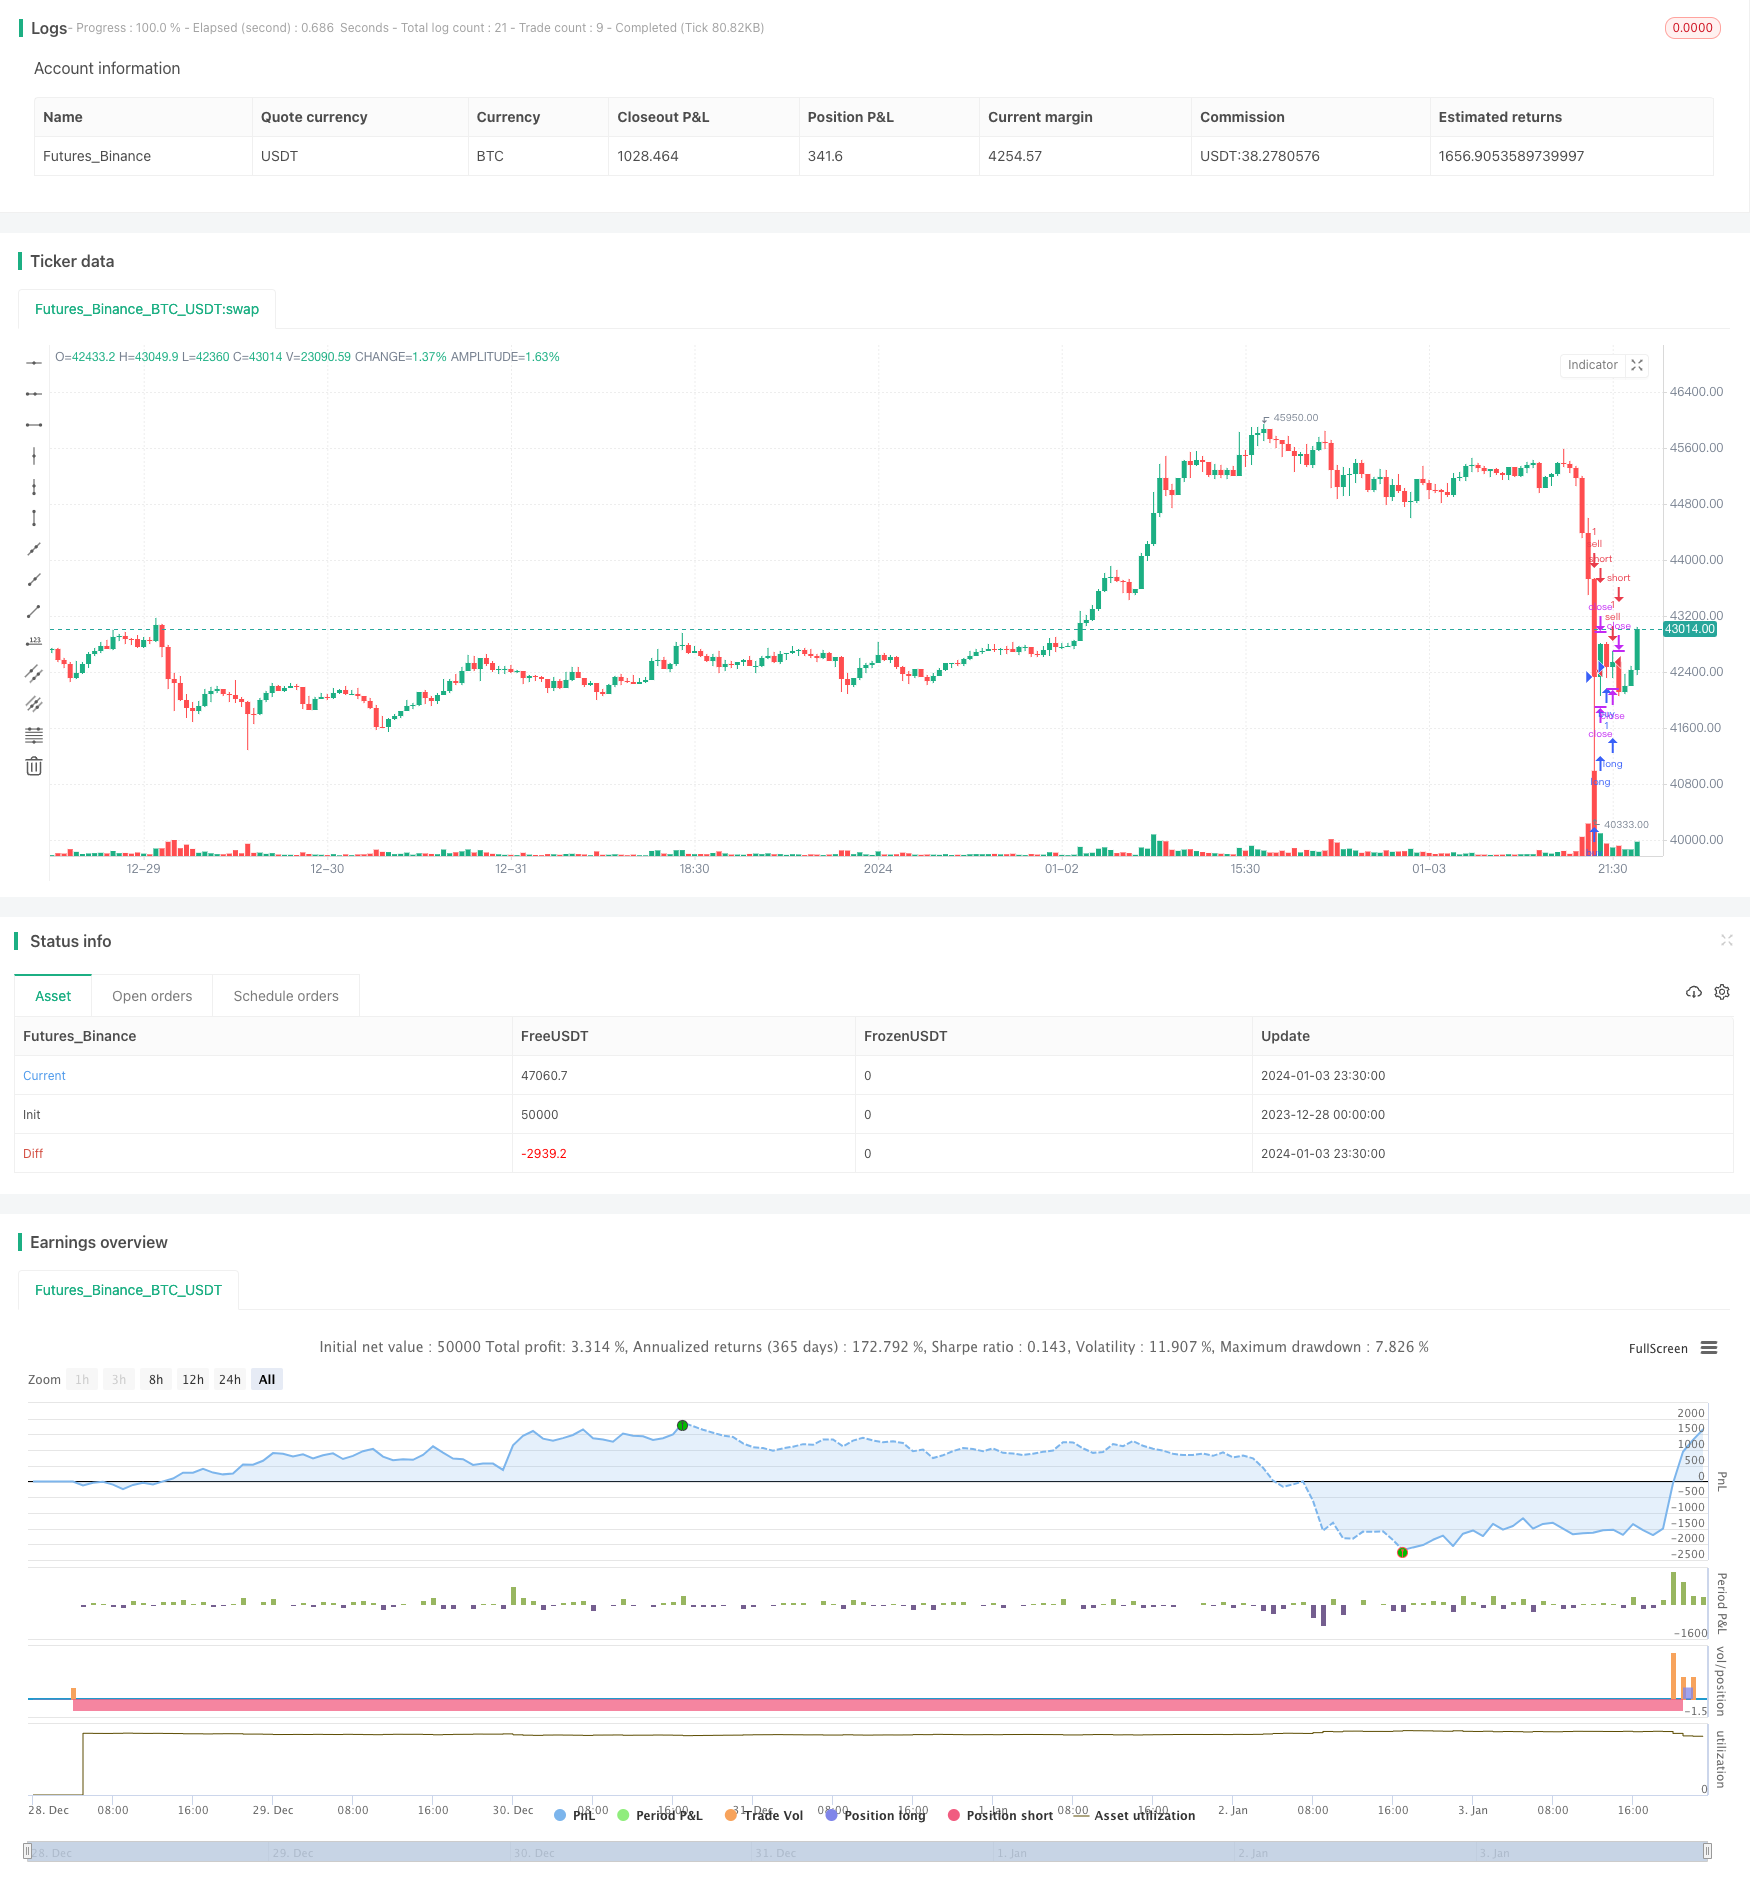
该策略采用 RSI 指标判断市场潜在趋势方向,结合布林带指标识别关键支撑阻力区域,在趋势震荡行情中寻找低吸机会建仓做多,在超买区域止盈止损。
-
使用 RSI 指标判断市场潜在趋势方向。RSI 低于 40 视为超卖区域,市场有转多的可能;RSI 高于 50 视为超买区域,市场有转空的可能。
-
使用布林带指标识别关键支撑阻力区域。布林带中轨为价格的移动平均线,上下轨构成价格的标准差通道。价格接近下轨时为低吸机会区域。
-
当 RSI<40 且价格接近布林带下轨时,判断为低吸做多机会,采取建立多头仓位。
-
当 RSI>50 或止盈超过 50% 时,平掉多头仓位止盈止损。
-
使用 RSI 判定市场潜在趋势方向,避免逆势建仓。
-
结合布林带寻找低吸机会点,精确定位建仓时机。
-
采用趋势震荡思路,防止被套持。
-
灵活的止盈止损机制,保证盈利最大化。
-
布林带参数不恰当可能导致无法正确定位支撑区域。
-
顺势突破或假突破可能造成超买超卖判断错误。
-
止盈止损点设置不当可能造成过早离场或亏损扩大。
-
优化布林带参数,使支撑阻力区域识别更加准确。
-
结合 MACD、KDJ 等其他指标过滤虚假信号。
-
动态优化止盈止损算法,在保证盈利的同时最大限度减少亏损。
该策略通过 RSI 判定潜在趋势方向,辅以布林带识别支撑区域,实现低买高卖,是一个典型的趋势震荡策略。通过一定优化,可以成为一个可靠稳定盈利的量化策略。
||
This strategy uses the RSI indicator to determine the potential market trend direction, combined with the Bollinger Bands indicator to identify key support and resistance areas, and looks for low absorption opportunities in trend shock markets to establish long positions and take profits at overbought areas.
-
Use the RSI indicator to determine the potential market trend direction. RSI below 40 is considered an oversold area where the market could turn bullish. RSI above 50 is considered an overbought area where the market could turn bearish.
-
Use the Bollinger Bands indicator to identify key support and resistance areas. The middle band of Bollinger Bands is the moving average line of price, and the upper and lower bands form the standard deviation channel of price. Prices approaching the lower band present low absorption opportunities.
-
When RSI <40 and price approaches the Bollinger lower band, it is determined as a low absorption long opportunity to establish a long position.
-
When RSI >50 or profits exceed 50%, close long positions to take profits and cut losses.
-
Use RSI to determine potential market trend direction to avoid trading against the trend.
-
Identify precise entry timing combining with Bollinger Bands to locate low absorption points.
-
Adopt trend shock methodology to prevent being trapped.
-
Flexible stop profit and stop loss mechanism to maximize profits.
-
Improper Bollinger parameters may fail to correctly locate the support area.
-
Trend breakthroughs or false breakthroughs could lead to errors in overbought and oversold judgements.
-
Improper stop profit and stop loss points setting may lead to premature exit or enlarged losses.
-
Optimize Bollinger parameters for more accurate identification of support and resistance areas.
-
Incorporate other indicators like MACD and KDJ to filter false signals.
-
Dynamically optimize stop profit and stop loss algorithms to maximize profits while minimizing losses.
This strategy determines potential trend direction with RSI, combined with Bollinger Bands to identify support areas, realizing low buy high sell, which is a typical trend shock strategy. With proper optimization, it can become a reliable and stable profitable quantitative strategy.
[/trans]
Strategy Arguments
| Argument | Default | Description |
|---|---|---|
| v_input_1 | true | From Month |
| v_input_2 | true | From Day |
| v_input_3 | 2018 | From Year |
| v_input_4 | true | To Month |
| v_input_5 | true | To Day |
| v_input_6 | 9999 | To Year |
| v_input_7 | 60 | RSI Period Length |
| v_input_8 | 20 | Bollinger Period Length |
Source (PineScript)
/*backtest
start: 2023-12-28 00:00:00
end: 2024-01-04 00:00:00
period: 30m
basePeriod: 15m
exchanges: [{"eid":"Futures_Binance","currency":"BTC_USDT"}]
*/

//@version=3
strategy("price drop buy in", overlay=true, initial_capital=1000, max_bars_back=24)

// === INPUT BACKTEST RANGE ===
FromMonth = input(defval = 1, title = "From Month", minval = 1, maxval = 12)
FromDay   = input(defval = 1, title = "From Day", minval = 1, maxval = 31)
FromYear  = input(defval = 2018, title = "From Year", minval = 2017)
ToMonth   = input(defval = 1, title = "To Month", minval = 1, maxval = 12)
ToDay     = input(defval = 1, title = "To Day", minval = 1, maxval = 31)
ToYear    = input(defval = 9999, title = "To Year", minval = 2017)

// === FUNCTION EXAMPLE ===
start     = timestamp(FromYear, FromMonth, FromDay, 00, 00)  // backtest start window
finish    = timestamp(ToYear, ToMonth, ToDay, 23, 59)        // backtest finish window
window()  => true // create function "within window of time"


///////////// RSI
RSIlength = input(60,title="RSI Period Length")
RSIoverSold = 40
RSIoverBought = 50
price = close
vrsi = rsi(close, RSIlength)

smaLong = sma(close,80)
smaShort = sma(close,40)

///////////// Bollinger Bands
BBlength = input(20, minval=1,title="Bollinger Period Length")
BBmult = 2 // input(2.0, minval=0.001, maxval=50,title="Bollinger Bands Standard Deviation")
BBbasis = sma(price, BBlength)
BBdev = BBmult * stdev(price, BBlength)
BBupper = BBbasis + BBdev
BBlower = BBbasis - BBdev

longcondition = (price < BBlower and vrsi < RSIoverSold)

    // vrsi < RSIoverSold

shortcondition = (RSIoverBought and strategy.openprofit > 50 )  or price > BBupper


if(longcondition)
    strategy.entry('buy', strategy.long, when = window())

if(shortcondition)
    strategy.entry('sell', strategy.short, when = window())
Detail
https://www.fmz.com/strategy/437773
Last Modified
2024-01-05 14:18:05
