-
Notifications
You must be signed in to change notification settings - Fork 0
/
making-sense-census-presentation.qmd
462 lines (306 loc) · 11.9 KB
/
making-sense-census-presentation.qmd
1
2
3
4
5
6
7
8
9
10
11
12
13
14
15
16
17
18
19
20
21
22
23
24
25
26
27
28
29
30
31
32
33
34
35
36
37
38
39
40
41
42
43
44
45
46
47
48
49
50
51
52
53
54
55
56
57
58
59
60
61
62
63
64
65
66
67
68
69
70
71
72
73
74
75
76
77
78
79
80
81
82
83
84
85
86
87
88
89
90
91
92
93
94
95
96
97
98
99
100
101
102
103
104
105
106
107
108
109
110
111
112
113
114
115
116
117
118
119
120
121
122
123
124
125
126
127
128
129
130
131
132
133
134
135
136
137
138
139
140
141
142
143
144
145
146
147
148
149
150
151
152
153
154
155
156
157
158
159
160
161
162
163
164
165
166
167
168
169
170
171
172
173
174
175
176
177
178
179
180
181
182
183
184
185
186
187
188
189
190
191
192
193
194
195
196
197
198
199
200
201
202
203
204
205
206
207
208
209
210
211
212
213
214
215
216
217
218
219
220
221
222
223
224
225
226
227
228
229
230
231
232
233
234
235
236
237
238
239
240
241
242
243
244
245
246
247
248
249
250
251
252
253
254
255
256
257
258
259
260
261
262
263
264
265
266
267
268
269
270
271
272
273
274
275
276
277
278
279
280
281
282
283
284
285
286
287
288
289
290
291
292
293
294
295
296
297
298
299
300
301
302
303
304
305
306
307
308
309
310
311
312
313
314
315
316
317
318
319
320
321
322
323
324
325
326
327
328
329
330
331
332
333
334
335
336
337
338
339
340
341
342
343
344
345
346
347
348
349
350
351
352
353
354
355
356
357
358
359
360
361
362
363
364
365
366
367
368
369
370
371
372
373
374
375
376
377
378
379
380
381
382
383
384
385
386
387
388
389
390
391
392
393
394
395
396
397
398
399
400
401
402
403
404
405
406
407
408
409
410
411
412
413
414
415
416
417
418
419
420
421
422
423
424
425
426
427
428
429
430
431
432
433
434
435
436
437
438
439
440
441
442
443
444
445
446
447
448
449
450
451
452
453
454
455
456
457
458
459
460
461
462
---
title: "Making Sense of the US Census"
author:
- name: Pete Lawson
email: plawson@jhu.edu
role: Data and Visualization Librarian
degrees: PhD
affiliations:
- name: Data Services
format:
revealjs:
theme: presentation.scss
footer: "Data Bytes - Fall 2024"
chalkboard:
buttons: true
chalk-effect: 0.1
title-slide-attributes:
data-background-image: /images/adobe-map.jpeg
data-background-size: contain
data-background-opacity: "0.4"
---
##

## History of the US Census {.smaller}
::: {.fragment}
Section 2 of the U.S. Constitution states:
>“The actual enumeration shall be made within three years after the first meeting of the Congress of the United States, and within every subsequent term of ten years, in such manner as they shall by law direct." ^[https://www.census.gov/programs-surveys/decennial-census/about/census-constitution.html]
:::
::: {.fragment}
The decennial census began in August 2, 1790, under the supervision of the Secretary of State, Thomas Jefferson.
:::
## History of the US Census {.smaller}
:::: {.columns}
::: {.column width="50%"}
U.S. Marshalls conduct the first census, which was little more than a count of our population, which asks six questions:
::: {.fragment fragment-index=1 .smaller}
- Name of the head of the family
- Number of
- free white males 16 years and up
- free white males under 16 years
- free white females
- all other free persons
- slaves
:::
:::
::: {.column width="50%"}

:::
::::
::: footer
[A Timeline of the Census History](https://www.census.gov/history/img/timeline_census_history.bmp)
:::
## History of the US Census {.smaller}
. . .
By the turn of the century, the demographic, agricultural, and economic segments of the decennial census collected information on hundreds of topics.
. . .
Recognizing the growing complexity of the decennial census, Congress created a permanent Census Office within the Department of the Interior on March 6, 1902.
. . .
On July 1, 1902, the U.S. Census Bureau officially "opened its doors".
## Innovations {.smaller}
:::: {.columns}
::: {.column width="50%"}
Herman Hollerith, a U.S. Census Bureau employee during the 1880 census, revolutionized a means of coding and tallying information for the 1890 census, using punch cards.
::: {.fragment}
Hollerith formed the Tabulating Machine Company, which later became part of what is now International Business Machines, or IBM Corporation.
:::
:::
::: {.column width="50%"}
![A Census Bureau clerk tabulates data using a Hollerith Machine.^[https://www.census.gov/history/www/homepage_archive/2016/january_2016.html]](https://www.census.gov/history/img/HollerithMachine.jpg)
:::
::::
## Pioneers in Computing {.smaller}
:::: {.columns}
::: {.column width="50%"}
The Electronic Numeric Integrator and Computer or ENIAC was the first programmable, electronic, general-purpose digital computer, used by the War Department's Ballistic Research Laboratory. ^[https://www.census.gov/history/www/innovations/technology/univac_i.html]
::: {.fragment}
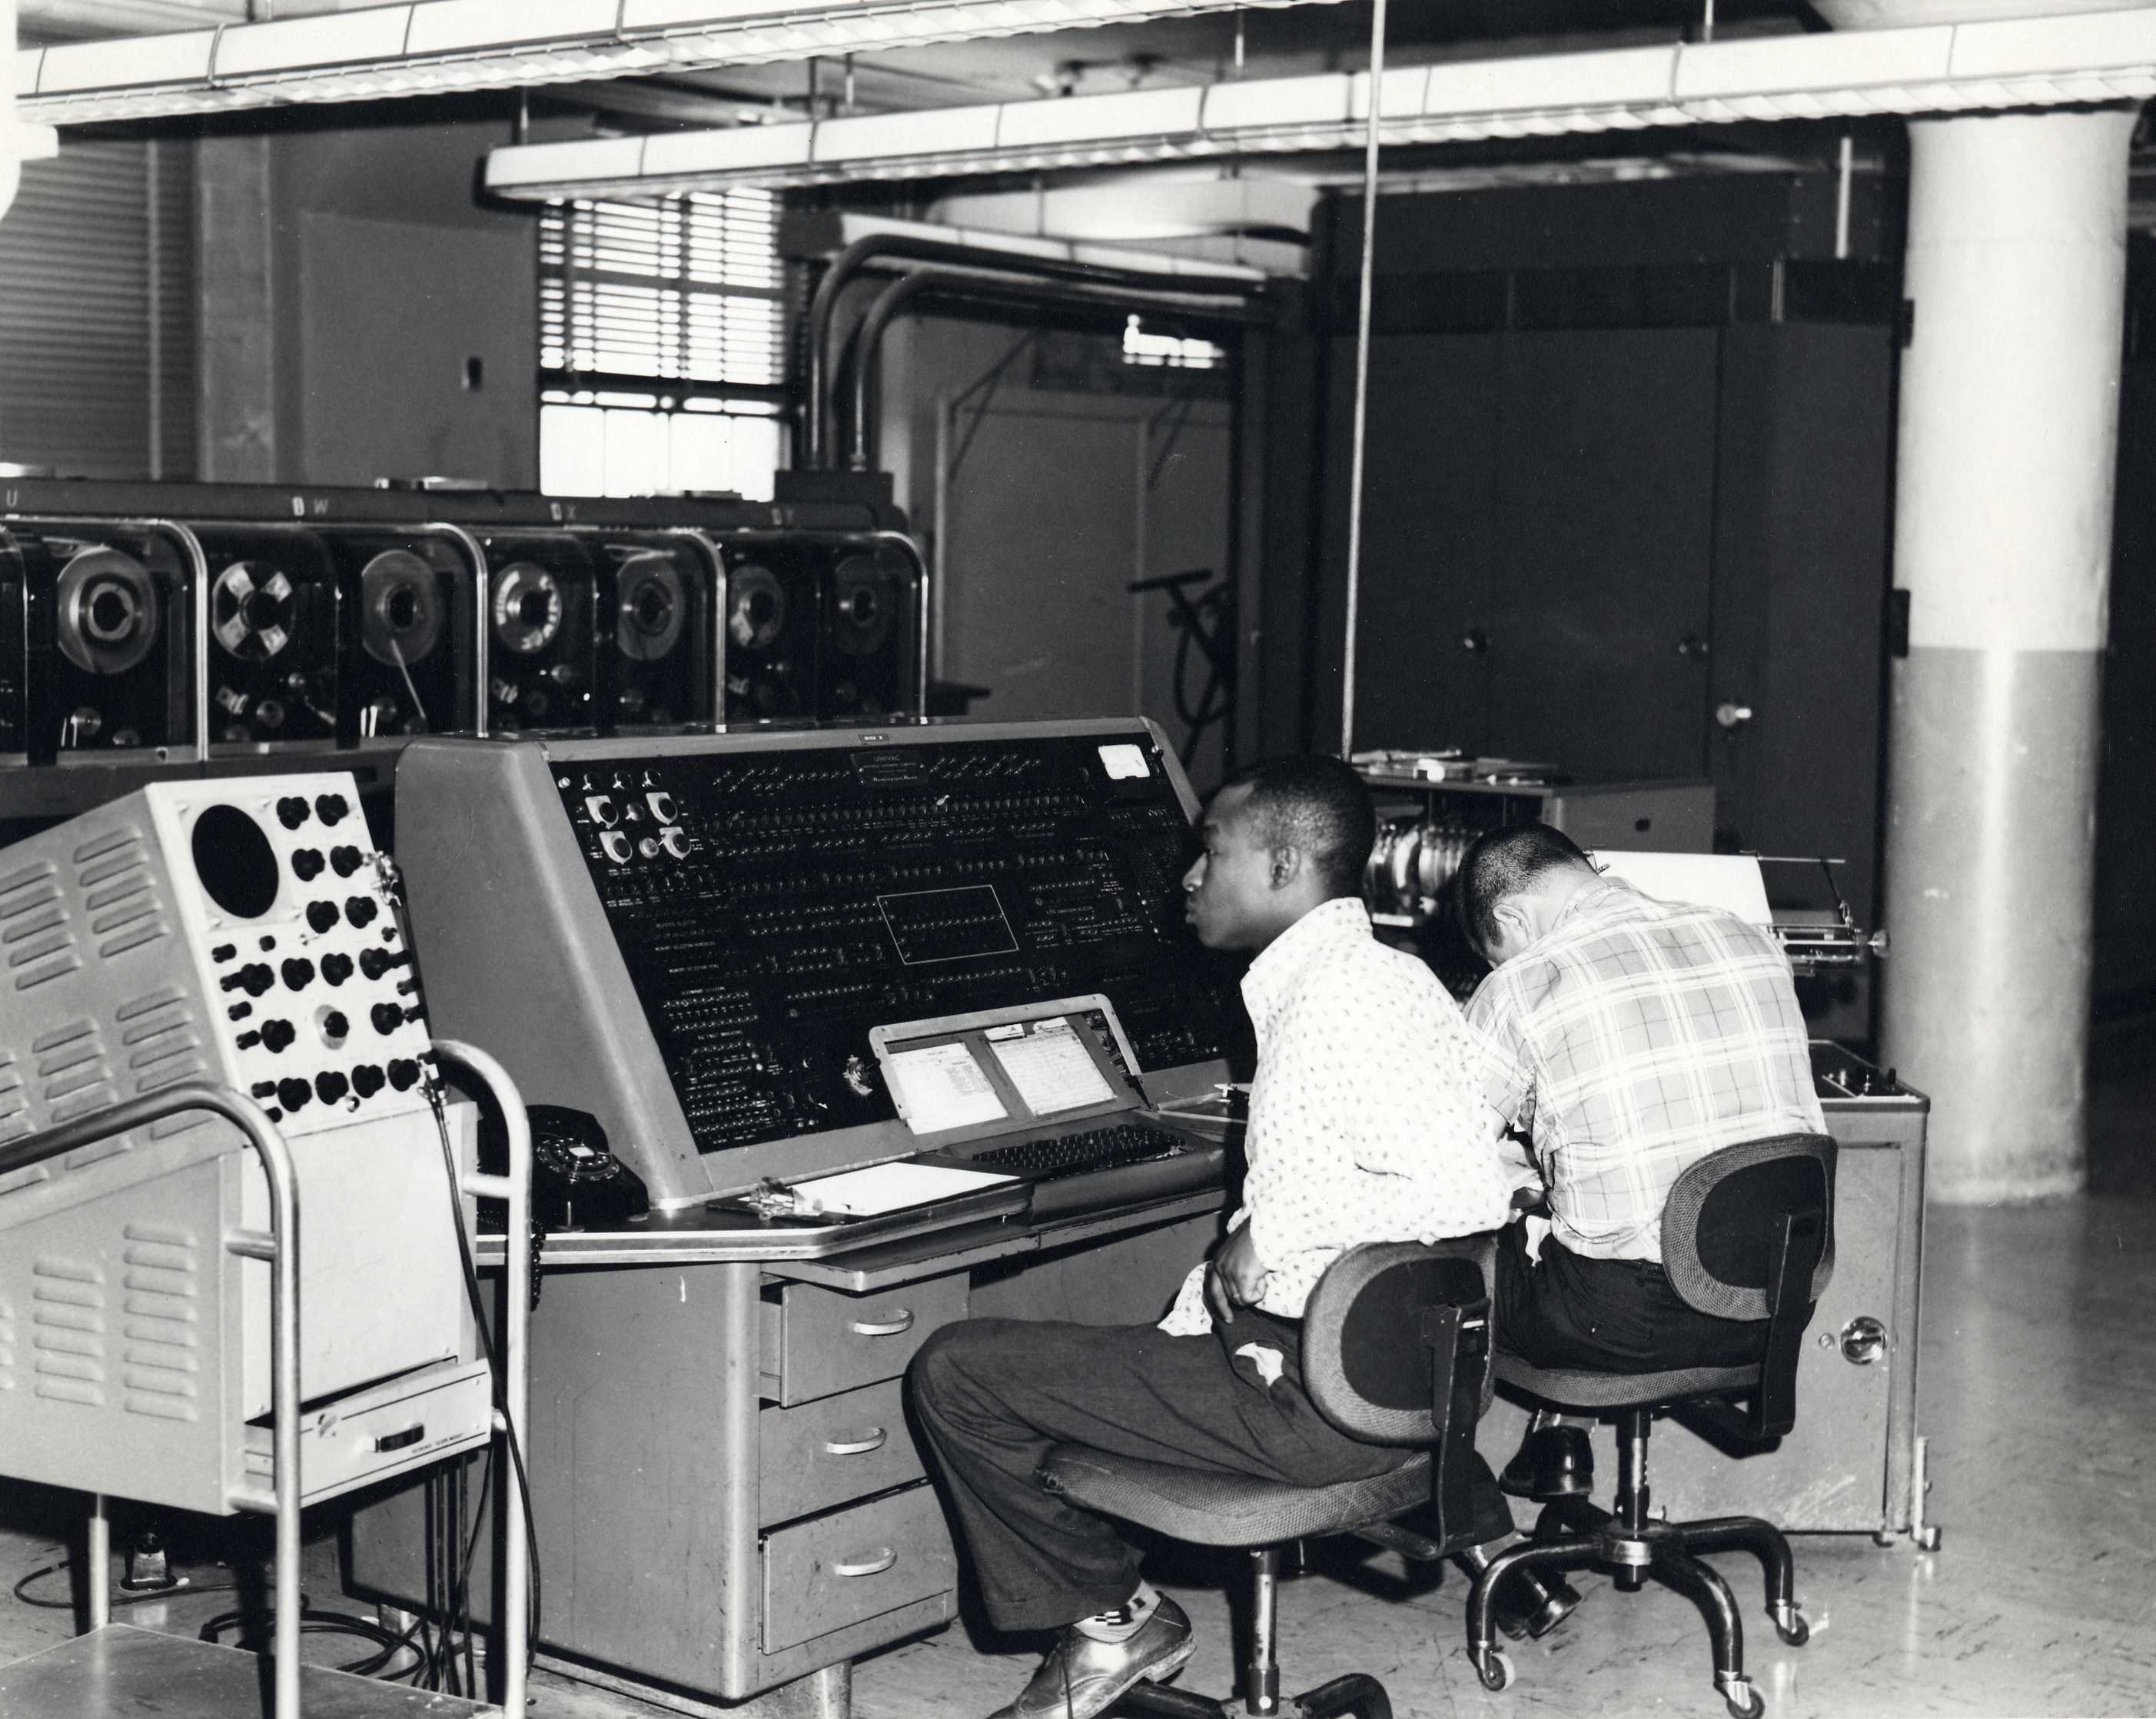
During the ENIAC project, the lead engineer on the ENIAC met with several Census Bureau officials to discuss non-military applications for electronic computing devices. The final result were specifications for the Universal Automatic Computer, or UNIVAC.
:::
:::
::: {.column width="50%"}
::: {.fragment}
:::
:::
::::
## Finding Census Data {.smaller}
Begin with a research question.
> "What is the education attainment in my community"?
. . .
There are three questions to consider:
::: {.incremental}
1. What data [topics]{style="color:#205493;"} are covered by the various surveys?
2. [Where]{style="color:#205493;"} does the data come from?
3. What [geographies]{style="color:#205493;"} does the Census Bureau publish data for?
:::
## What [topics]{style="color:#205493;"} are covered by the various surveys? {.smaller}
The Census Bureau measures the economy, people, and places. The Bureau publishes
statistics on many topics:
::: {.incremental}
- **Demographic**: Sex, Age, Race, Hispanic Origin, Housing Units
- **Social**: Education, Marital Status, Fertility, Grandparents
- **Housing**: Occupancy, Housing Value & Costs, Utilities
- **Economic**: Income & Poverty, Employment, Occupation, Industry
:::
::: {.fragment}
> "What is the [education]{style="color:#205493;"} attainment in my community"?
:::
## [Where]{style="color:#205493;"} does the data come from? {.smaller}
. . .
There are over 130 surveys and censuses.
. . .
Data is published at different times, in different frequencies, and for different geographies.
Some are published monthly, some yearly, and even once every ten years, as is the case with the decennial census.
## [Where]{style="color:#205493;"} does the data come from? {.smaller}
:::: {.columns}
::: {.column width="50%"}
One tool we can use is the [Census Survey Explorer](https://www.census.gov/data/data-tools/survey-explorer/)
::: {.fragment}
The Census Survey can help you discover which surveys have the topics, geographies, and frequency of release that you are interested in.
:::
:::
::: {.column width="50%"}

:::
::::
::: footer
[Survey Explorer](https://www.census.gov/data/data-tools/survey-explorer/)
:::
## What [geographies]{style="color:#205493;"} does the Census Bureau publish data for? {.smaller}
. . .
> "What is the education attainment in my [community]{style="color:#205493;"}"?
:::{.fragment}
We know the American Community Survey (ACS) has social characteristics for many geographies.
:::
## We need to define our [community]{style="color:#205493;"}! {.smaller}
:::{.fragment}
State
:::
:::{.fragment}
or County
:::
::: {.fragment}
or Neighborhood
:::
::: {.fragment}
or Block?
:::
::: {.fragment}
If your community is below [65,000]{style="color:#205493;"}, you need the 5 year ACS estimates. If it is [65,000]{style="color:#205493;"} or greater, you can select either the 1 year or 5 year estimates.
:::
## Geography {.smaller}
:::: {.columns}
::: {.column width="50%"}
:::
::: {.column width="50%"}

:::
::::
##

## Geography {.smaller}
:::: {.columns}
::: {.column width="50%"}
:::
::: {.column width="50%"}

:::
::::
## Census Designated Place (CDP) {.smaller}
:::: {.columns}
::: {.column width="50%"}
The statistical equivalent to a place that has incorporated.
:::
::: {.column width="50%"}

:::
::::
## Census Tracts {.smaller}
:::: {.columns}
::: {.column width="50%"}
- Developed to analyze temporally.
- Bounded to include roughly 4,000 persons.
- Populations exceeding 8,000 are split into two or more smaller census tracts.
- Follow accounting boundaries, and sometimes municipal boundaries.
:::
::: {.column width="50%"}

:::
::::
## Census Block Groups and Blocks {.smaller}
:::: {.columns}
::: {.column width="50%"}
- Building block for all geographic boundaries the Census Bureau tabulates.
- Generally small in area, but larger and more irregular in suburban and rural areas.
- Rural blocks can be hundreds of square miles.
- Smallest level of geography you can get basic demographic data for, such as total population by age, sex, and race. The ACS does not include census blocks - the smallest unit is the block group.
:::
::: {.column width="50%"}

:::
::::
## ZIP Code Tabulation Areas {.smaller}
:::: {.columns}
::: {.column width="50%"}
- Published in the Decennial Census and ACS.
- ZCTA are polygonal simulations of the zip code.
- The ZCTA represents the ZIP code associated with the most addresses in a census block.
:::
::: {.column width="50%"}

:::
::::
## Censuses and Surveys {.smaller}
{width=50%}^[https://www.usda.gov/media/blog/2022/11/01/census-vs-survey-whats-difference]
## Decennial Census {.smaller}
:::: {.columns}
::: {.column width="50%"}
::: {.fragment}
The decennial census has been conducted in years ending in "0" since 1790.
:::
::: {.fragment}
Census data is also used to make decisions affecting legislation and spending on housing, highways, hospitals, schools, assistance programs, and scores of projects and programs that are vital to the health and welfare of the U.S. population and economy.
:::
::: {.fragment}
The most recent census is the 2020 decennial census.
:::
:::
::: {.column width="50%"}
![Enumerator Eileen Nolte interviews
the First Family, April 1, 1950.^[https://www.census.gov/history/www/programs/demographic/decennial_census.html]](https://www.census.gov/history/img/4-1-50-Enumeratingfirstfam.jpg)
:::
::::
## American Community Survey (ACS) {.smaller}
:::: {.columns}
::: {.column width="50%"}
::: {.incremental}
- Household survey conducted by the Census Bureau that samples about 3 1/2 million addresses each year.
- Fully implemented in 2005, arising for a need to collect social, economic, and housing data continuously through the decade.
- ACS is based on a sample of the population, whereas the Decennial Census is a count of the population.
- There are 40-plus topics available in the ACS include: demographic data, commuting, employment income, housing costs, fertility, and more.
:::
:::
::: {.column width="50%"}
^[https://www.census.gov/library/visualizations/interactive/acs-datawheel.html]
:::
::::
## Accessing Census Data {.smaller}
:::: {.columns}
::: {.column width="50%"}
### [QuickFacts](https://www.census.gov/quickfacts/)
::: {.fragment}
QuickFacts is an easy to use application that provides tables, maps, and charts of frequently requested statistics from many Census Bureau censuses, surveys, and programs.
:::
::: {.fragment}
Profiles are available for the nation, all 50 states plus the District of Columbia and Puerto Rico, and all counties. Cities and towns with a population of 5,000 or more are also included.
:::
:::
::: {.column width="50%"}
^[https://www.census.gov/data.html]
:::
::::
## Accessing Census Data {.smaller}
:::: {.columns}
::: {.column width="50%"}
### [data.census.gov](https://data.census.gov/)
A unified platform for accessing U.S. Census data.
:::
::: {.column width="50%"}
^[https://www.census.gov/content/dam/Census/gs-imports/social-media-sharing-images/social-image-CEDSCI.png]
:::
::::
## Accessing Census Data {.smaller}
### [Population Estimates Program (PEP)](https://www.census.gov/programs-surveys/popest.html)
Provides estimates of the population for the United States, states, metropolitan and micropolitan statistical areas, counties, cities, towns, as well as for Puerto Rico and its municipios.
:::: {.columns}
::: {.column width="50%"}
:::
::: {.column width="50%"}
:::
::::
## Census API {.smaller}
:::: {.columns}
::: {.column width="70%"}
::: {.fragment}
API or **A**pplication **P**rogramming **I**nterface.
:::
::: {.fragment}
An API is an interface that accepts inputs, and produces outputs.
:::
::: {.fragment}
[Available Census APIs](https://www.census.gov/data/developers/data-sets.html)
:::
::: {.fragment}
- Returns in `.html`, `.json`, and `.xml`.
:::
::: {.fragment}
Simplified API Interfaces exist in the programming languages R and Python:
- `tidycensus` is an R package that allows users to interface with a select number of the US Census Bureau’s data APIs and return tidyverse-ready data frames, optionally with simple feature geometry included.
- `census` is a Python package that provides access to ACS and Summary File 1 data sets.
:::
:::
::: {.column width="30%"}

:::
::::
## Questions?