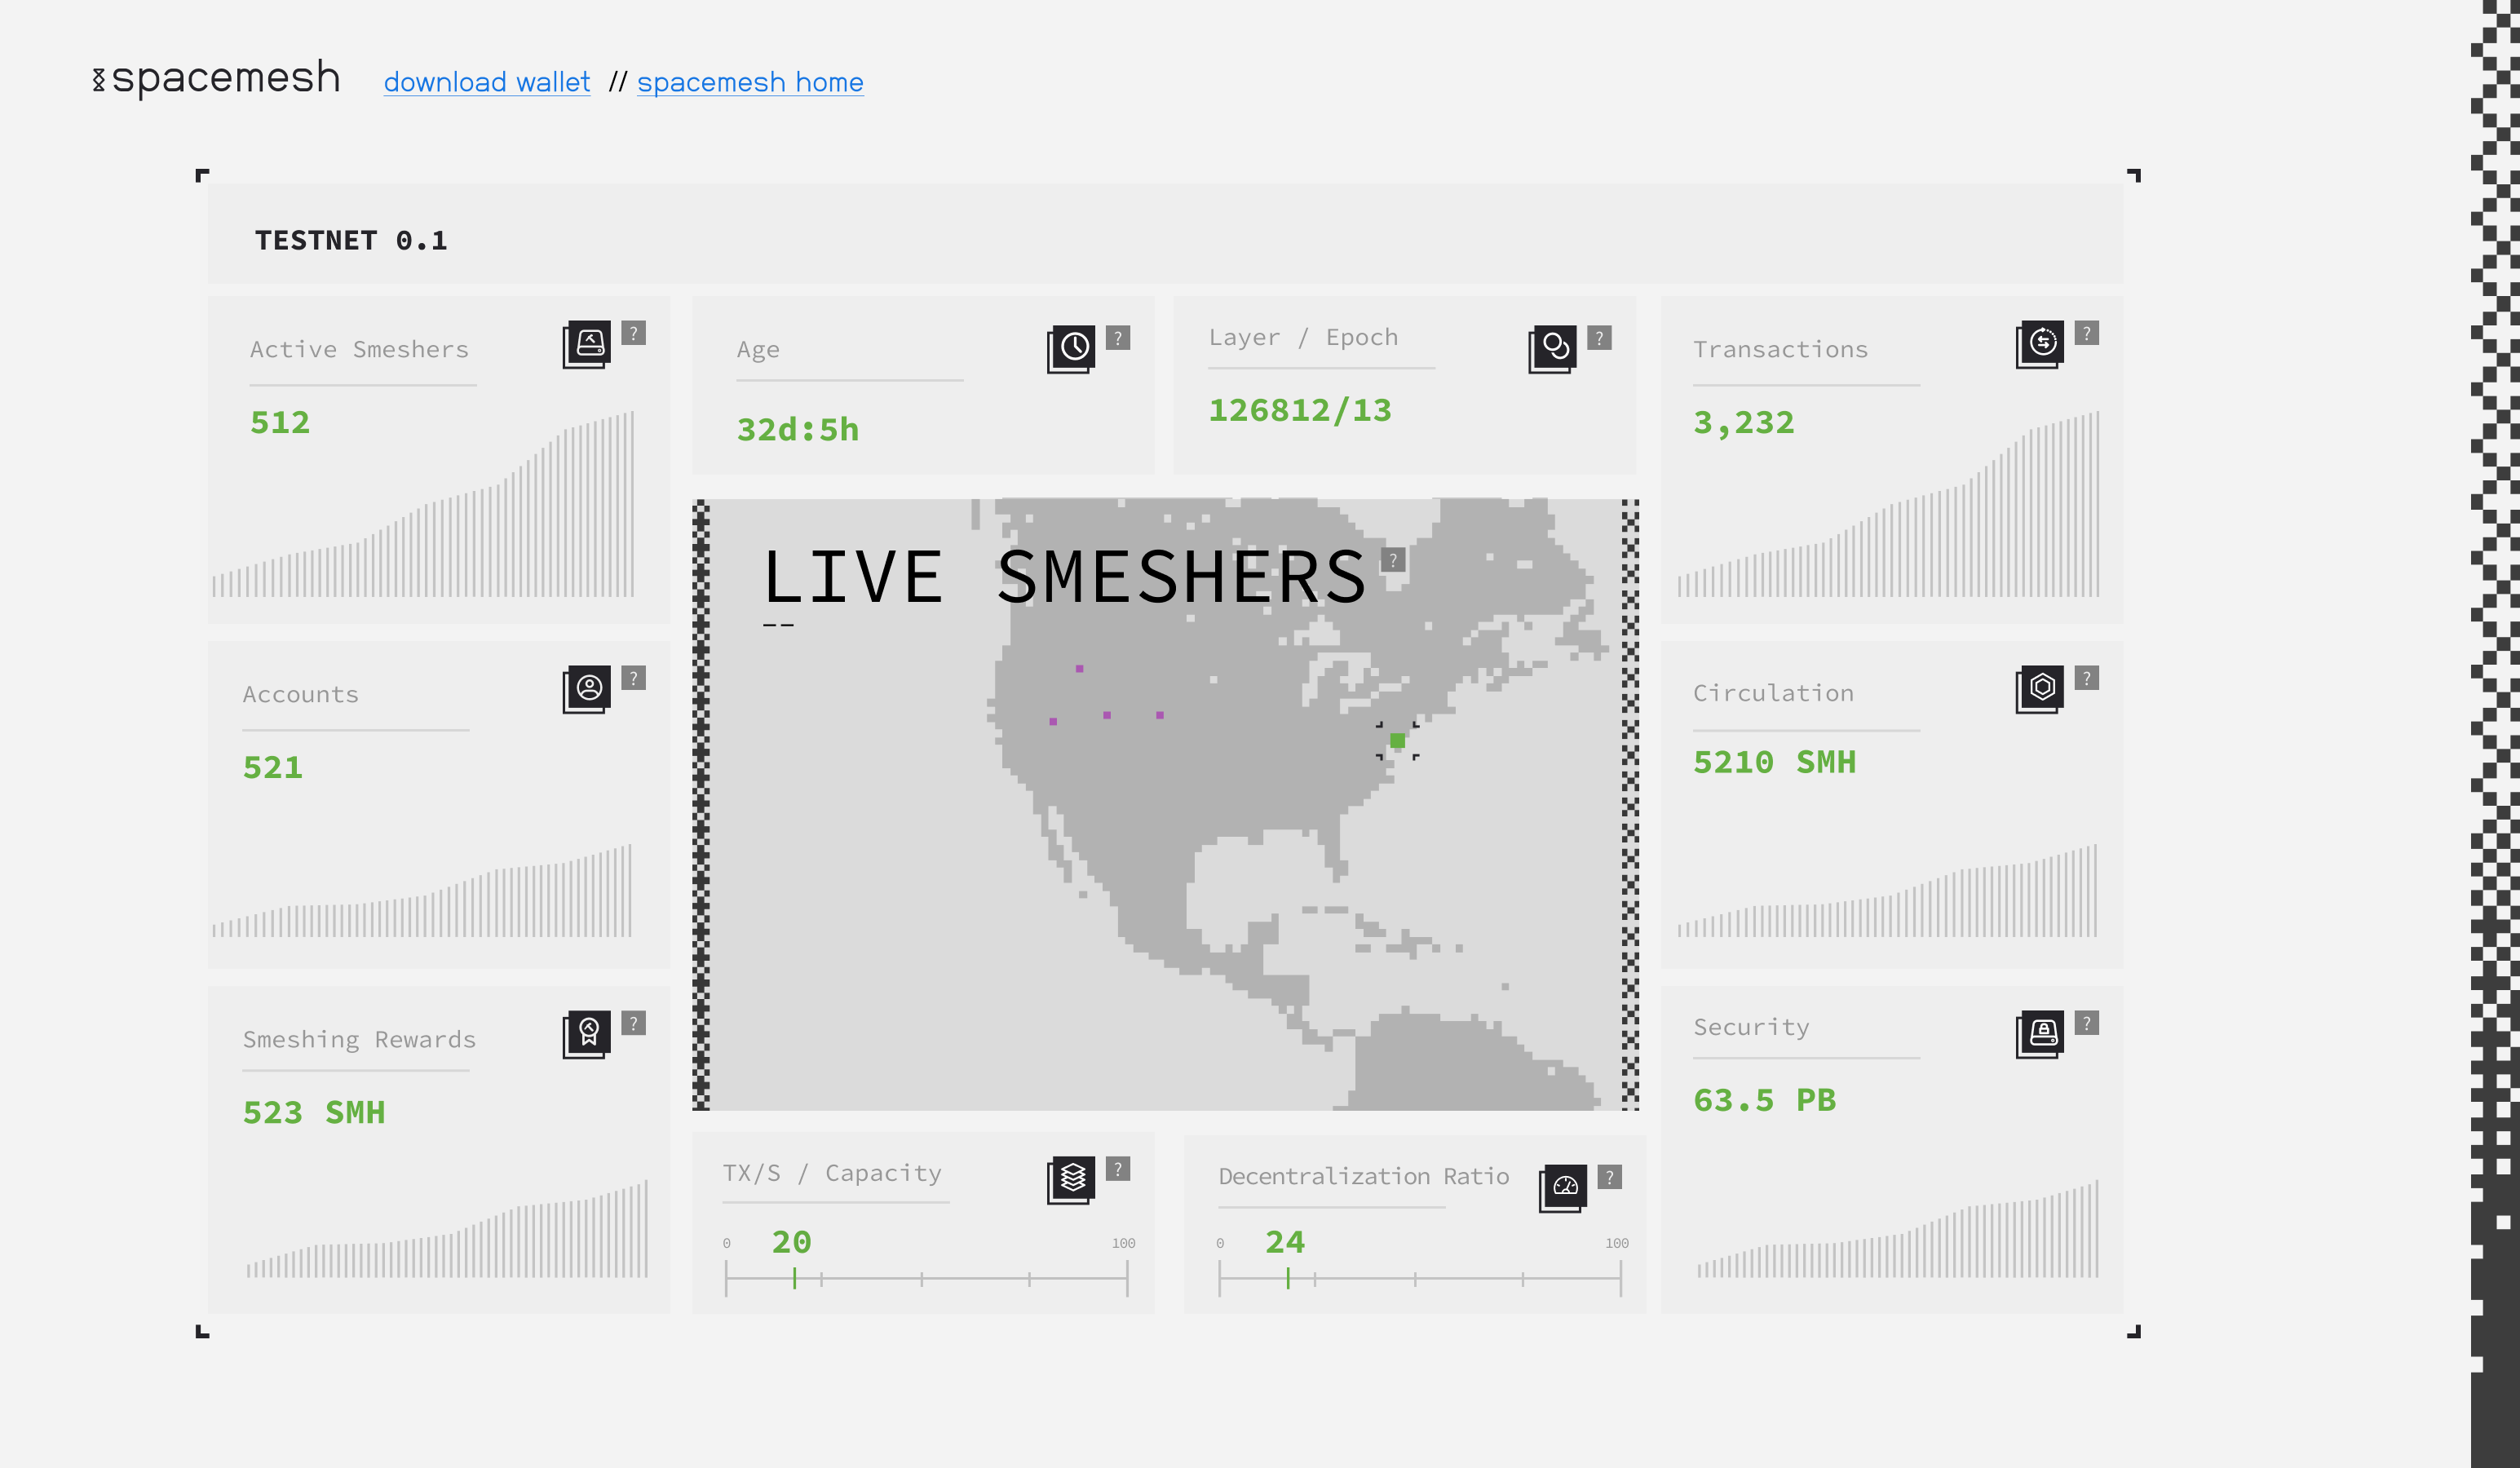
- Dynamic webpage designed for desktop-class screens with a fallback to a mobile layout
- Real time updates from the mesh - websockets or via GRPC
- Dashboard is always connected to a specific network. e.g. Open Testnet 0.1, Mainnet, etc...
- We need to be able to deploy and display a dashboard for different testnets and mainnets.
Main display: Number of active smeshers in the current epoch. Active smeshers are smeshers who have submitted at least one block in one layer in that epoch.
Graph: change over time, x-axis: epoch. y-axis: number of active smeshers.
Tooltip text: Total of active smeshers in the most recent epoch. The graph displays the number of active smeshers in previous epochs. Active smeshers are deployed Spacemesh full p2p nodes that participate in the Spacemesh consensus protocol and submit blocks with transactions to the network.
Main display: Total number of mesh accounts with a non-zero coin balance. Graph: change over time, x-axis: epoch. y-axis: total number of accounts.
Tooltip text: Current total of number of user coin accounts on the network with a non-zero coin balance. The graph displays the total number of accounts in previous epochs.
Main display: Total amount of Smesh minted as mining rewards as of the last known reward distribution event. Graph: change over time, x-axis: epoch. y-axis: total smeshing rewards up to and including that epoch.
Tooltip text: The total amount of coins awarded to smeshers since genesis. The graph displays the total rewards amount awarded to smeshers at the end of previous epochs. Smeshers are rewarded for submitting blocks with transactions to the network, for participating in the Spacemesh consensus protocol and for publishing proof of space time proofs.
Main display: Total number of Smesh coins in circulation. This is the total balances of all mesh accounts. Graph: change over time, x-axis: epoch. y-axis: total number of smesh coins in circulation as of the end of that epoch. Note: the difference between this and the rewards module is that circulation includes any pre-minted coins at genesis.
Tooltip text: The total amount of Smesh coins currently in circulation. This is determined by the coin rewards awarded to Smeshers as well as genesis minted coins. The graph displays the total amount in circulation at the end of previous epochs.
Main display: Elapsed time since genesis time of the network.
Tooltip text: The network age is the time which passed from the network went online (genesis time) until the current time.
Main display: Current layer number and current epoch number (0-indexed since genesis)
Tooltip text: The current layer number and the current epoch number. One layer's duration is [XX] minutes and one epoch's duration is [YY] days.
Note: take layer and epoch duration are constant network params.
Main display: total number of transactions processed by the state transition function - e.g. reflected in global state as of the last state transition function (not txs on the mesh in blocks). Should exclude ATX transactions. Graph: x-axis: epoch. y-axis: total number of txs processed by the state transition function up to the end time of that epoch.
Tooltip text: The total number of transactions processed by the network since it went online (genesis time). The graph displays the total number of transactions processed by the network up to the end of previous epochs.
Main display: total amount of storage committed to the network based on the ATXs in the previous epoch. Graph: x-axis: epoch. y-axis: total amount of storage as of the epoch start time (atxs in previous epoch).
Tooltip text: Security is measured by the total storage size committed to the network by smeshers. The bigger the number, the more storage is required by an adversary to attack the network. The number displays the amount of storage committed by all active smeshers in the previous epoch. The graph displays the amount of storage committed in previous epochs.
Main display: degree_of_decentralization for the current layer.
-
degree_of_decentralizationis defined as:0.5 * (min(n,1e4)^2/1e8) + 0.5 * (1 - gini_coeff(last_100_epochs)) -
0.5 is an arbitrary weight assigned to each metric and can be adjusted
-
nis the number of unique smeshers who contributed blocks over the last 100 epochs. (I've arbitrarily set a ceiling of 10k miners as "full decentralization"--this can be changed. The function is quadratic and should approach 1 as n approaches 10k.) -
gini_coeffis the GINI coefficient of the vector of total blocks (or block weights) contributed by thosensmeshers over the last 100 layers. (We want one minus the GINI coefficient because higher is more unequal, i.e., less decentralized.)
Tooltip text: TBD - formula likely to change to consider post distro
Main display: average tx/s rate over capacity considering all layers in the current epoch. Only processed transactions by the state transition function and not transactions in blocks should be counted. Capacity is defined as the theoretical upper-bound on tx/s based on the network params. Graph: x-axis: epoch. y-axis: same ratio as main display for that epoch.
Tooltip text: The recent average transactions processed per second by the network over the network's transactions per second capacity. This indicates the current network transaction processing utilization. This network capacity is xxx transactions per second.
Note: network capacity is a network param provided by the api.
This is a live heat map of smeshers from around the globe. For a testnet, smeshers can opt-out from reporting ip address for geo-location via the app settings. For a mainnet, smeshers can opt-in to report ip address for geo-location. Nodes show as hot spots over the world's map. The goal of this module is not to identify specific smeshers but to display a measure of the geographic distribution aspect of decentralization.
Bottom left text: XXX Smeshers in YYY world locations (?).
Tooltip text: The map displays world locations of smeshers that opted-in to report geo location data back to Spacemesh. Each circle represents one active smesher at a specific world location, and the size of the circle is based on the amount of storage committed by that smesher.
