:WARNING: This page contains a tutorial for a deprecated method of storing Prometheus data in TimescaleDB. It has been replaced by Promscale. We are in the process of adding tutorials to our docs, in the meantime, use our README.
If you are interested in learning more about why we decided to re-design our integration, check out our design doc or our github project.
Prometheus is the leading open-source systems monitoring solution. With Prometheus, you can obtain metrics about your cloud infrastructure. Grafana is an open-source visualization engine, that enables you to gain powerful insight into your infrastructure metrics. TimescaleDB is a time-series database, providing the tools and services you need to store long-term infrastructure metrics and gain insight for cost-management, capacity planning, and root-cause analysis.
Together, TimescaleDB, Prometheus, and Grafana are an ideal open-source analytics stack.
This tutorial comes in two parts. In this first part, you’ll learn how to set up TimescaleDB and Prometheus. In the second part, you’ll learn how to use your metrics data to answer questions about how your infrastructure is performing. The second part of this tutorial also includes a sample dataset in case you’d prefer to evaluate TimescaleDB without setting up a full monitoring harness.
Prometheus is an open-source systems monitoring and alerting toolkit that can be used to easily and cost-effectively monitor infrastructure and applications. You might be already familiar with it, especially if you use Kubernetes. Prometheus’ greatest advantage is its unapologetic approach to solving monitoring in a simple and straightforward way. Its philosophy is to do one thing, and do it well.
However, Prometheus is limited by design. As the Prometheus documentation says:
“[Prometheus] is not arbitrarily scalable or durable in the face of disk or node outages and should thus be treated as more of an ephemeral sliding window of recent data.”
Having both compute and data storage on one node keeps Prometheus simple and easy to operate. However, what this means is that Prometheus data can only stick around for so long, and is difficult to manage operationally, as there’s no replication or high-availability.
For this reason, fast, efficient, and cost-effective time-series databases like TimescaleDB are an essential component of a comprehensive monitoring stack.
Storing long-term metrics data gives you significant advantages over only examining real-time or recent data:
- Manage costs. With insight into past and present metrics, you can determine the cost of doing business for various scenarios. How much does it cost to run your site on Black Friday? How much does it cost to add new sensors to your IoT infrastructure?
- Plan capacity. You can understand how much infrastructure you will require to support various use cases.
- Identify root causes. Having long-term views of metrics enables you to look for correlations when outages, degradation, or other periodic mishaps occur in your infrastructure.
Often, you want to separate the environments your applications and your monitoring run in. This tutorial will cover how to set up a monitoring system using TimescaleDB, Prometheus, and Grafana running in Docker containers on an Amazon Web Services EC2 instance. Before we setup the monitoring environment, you’ll need:
- An AWS account
- A new or existing Amazon EC2 instance. We’ll use the
t2.largeinstance type, but you can use whatever is within your budget, including the free-tier eligible instances. Ensure that you store your.pemkey safely. In this tutorial, we’ll use the Ubuntu Server 18.04 LTS AMI:

- An SSH connection to your Amazon EC2 instance. Learn how to set up one here. Remember to set the correct permissions on your key file, you can learn more here
- Docker installed on Ubuntu. Follow the instructions to install.
- An SFTP client - we’ll use FileZilla. See this
StackOverflow post for help on how to connect to your
Amazon EC2 instance running Ubuntu using FileZilla. You’ll need the Public DNS
of the server, found on the Amazon EC2 Description page. The
usernamewill be 'ubuntu' and the password will be blank. - A Prometheus metrics endpoint, for Prometheus to scrape, on the infrastructure you are interested in monitoring. If you are using Timescale Cloud as your database, follow the instructions to set up an endpoint for Prometheus. See here for a list of Prometheus exporters for various infrastructure setups. A popular one is the Node/system metrics exporter, which sends hardware and OS metrics exposed by *NIX kernels.
If you’d prefer not to use AWS, the instructions below will still work for machines running Ubuntu and Docker. The instructions can also be used if you only have a Docker environment set up, though they may require additional steps.
Now we will configure TimescaleDB with the PostgreSQL Prometheus extension, known as pg_prometheus. From the command line, run the following:
docker run --name pg_prometheus -e POSTGRES_PASSWORD=secret -d -p 5432:5432 timescale/pg_prometheus:latest-pg11 postgres -csynchronous_commit=offThis command pulls a new instance of the latest release of TimescaleDB, with
the pg_prometheus extension installed and uses
the --name flag to name it pg_prometheus. This will automatically create
tables, hypertables, and schema to store and query metrics from Prometheus in
an optimized way.
We also use the the -e flag to set the password to our TimescaleDB instance
to be secret, but please change it and/or use the relevant secret management
and password methods you prefer. We also use the default PostgreSQL port of
5432, but you can change it if you have other things running on that port.
:TIP: If you’re new to TimescaleDB, the Hello! Timescale tutorial will give you the base knowledge you need to proceed.
Next, let’s set up the Prometheus PostgreSQL adapter, which acts as a translation proxy that Prometheus uses for reading and writing data into PostgreSQL/TimescaleDB. The adapter has a dependency on the pg_prometheus PostgreSQL extension, which comes pre-installed on the Timescale instance we installed in Step 1.
Here’s how the adapter works: All the metrics that are recorded into Prometheus are first written to the local node and then written to TimescaleDB. This means that all of your metrics are immediately backed up, so that any disk failure on a Prometheus node will be less painful.
docker run --name prometheus_postgresql_adapter -d -p 9201:9201 timescale/prometheus-postgresql-adapter:latest -pg-host={IP_OF_MACHINE} -pg-password=secret -pg-port=5432This command pulls the latest release of the TimescaleDB remote storage adapter to use PostgreSQL as a remote read and write destination for Prometheus metrics.
Insert the internal IP address of the machine your Timescale container is running on. You can obtain this on any Amazon EC2 instance by running the following command:
curl http://checkip.amazonaws.com:WARNING: Be sure to use the same password and port number as we did in step 1 for the TimescaleDB instance.
Note that we spin up the adapter on port 9201, but you can change it if you have other
things running on that port.
To check if this is working, login to your database using psql with the following
command:
docker exec -it pg_prometheus psql -U postgresCheck that the extensions include both pg_prometheus and timescaledb by using the
\dx command in psql:
                                       List of installed extensions
     Name      | Version |   Schema   |                            Description
---------------+---------+------------+-------------------------------------------------------------------
 pg_prometheus | 0.2.2   | public     | Prometheus metrics for PostgreSQL
 plpgsql       | 1.0     | pg_catalog | PL/pgSQL procedural language
 timescaledb   | 1.6.0   | public     | Enables scalable inserts and complex queries for time-series data
(3 rows)
Also ensure that your tables include metrics_copy, metrics_values, and metrics_labels
by running the \dt command in psql:
             List of relations
 Schema |      Name      | Type  |  Owner
--------+----------------+-------+----------
 public | metrics_copy   | table | postgres
 public | metrics_labels | table | postgres
 public | metrics_values | table | postgres
(3 rows)
Now let’s set up Prometheus. Begin by configuring the prometheus.yml file to tell
Prometheus to use our TimescaleDB instance with pg_prometheus as a remote read and
write for Prometheus metrics. This ensures that all the metrics that are recorded into
Prometheus are first written to the local node and then written to TimescaleDB. This
means that all of your metrics are immediately backed up, so that any disk failure on a
Prometheus node will be less painful.
To do this, add the following lines at the end of your prometheus configuration file,
assuming you’ve set up the Prometheus PostgreSQL adapter from step 2 at port 9201:
 remote_write:
 - url: "http://{ADAPTER_IP}:9201/write"
remote_read:
 - url: "http://{ADAPTER_IP}:9201/read"
If you don’t have a running instance of Prometheus or a prometheus.yml configuration
file, here’s a sample one for the node exporter, running at port 9100:
#prometheus.yml for node exporter job
global:
 scrape_interval:     10s
 evaluation_interval: 10s
scrape_configs:
 - job_name: prometheus
   static_configs:
     - targets: ['node_exporter:9100']
remote_write:
 - url: "http://{ADAPTER_IP}:9201/write"
remote_read:
 - url: "http://{ADAPTER_IP}:9201/read"
If you’re monitoring a Timescale Cloud database instance per
this tutorial, you can use the following
sample configuration file, taking care to replace {TARGET_IP} with the IP
address of your Timescale cloud database and {TARGET_PORT} with the port that
the endpoint is running on, as well as your username and password to authenticate
your connection to that endpoint.
#prometheus.yml for monitoring a timescale cloud instance
global:
 scrape_interval:     10s
 evaluation_interval: 10s
scrape_configs:
 - job_name: prometheus
   scheme: https
   static_configs:
     - targets: ['{TARGET_IP}:{TARGET_PORT}']
   tls_config:
     insecure_skip_verify: true
   basic_auth:
     username: {ENDPOINT_USERNAME}
     password: {ENDPOINT_PASSWORD}
remote_write:
 - url: "http://{ADAPTER_IP}:9201/write"
remote_read:
 - url: "http://{ADAPTER_IP}:9201/read"
Now that your Prometheus configuration file has been set, we will use
FileZilla (or similar tool) to transfer your file to your Amazon EC2 instance.
Finally, we can run the command below in order to start up Prometheus in a container
using the configs specified in prometheus.yml:
sudo docker run -p 9090:9090 -v prometheus.yml:/etc/prometheus/prometheus.yml prom/prometheusTo check that Prometheus metrics are indeed being stored in TimescaleDB, run the
following command in psql when connected to your TimescaleDB instance and check
that you see rows in the metrics_values table:
SELECT * FROM metrics_values LIMIT 5;Your output should look like this:
            time            | value | labels_id
----------------------------+-------+-----------
 2020-03-17 11:59:57.937+00 |     0 |         1
 2020-03-17 11:59:47.937+00 |     0 |         1
 2020-03-17 11:59:37.937+00 |     0 |         1
 2020-03-17 11:59:27.937+00 |     0 |         1
 2020-03-17 11:59:17.937+00 |     0 |         1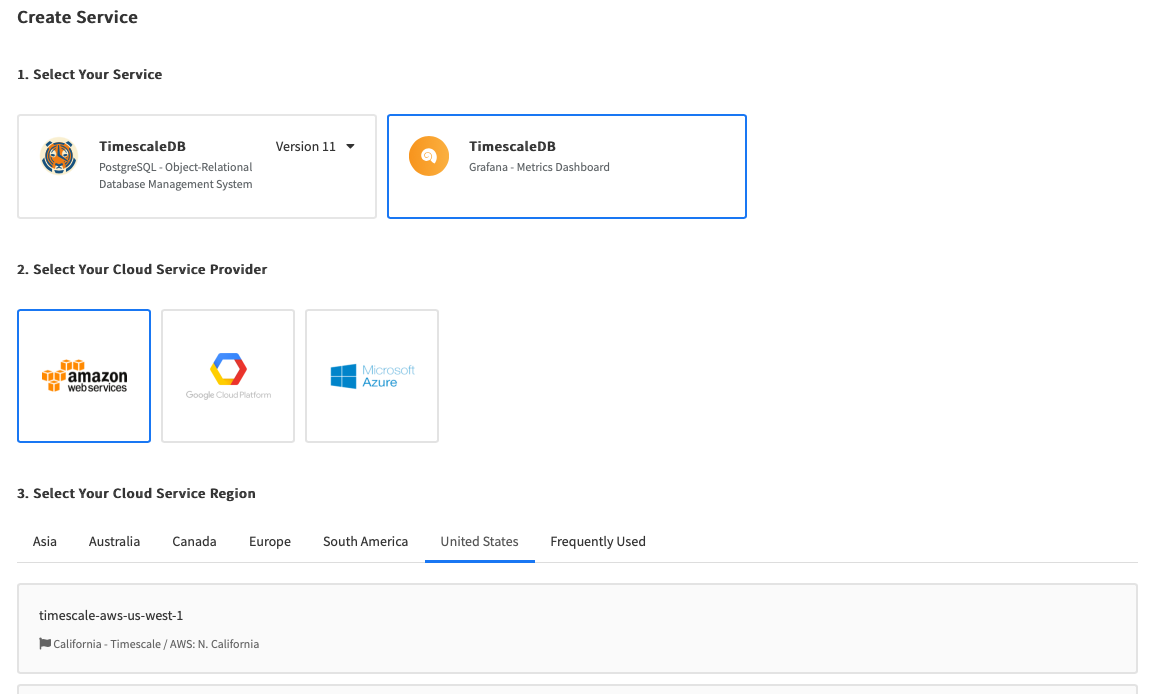
(5 rows)Lastly, you will need to set up a Grafana instance. You have two options here. First, if you’re using Timescale Cloud, you could setup a Grafana instance from the Create Service flow. Our Grafana tutorial has further instructions on how to login to your Grafana instance and how to setup Grafana and TimescaleDB.
Second, you could run Grafana in a docker container on your EC2 instance. To do this, run:
sudo docker run -d -p 3000:3000 grafana/grafanaIf you run open-source Grafana in a Docker container, your default username
and password are admin and admin. You can learn more about how to configure
that in the Grafana docs and
this StackOverflow post.
:TIP: Alternatively, you can set up Grafana Cloud and follow the rest of the instructions below. Note that Grafana Cloud is more feature-rich than the open source version of Grafana included with Timescale Cloud, but does require a paid subscription from Grafana.
To complete the setup, you need to connect your TimescaleDB instance as a
datasource to power dashboards in Grafana. To do this, select new PostgreSQL
data source and fill out the credentials as follows:
- Your host will be the public DNS of your AWS EC2 instance, with the port number
being the port number of your Timescale instance, which we setup in step 1 as the
default PostgreSQL port of
5432. - Your database name is
postgres - Your user is
postgres- you can create a new user with more limited permissions if you don’t want to use thepostgressuperuser. - Password would be the password for your Timescale instance, configured in Step 1.
- SSL mode will be
disable - Version: 11
- TimescaleDB selected - this tells Grafana you’re using TimescaleDB and will allow you to use Timescale specific functions for analysis and creating visualizations.
Once these four steps are completed, you will have a working instance of Prometheus collecting metrics from your cloud infrastructure, a working instance of TimescaleDB storing those metrics, with the help of the Prometheus-PostgreSQL Adapter, and a working instance of Grafana, with TimescaleDB as a datasource, ready to build visualizations on the data.
The second part of this tutorial provides instructions on how to optimize TimescaleDB for storing and analyzing Prometheus metrics, as well as how to create sample dashboards using TimescaleDB and Grafana.