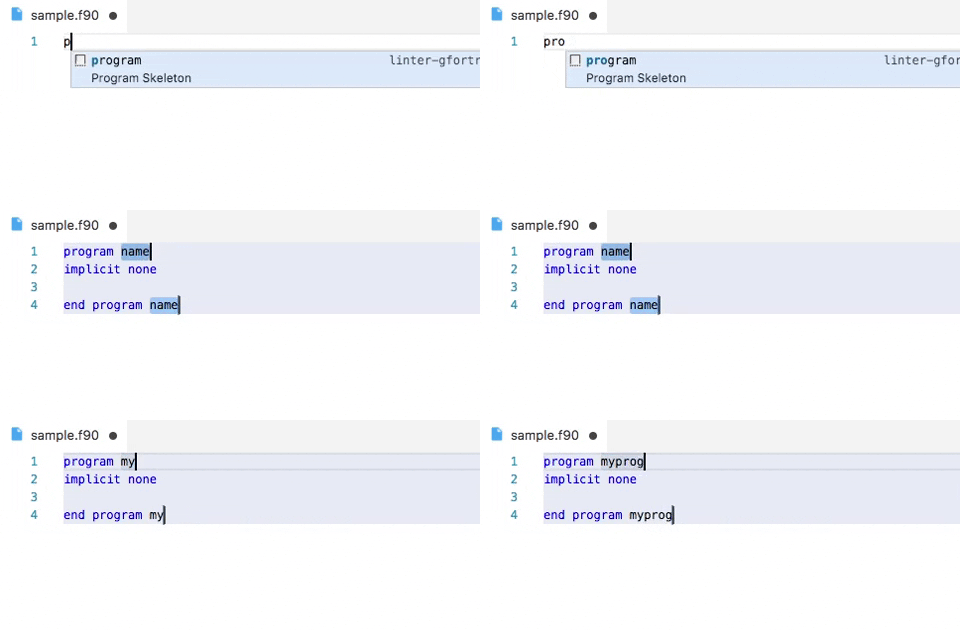
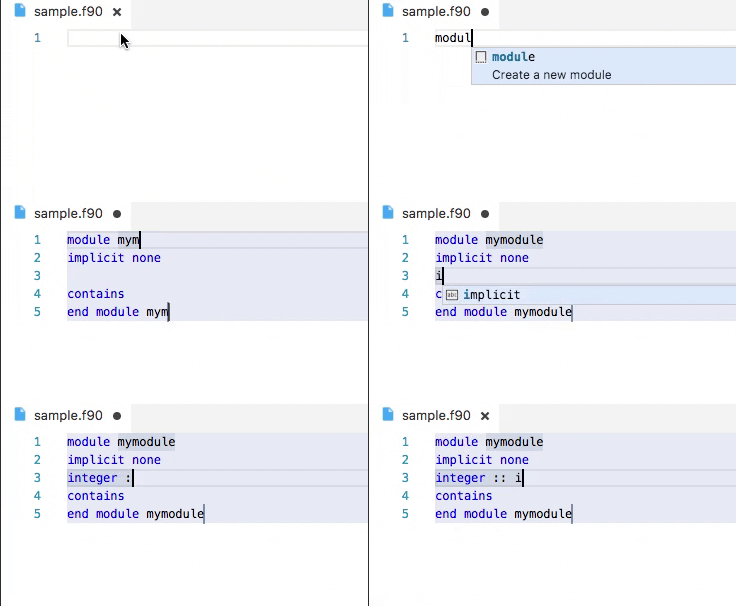
This extension provides support for the Fortran programming language. It includes syntax highlighting, debugging, code snippets and a linting based on
gfortran. You can download the Visual Studio Code editor from here.
- Syntax highlighting
- Code Snippets
- Documentation on hover for intrinsic functions
- Code linting based on
gfortranto show errors wiggles in your code - Code autocompletion (beta)
- Symbols provider
- Debugger, uses Microsoft's C/C++ extension
- Formatting with findent or fprettify
You can control the include paths to be used by the linter with the fortran.includePaths setting.
{
  "fortran.includePaths": ["/usr/local/include", "/usr/local"]
}
By default the gfortran executable is assumed to be found in the path. In order to use a different one or if it can't be found in the path you can point the extension to use a custom one with the fortran.gfortranExecutable setting.
{
  "fortran.gfortranExecutable": "/usr/local/bin/gfortran-4.7"
}
If you want to pass extra options to the gfortran executable or override the default one, you can use the setting fortran.linterExtraArgs. By default -Wall is the only option.
{
  "fortran.linterExtraArgs": ["-Wall"]
}
You can configure what kind of symbols will appear in the symbol list by using
{
  "fortran.symbols": ["function", "subroutine"]
}
The available options are
- "function"
- "subroutine"
- "variable"
- "module" (not supported yet)
- "program" (not supported yet)
and by default only functions and subroutines are shown
You can also configure the case for fortran intrinsics auto-complete by using
{
    "fortran.preferredCase": "lowercase" | "uppercase"
}This is a list of some of the snippets included, if you like to include additional snippets please let me know and I will add them.
To trigger code validations you must save the file first.
The extension uses the debugger from Microsoft's C/C++ extension for Visual Studio Code. This allows this extension to use the full functionality of the C/C++ extension for debugging applications: (un)conditional breaking points, expression evaluation, multi-threaded debugging, call stack, stepping, watch window.
A minimal launch.json script, responsible for controlling the debugger, is
provided below. However, Visual Studio Code is also capable of autogenerating
a launch.json file and the configurations inside the file.
More details about how to setup the debugger can be found in Microsoft's website:
- General information about debugging in VS Code: https://code.visualstudio.com/docs/editor/debugging
- C/C++ extension debugger information: https://code.visualstudio.com/docs/cpp/cpp-debug
- Build tasks for easy compiling: https://code.visualstudio.com/docs/editor/tasks
{
  // Use IntelliSense to learn about possible attributes.
  // Hover to view descriptions of existing attributes.
  // For more information, visit: https://go.microsoft.com/fwlink/?linkid=830387
  "version": "0.2.0",
  "configurations": [
    {
      "name": "(gdb) Fortran",
      "type": "cppdbg",
      "request": "launch",
      "program": "${workspaceFolder}/a.out",
      "args": [], // Possible input args for a.out
      "stopAtEntry": false,
      "cwd": "${workspaceFolder}",
      "environment": [],
      "externalConsole": false,
      "MIMode": "gdb",
      "setupCommands": [
        {
          "description": "Enable pretty-printing for gdb",
          "text": "-enable-pretty-printing",
          "ignoreFailures": true
        }
      ]
    }
  ]
}Two formatters are supported findent
and fprettify. Both of them can be
installed with pip automatically through the extension.
| findent | fprettify |
|---|---|
 |
 |
The formatter is controlled by the user option
{
    "fortran.formatting.formatter": "Disabled" | "findent" | "fprettify",
}
Additional arguments to the formatter can be input using
{
    "fortran.formatting.args":, ["-Cn", "--align-paren=1"]
}
If the formatter is not present in the PATH its location can be input with
{
  "fortran.formattting.path": "/custom-path-to-formatter-binary"
}findent can also be used to generate dependency files for a project.
For the linter to work you need to have gfortran on your path, or wherever you configure it to be.
For debugging you need to have one of the following debuggers installed:
- Linux: GDB
- macOS: GDB or LLDB
- Windows: GDB or Visual Studio Windows Debugger
Please report any issues and feature request on the GitHub repo here
The syntax highlight support was imported from TextMate bundle
The idea of using gfortran comes from this awesome fortran plugin for Sublime Text.
MIT


