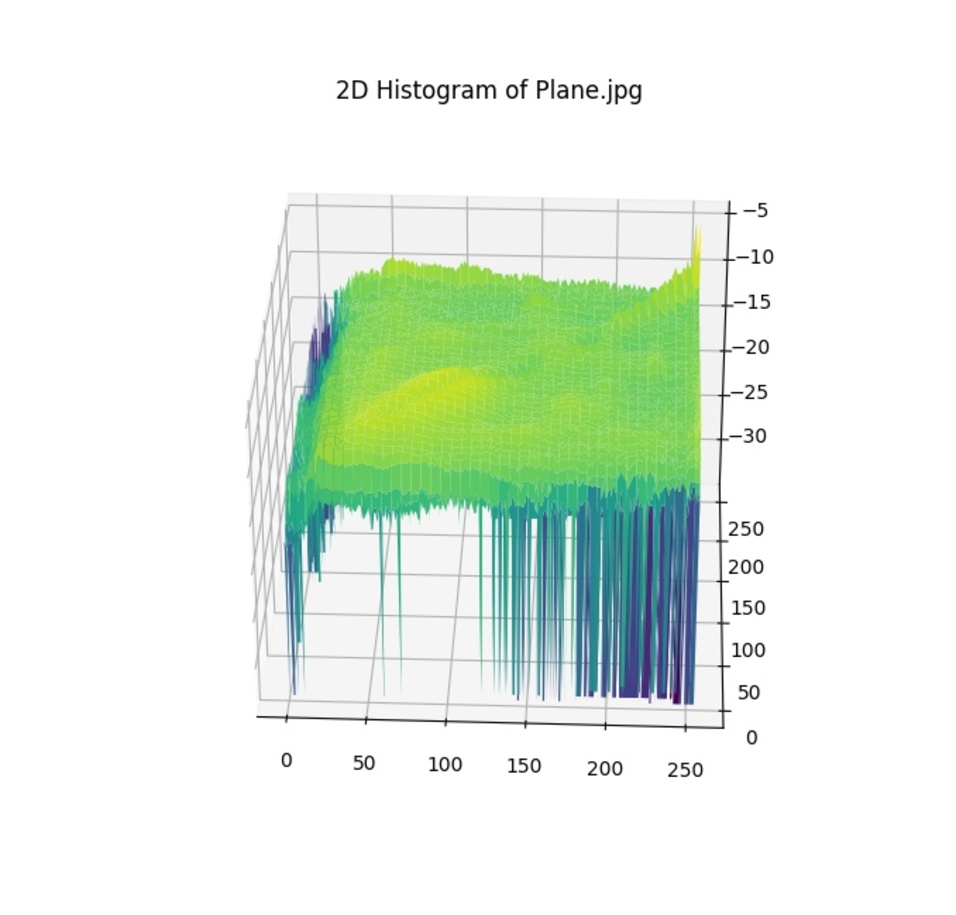
This small piece of code is intended to help researchers, especially in field of image processing, to easily calculate two dimensional histogram of a given image.
A moving window of WxW moves through out the given image, and as its center places on each pixel, number of encounters with same and other brightness intensities is counted seperately. This package basically outputs a normalized two dimensional numpy array of brightness intensity encounters.
 w_neighboring=1 corresponds to a square of 3x3.
Run the following to install:
pip install im2dhistfrom im2dhist import im2dhist
import cv2
import numpy as np
from mpl_toolkits import mplot3d
import matplotlib.pyplot as plt
def main():
image_name = 'Plane.jpg'
image = cv2.imread(image_name)
# converts rgb image to gray
gray_image = cv2.cvtColor(image, cv2.COLOR_BGR2GRAY)
# 2*w_neighboring+1 is width of the square window around each pixel, when counting neiboring pixels
# calculate 2 dimensional histogram of gray_image
v_image_2DHisteq = im2dhist(gray_image, w_neighboring=6)
# plots 2D-Histogram
[K, _] = v_image_2DHisteq.shape
x = np.outer(np.arange(0, K), np.ones(K))
y = x.copy().T
# ln-ing v_image_2DHisteq makes its details more prominent.
Hist2D_ln = v_image_2DHisteq.copy()
Hist2D_ln[np.where(Hist2D_ln<=0)] = 1e-15
z = np.log(Hist2D_ln)
fig = plt.figure()
ax = plt.axes(projection='3d')
ax.plot_surface(x, y, z,cmap='viridis', edgecolor='none')
ax.set_title(f'2D-Histogram of {image_name}')
plt.show()
if __name__ == '__main__': main()This is a sample image
 Two dimensional histogram of the sample image


