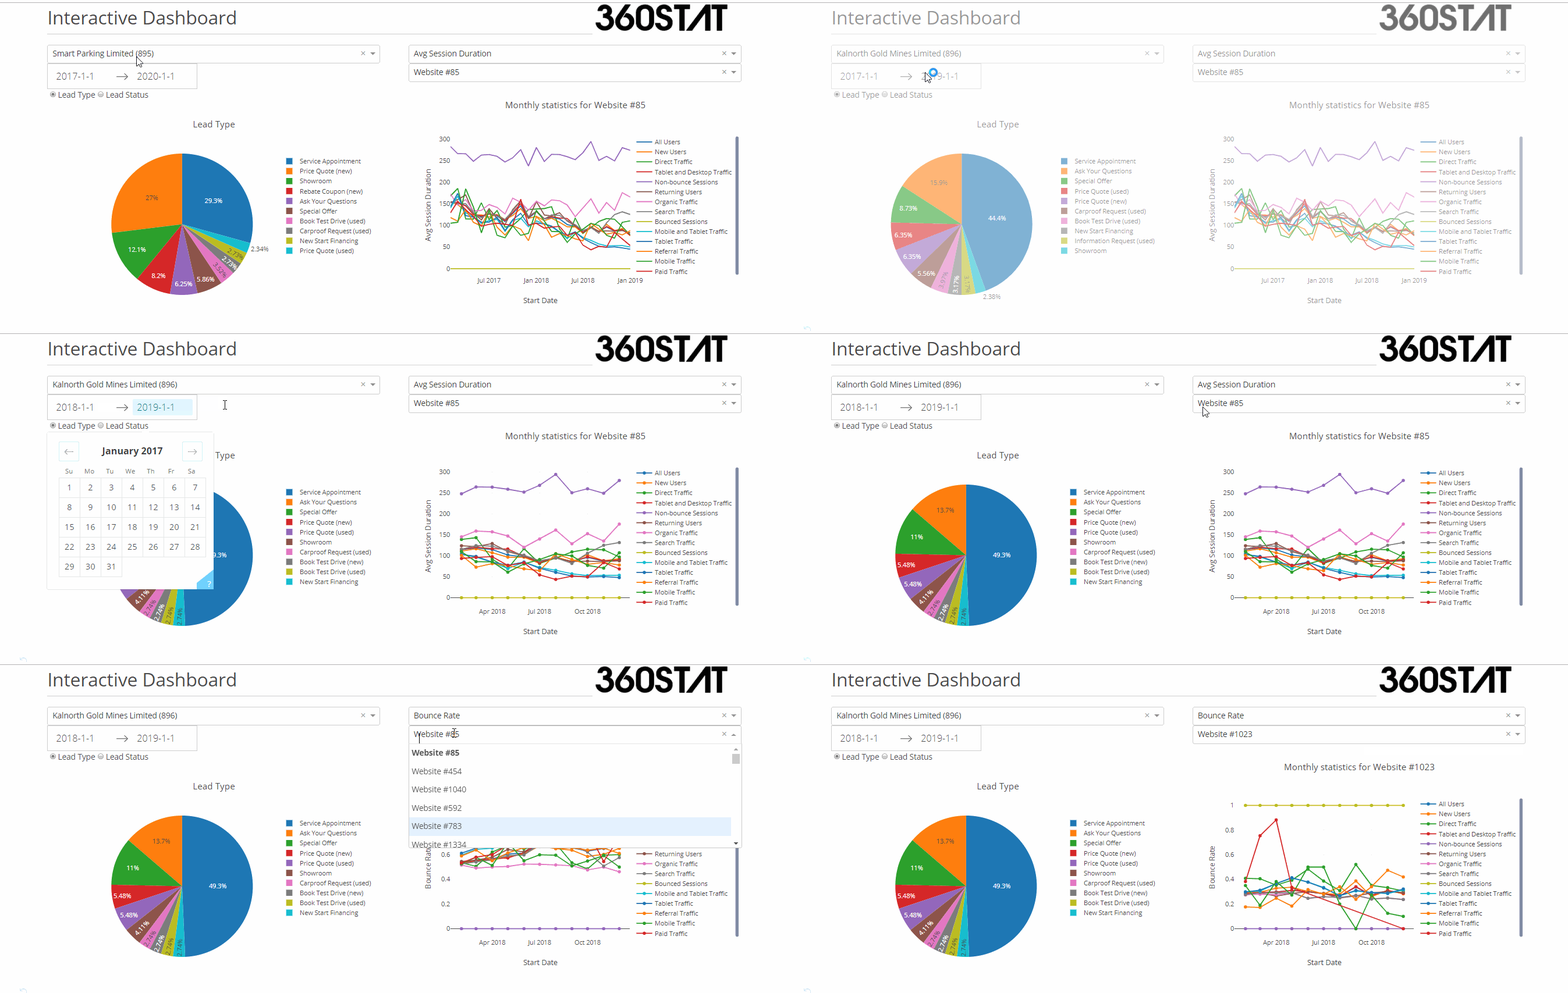
Visualisation innovatrice et percutante - Impactful and innovative visualization
💻 Try it out here: https://stat-360.herokuapp.com
📚 Open Source code: https://github.com/Mskycoder/stat-360
✏️ Devpost: https://devpost.com/software/360-stat/
The REST API password is left unfilled for security reasons, and it needs to be updated for the app to function.
CSV files are used for to improve responsiveness and speed due to the large amount of data handled. To update the data folder, use the REST api to update the corresponding tables.
To get started, clone this repo and install the requirements:
git clone https://github.com/Mskykiller/stat-360.git
cd stat-360
virtualenv venv  # Create a virtual env
source venv/bin/activate  # Activate the venv
pip install -r requirements.txt  # Install the requirements
To activate in windows, replace the 4th line with this:
venv\Scripts\activate
Then, make sure that you run the notebook to send the requests and download the data. Notes are included inside the notebooks/Data Exploration.ipynb.
Finally, run the app:
python app.py
We wanted to create a dashboard to better visualize the statistics collected from the websites managed by 360Agency, as well as better understanding the impact of leads collected. The dashboard needed to be interactive so that we can better interact with the large amount of data collected by the firm.
It lets you query the 360agency database in real-time, and feed the information to advanced interactive dashboards. Those dashboards can be controlled by different types of components (sliders, dropdowns, date picker, etc.) and are themselves interactive! Simply hover over a data point to see the exact information it contains.
We used a combination of many different technologies to host our app:
- MySQL: Real-time queries of dealership organization unit ID.
- Dash: A library that abstracts flask and react to make the code concise and easy to read.
- Plotly: Lets you visualize many different types of data using bar charts, line plots, etc. They are fully interactive, and can be updated by other components.
- 360Agency's REST API: Access the website statistics and convert that into a tabular format
- pandas: Manipulate the tabular data so that we can filter the essential information to display
- Flask: The backend server that is used to host the app. We used this micro-framework due to its simplicity and its potential to scale well.
- React.js: The different components inside the dashboard. For example, the date picker component was created by Airbnb, and the different other dropdowns are popular components created by the open-source community. This renders our product cutting-edge and highly customizable.
- Heroku: Used this platform to host our app on the cloud, which lets us scale it easily, and not worry about any downtime.
- Github: Host our open-source app.
It was challenging to learn new frameworks, as well as making a full-fledged app that works on the web! We had to go through a lot of trial and errors to make the final website work and look nice.
How to use backend frameworks in Python, and front-end design in JavaScript, as well as dealing with user data from car dealerships. It was an enriching experience and really fun to work with other members.
