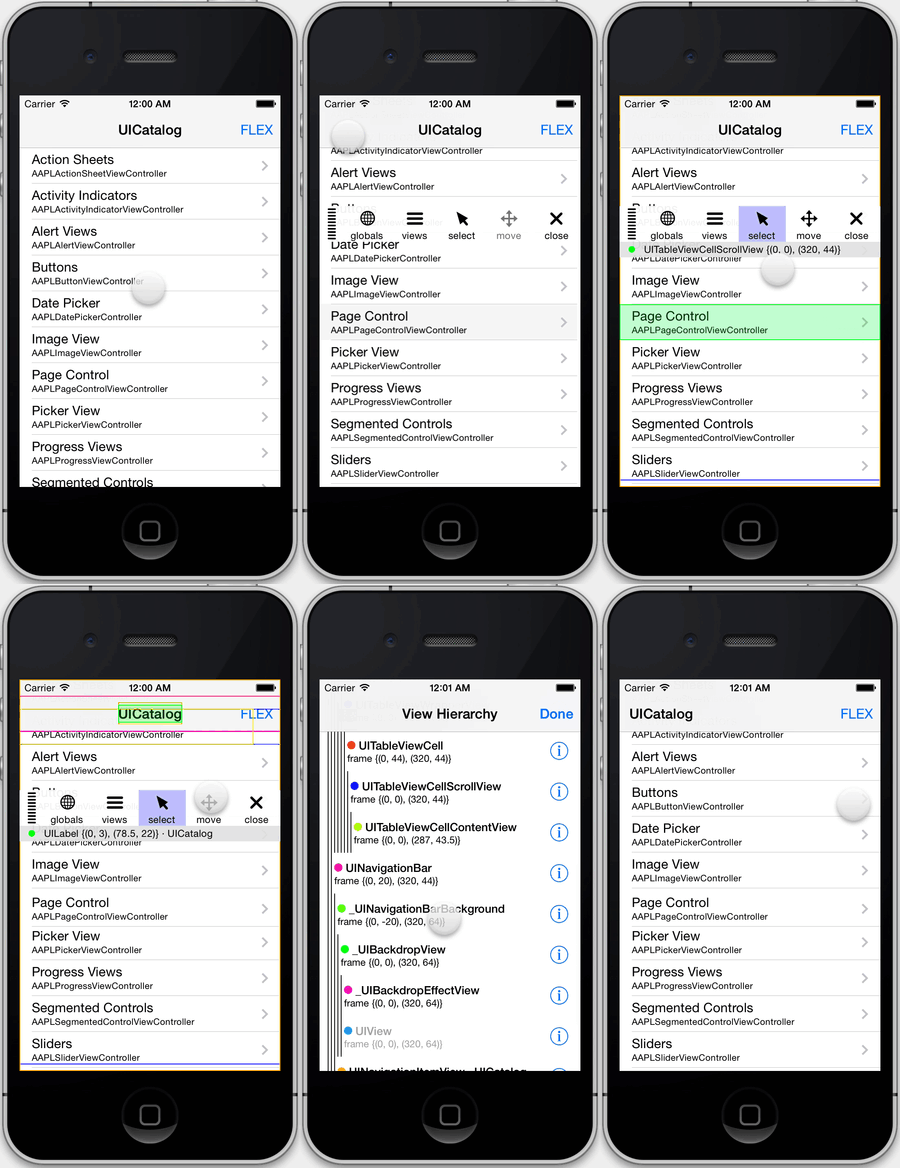
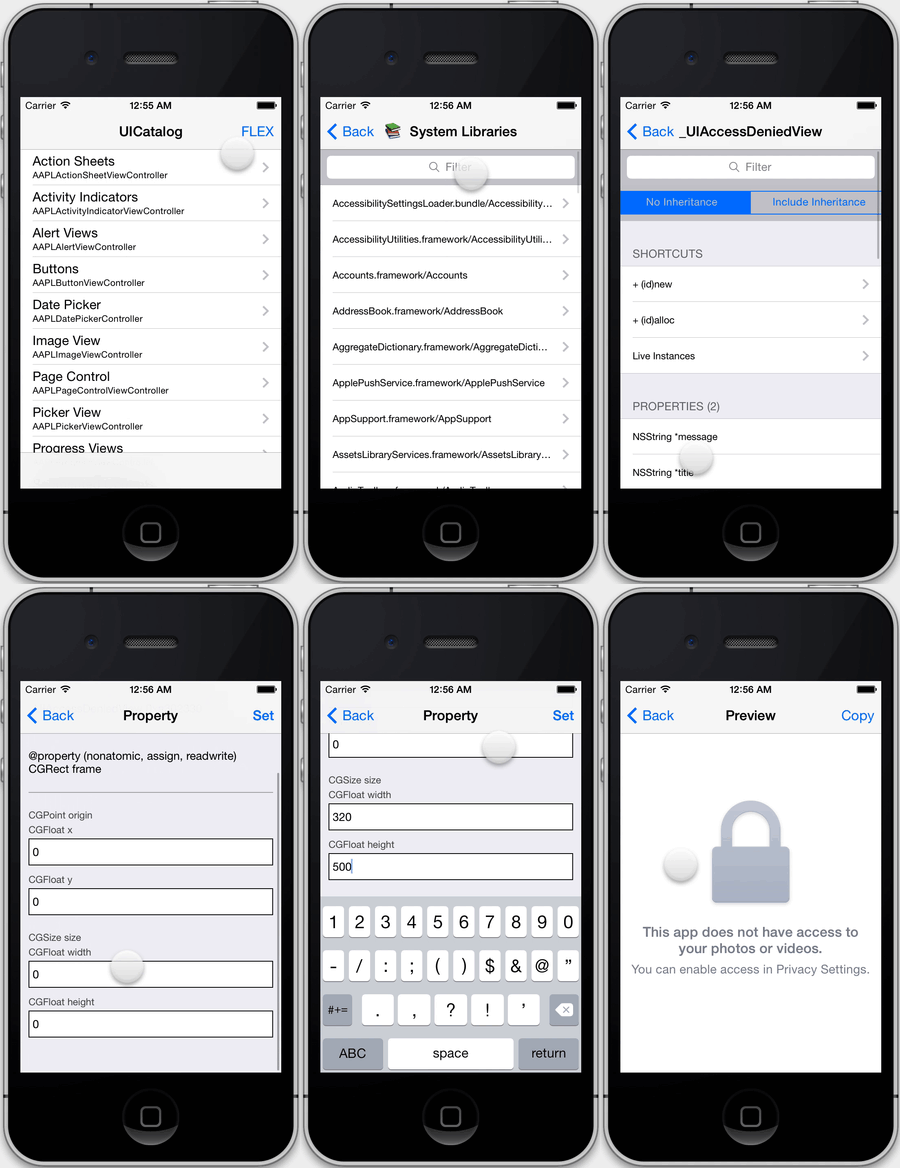
FLEX (Flipboard Explorer) is a set of in-app debugging and exploration tools for iOS development. When presented, FLEX shows a toolbar that lives in a window above your application. From this toolbar, you can view and modify nearly every piece of state in your running application.
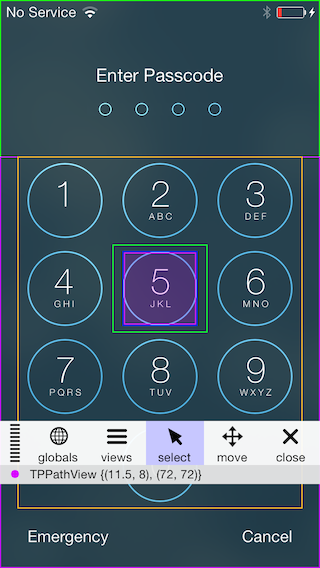
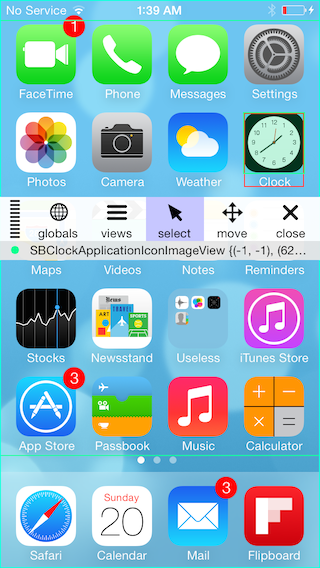
- Inspect and modify views in the hierarchy.
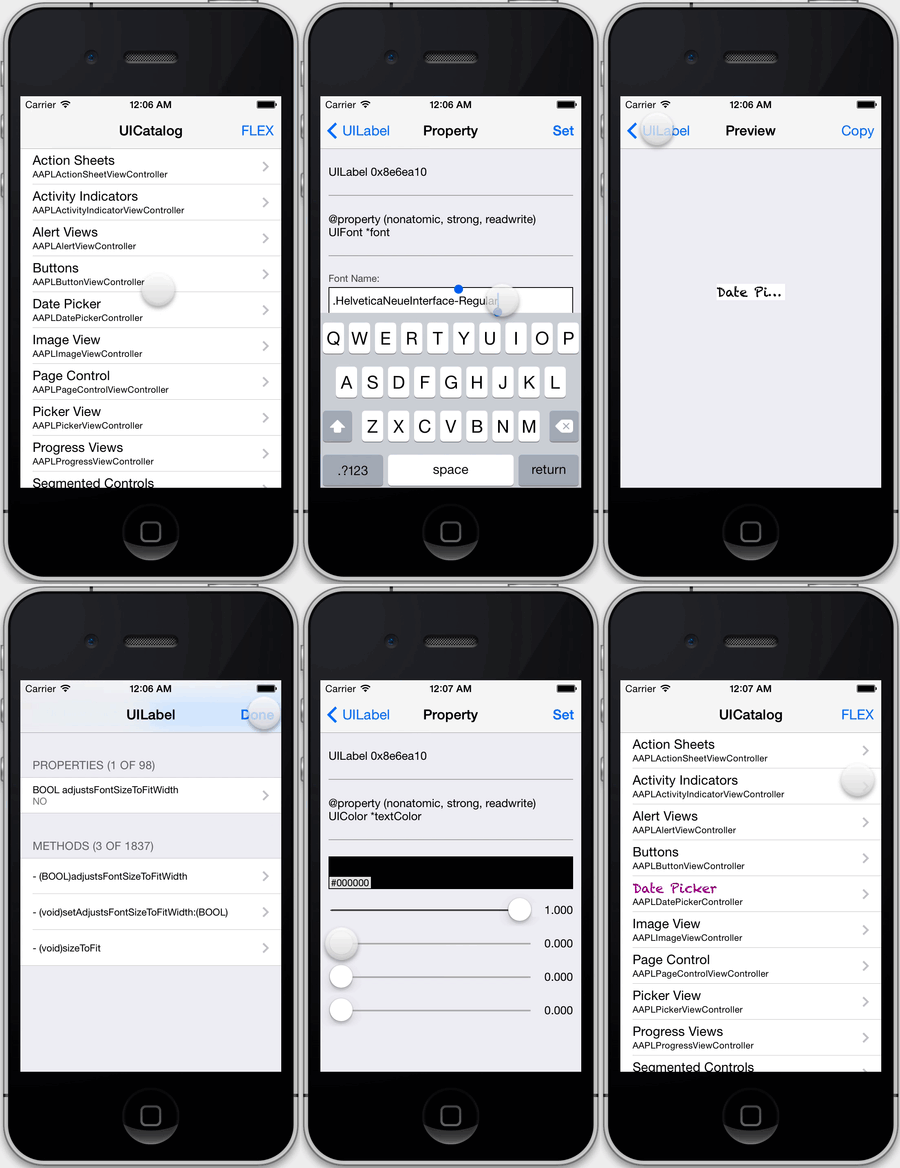
- See the properties and ivars on any object.
- Dynamically modify many properties and ivars.
- Dynamically call instance and class methods.
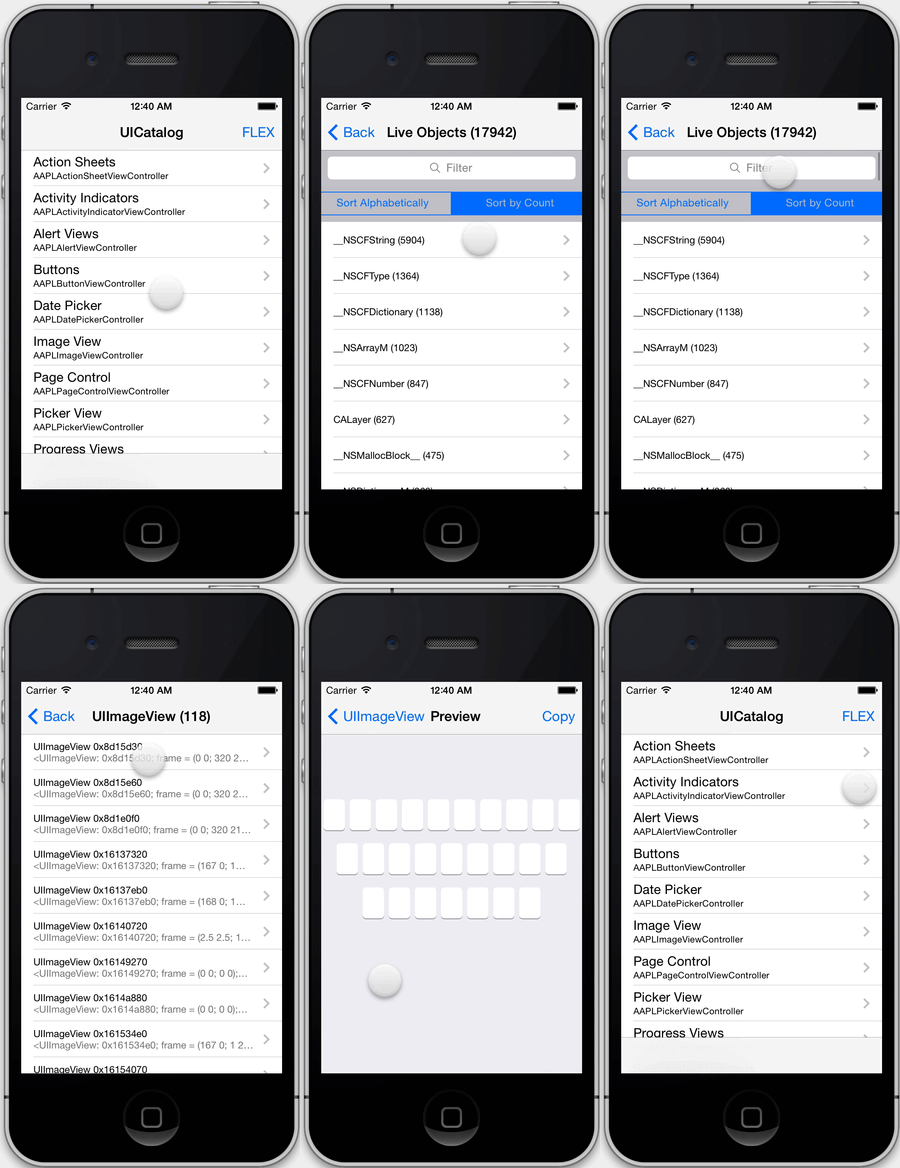
- Access any live object via a scan of the heap.
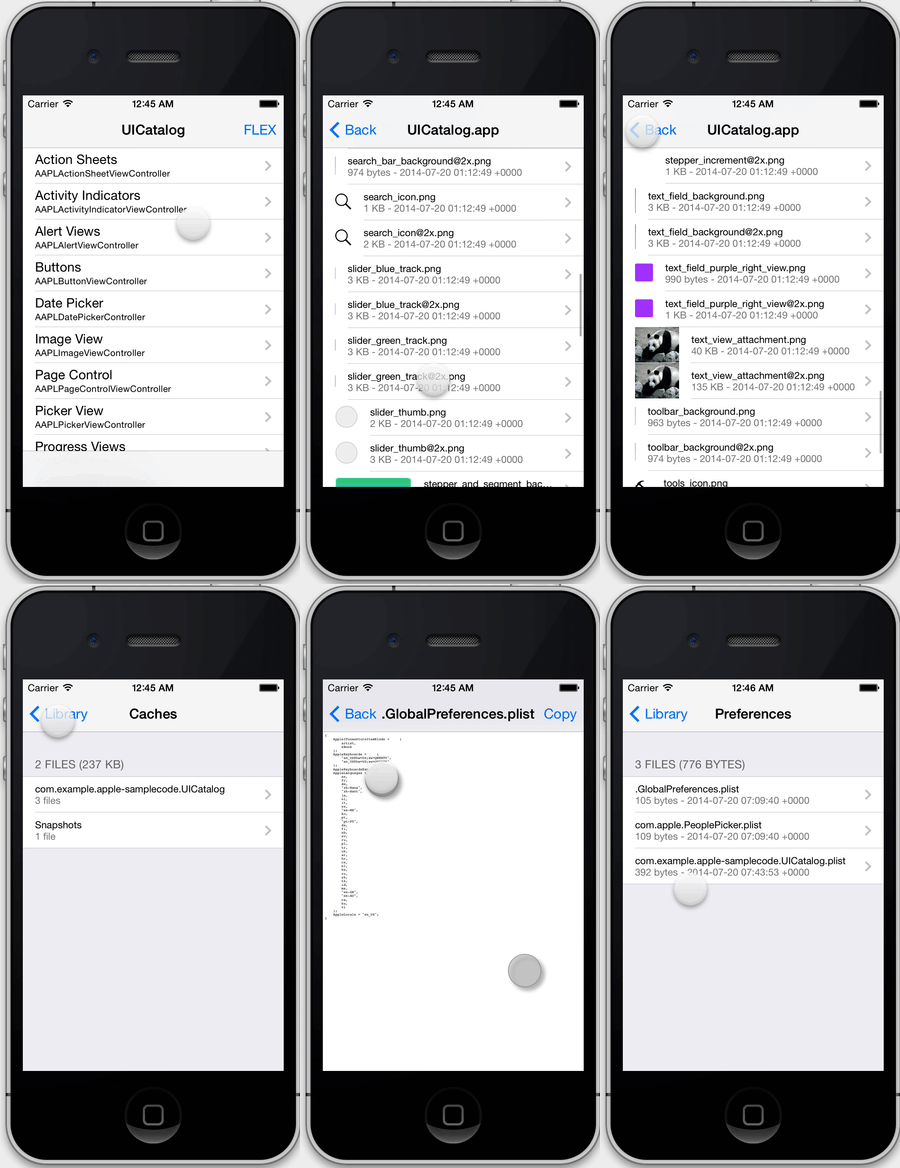
- View the file system within your app's sandbox.
- Explore all classes in your app and linked systems frameworks (public and private).
- Quickly access useful objects such as
[UIApplication sharedApplication], the app delegate, the root view controller on the key window, and more. - Dynamically view and modify
NSUserDefaultsvalues.
Unlike many other debugging tools, FLEX runs entirely inside your app, so you don't need to be connected to LLDB/Xcode or a different remote debugging server. It works well in the simulator and on physical devices.
Short version:
[[FLEXManager sharedManager] showExplorer];More complete version:
#if DEBUG
#import "FLEXManager.h"
#endif

...

- (void)handleSixFingerQuadrupleTap:(UITapGestureRecognizer *)tapRecognizer
{
#if DEBUG
    if (tapRecognizer.state == UIGestureRecognizerStateRecognized) {
        // This could also live in a handler for a keyboard shortcut, debug menu item, etc.
        [[FLEXManager sharedManager] showExplorer];
    }
#endif
}Once a view is selected, you can tap on the info bar below the toolbar to present more details about the view. From there, you can modify properties and call methods.
FLEX queries malloc for all the live allocated memory blocks and searches for ones that look like objects. You can see everything from here.
View the file system within your app's sandbox. FLEX shows file sizes, image previews, and pretty prints .json and .plist files. You can copy text and image files to the pasteboard if you want to inspect them outside of your app.
Go digging for all things public and private. To learn more about a class, you can create an instance of it and explore its default state.
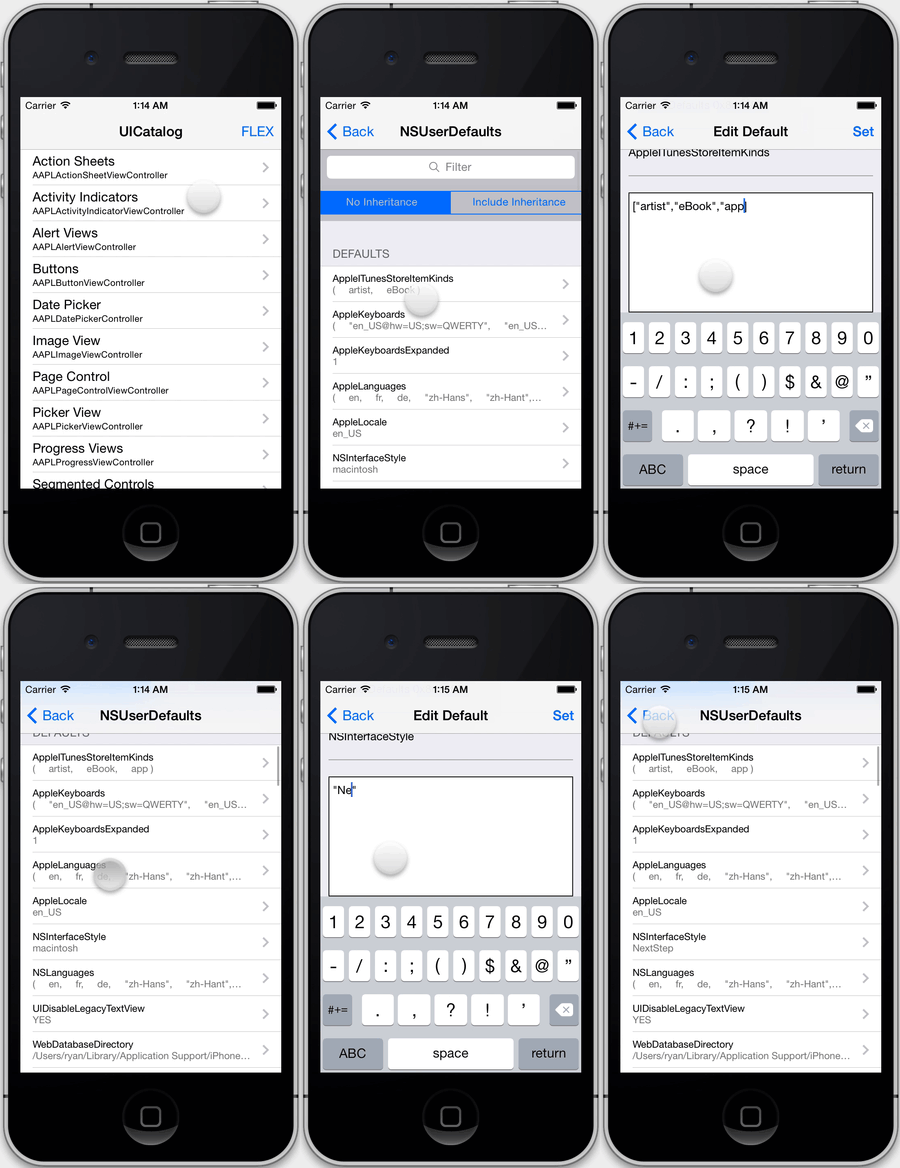
FLEX allows you to edit defaults that are any combination of strings, numbers, arrays, and dictionaries. The input is parsed as JSON. If other kinds of objects are set for a defaults key (i.e. NSDate), you can view them but not edit them.
The code injection is left as an exercise for the reader. 😇
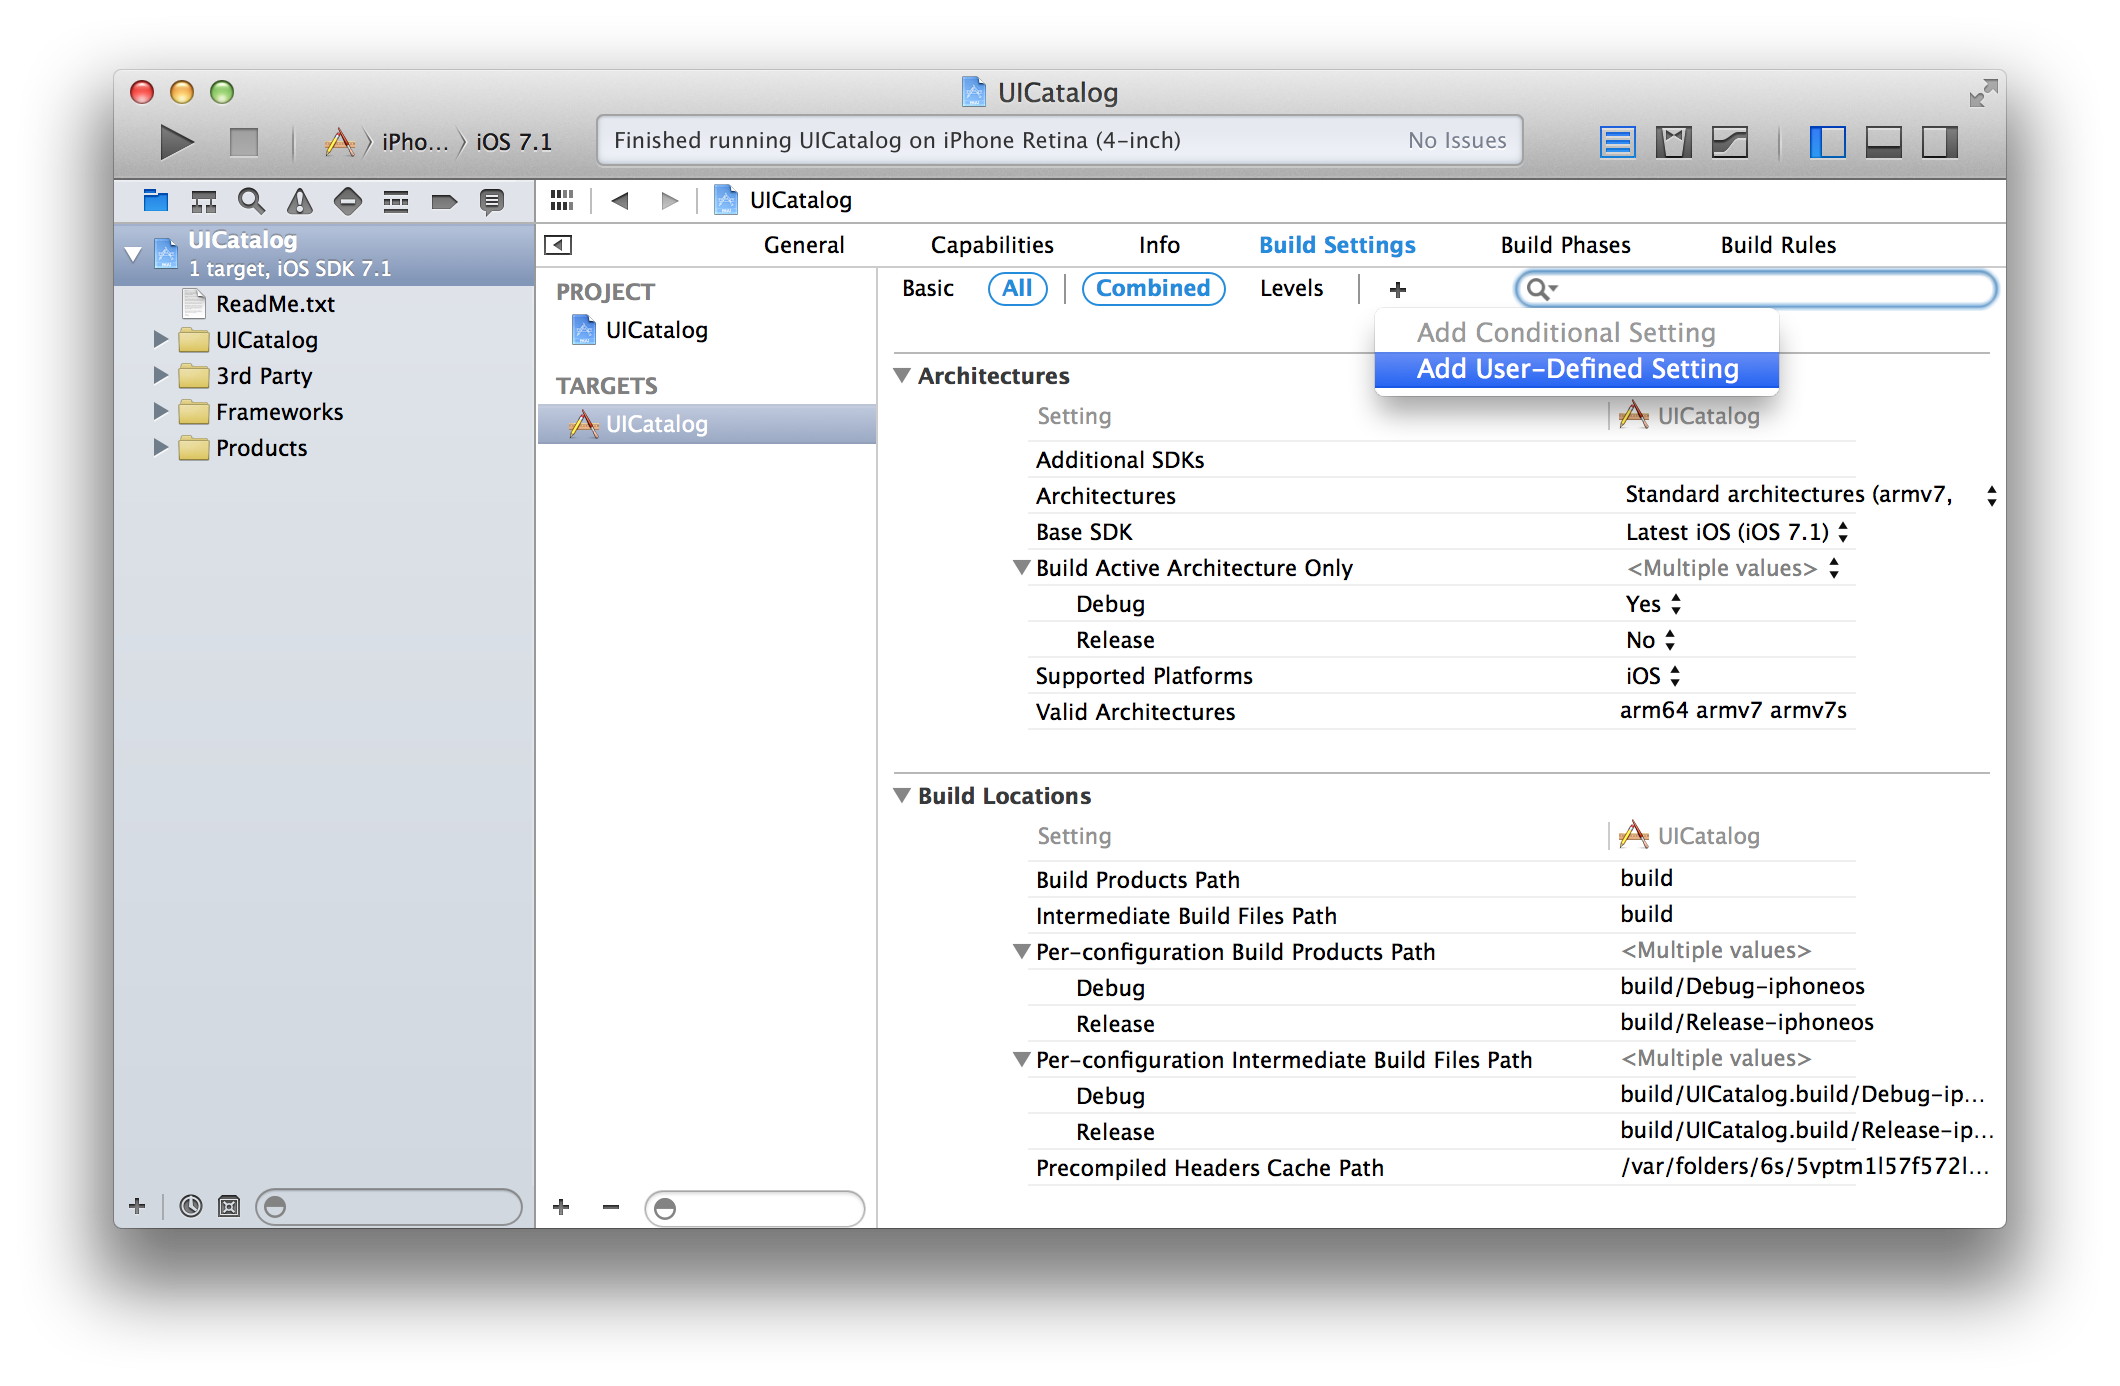
FLEX makes it easy to explore the internals of your app, so it is not something you should expose to your users. Fortunately, it is easy to exclude FLEX files from Release builds. In Xcode, navigate to the "Build Settings" tab of your project. Click the plus and select Add User-Defined Setting.
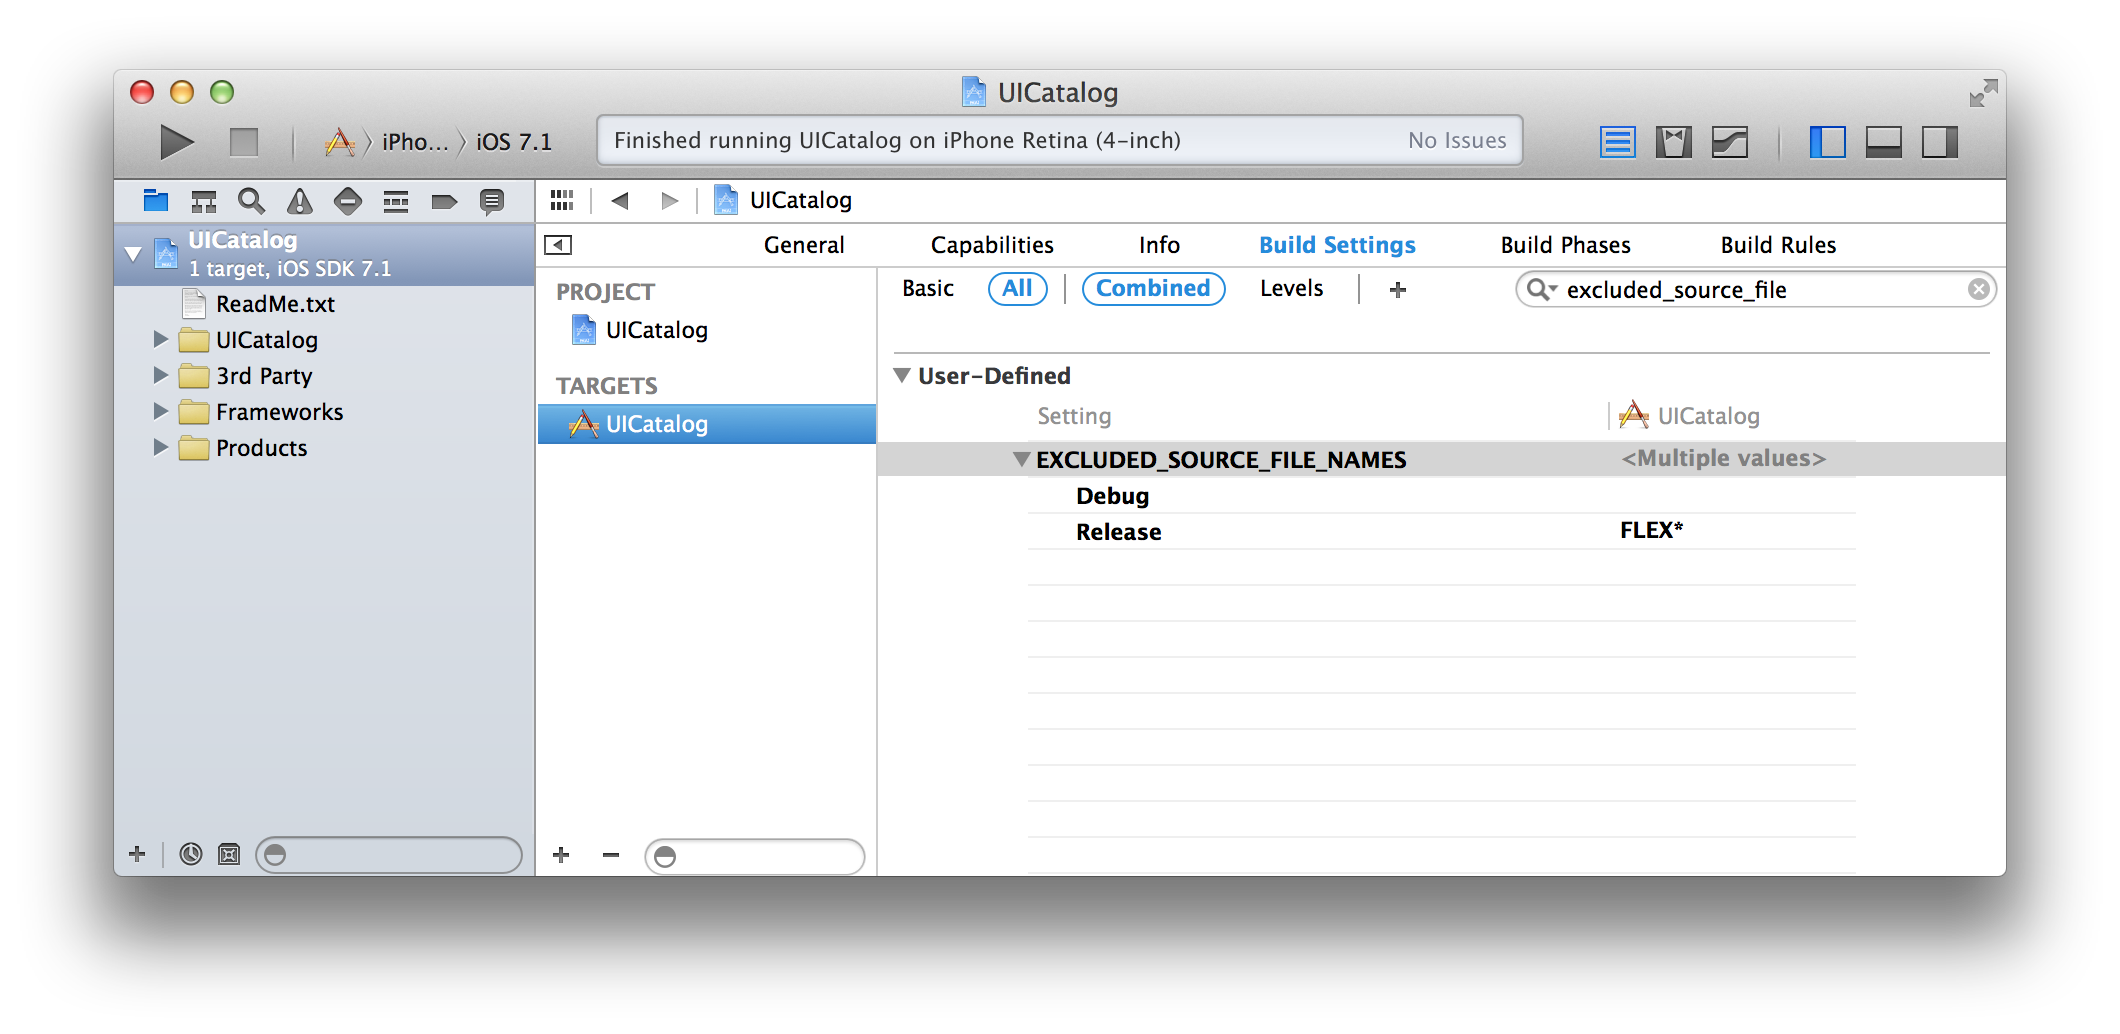
Name the setting EXCLUDED_SOURCE_FILE_NAMES. For your Release configuration, set the value to FLEX*. This will exclude all files with the prefix FLEX from compilation. Leave the value blank for your Debug configuration.
At the places in your code where you integrate FLEX, do a #if DEBUG check to ensure the tool is only accessible in your Debug builds and to avoid errors in your Release builds. For more help with integrating FLEX, see the example project.
- When setting fields of type
idor values inNSUserDefaults, FLEX attempts to parse the input string asJSON. This allows you to use a combination of strings, numbers, arrays, and dictionaries. If you want to set a string value, it must be wrapped in quotes. For ivars or properties that are explicitly typed asNSStrings, quotes are not required. - You may want to disable the exception breakpoint while using FLEX. Certain functions that FLEX uses throw exceptions when they get input they can't handle (i.e.
NSGetSizeAndAlignment()). FLEX catches these to avoid crashing, but your breakpoint will get hit if it is active.
FLEX builds on ideas and inspiration from open source tools that came before it. The following resources have been particularly helpful:
- DCIntrospect: view hierarchy debugging for the iOS simulator.
- PonyDebugger: network, core data, and view hierarchy debugging using the Chrome Developer Tools interface.
- Mike Ash: well written, informative blog posts on all things obj-c and more. The links below were very useful for this project:
- MAObjCRuntime
- Let's Build Key Value Coding
- ARM64 and You
- RHObjectiveBeagle: a tool for scanning the heap for live objects. It should be noted that the source code of RHObjectiveBeagle was not consulted due to licensing concerns.
- heap_find.cpp: an example of enumerating malloc blocks for finding objects on the heap.
- Gist from @samdmarshall: another example of enumerating malloc blocks.
- Non-pointer isa: an explanation of changes to the isa field on iOS for ARM64 and mention of the useful
objc_debug_isa_class_maskvariable.
- Swift runtime introspection (swift classes, swift objects on the heap, etc.)
- Network request logging
- Search bar filtering and sorting by file size in the file browser
- Improved file type detection and display in the file browser
- Add new NSUserDefault key/value pairs on the fly
Have a question or suggestion for FLEX? Contact @ryanolsonk on twitter.
