This Enterprise Class Check Plugin Collection offers a package of more than 180 Python-based, Nagios-compatible check plugins for Icinga, Naemon, Nagios, OP5, Shinken, Sensu and other monitoring applications. Each plugin is a stand-alone command line tool that provides a specific type of check. Typically, your monitoring software will run these check plugins to determine the current status of hosts and services on your network.
The check plugins run on
- Linux - Tested on RHEL 7+, Fedora 30+, Ubuntu Server 16+, Debian 9+, SLES 15+
- Windows - Tested on Windows 10+ and Windows Server 2019+
All plugins are written in Python and licensed under the UNLICENSE, which is a license with no conditions whatsoever that dedicates works to the public domain.
The plugins are fast, reliable and use as few system resources as possible. They uniformly and consistently report the same metrics briefly and precisely on all platforms (for example, always "used" instead of a mixture of "used" and "free"). Automatic detection and Auto-Discovery mechanisms are built-in where possible. Using meaningful default settings, the plugins trigger WARNs and CRITs only where absolutely necessary. In addition they provide information for troubleshooting. We try to avoid dependencies on 3rd party system libraries where possible.
The source code is published here without support.
If you need Enterprise Support, conclude a Service Contract.
If you simply like to support our work, please consider donating and become a sponsor:
Do you think more people should know about it? Sharing is caring, so feel free to spread the word. We would really appreciate if you share this on any social media, or link this site on any blog or forum.
- Have a look at the INSTALL document for the various options, including SELinux etc.
- For details on installing the plugins in Icinga Director, see ICINGA.
For now, there are two ways:
- Submit an issue (preferred).
- Contact us by email or web form and describe your problem.
You can download all check plugin icons from download.linuxfabrik.ch. For Icinga, put them in /usr/share/icingaweb2/public/img/icons/.
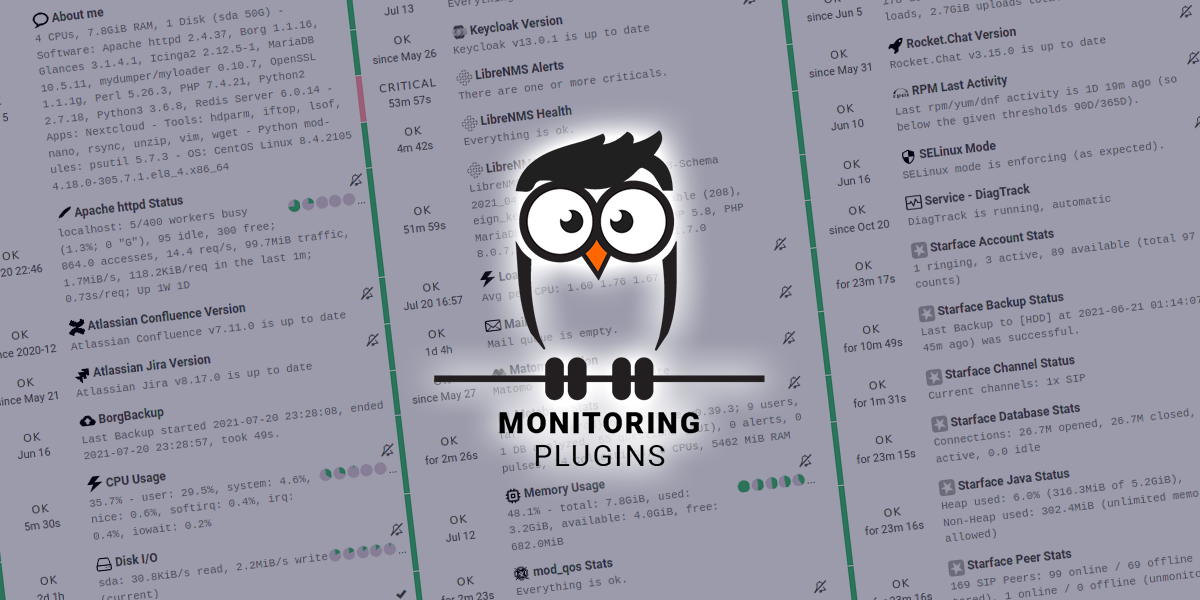
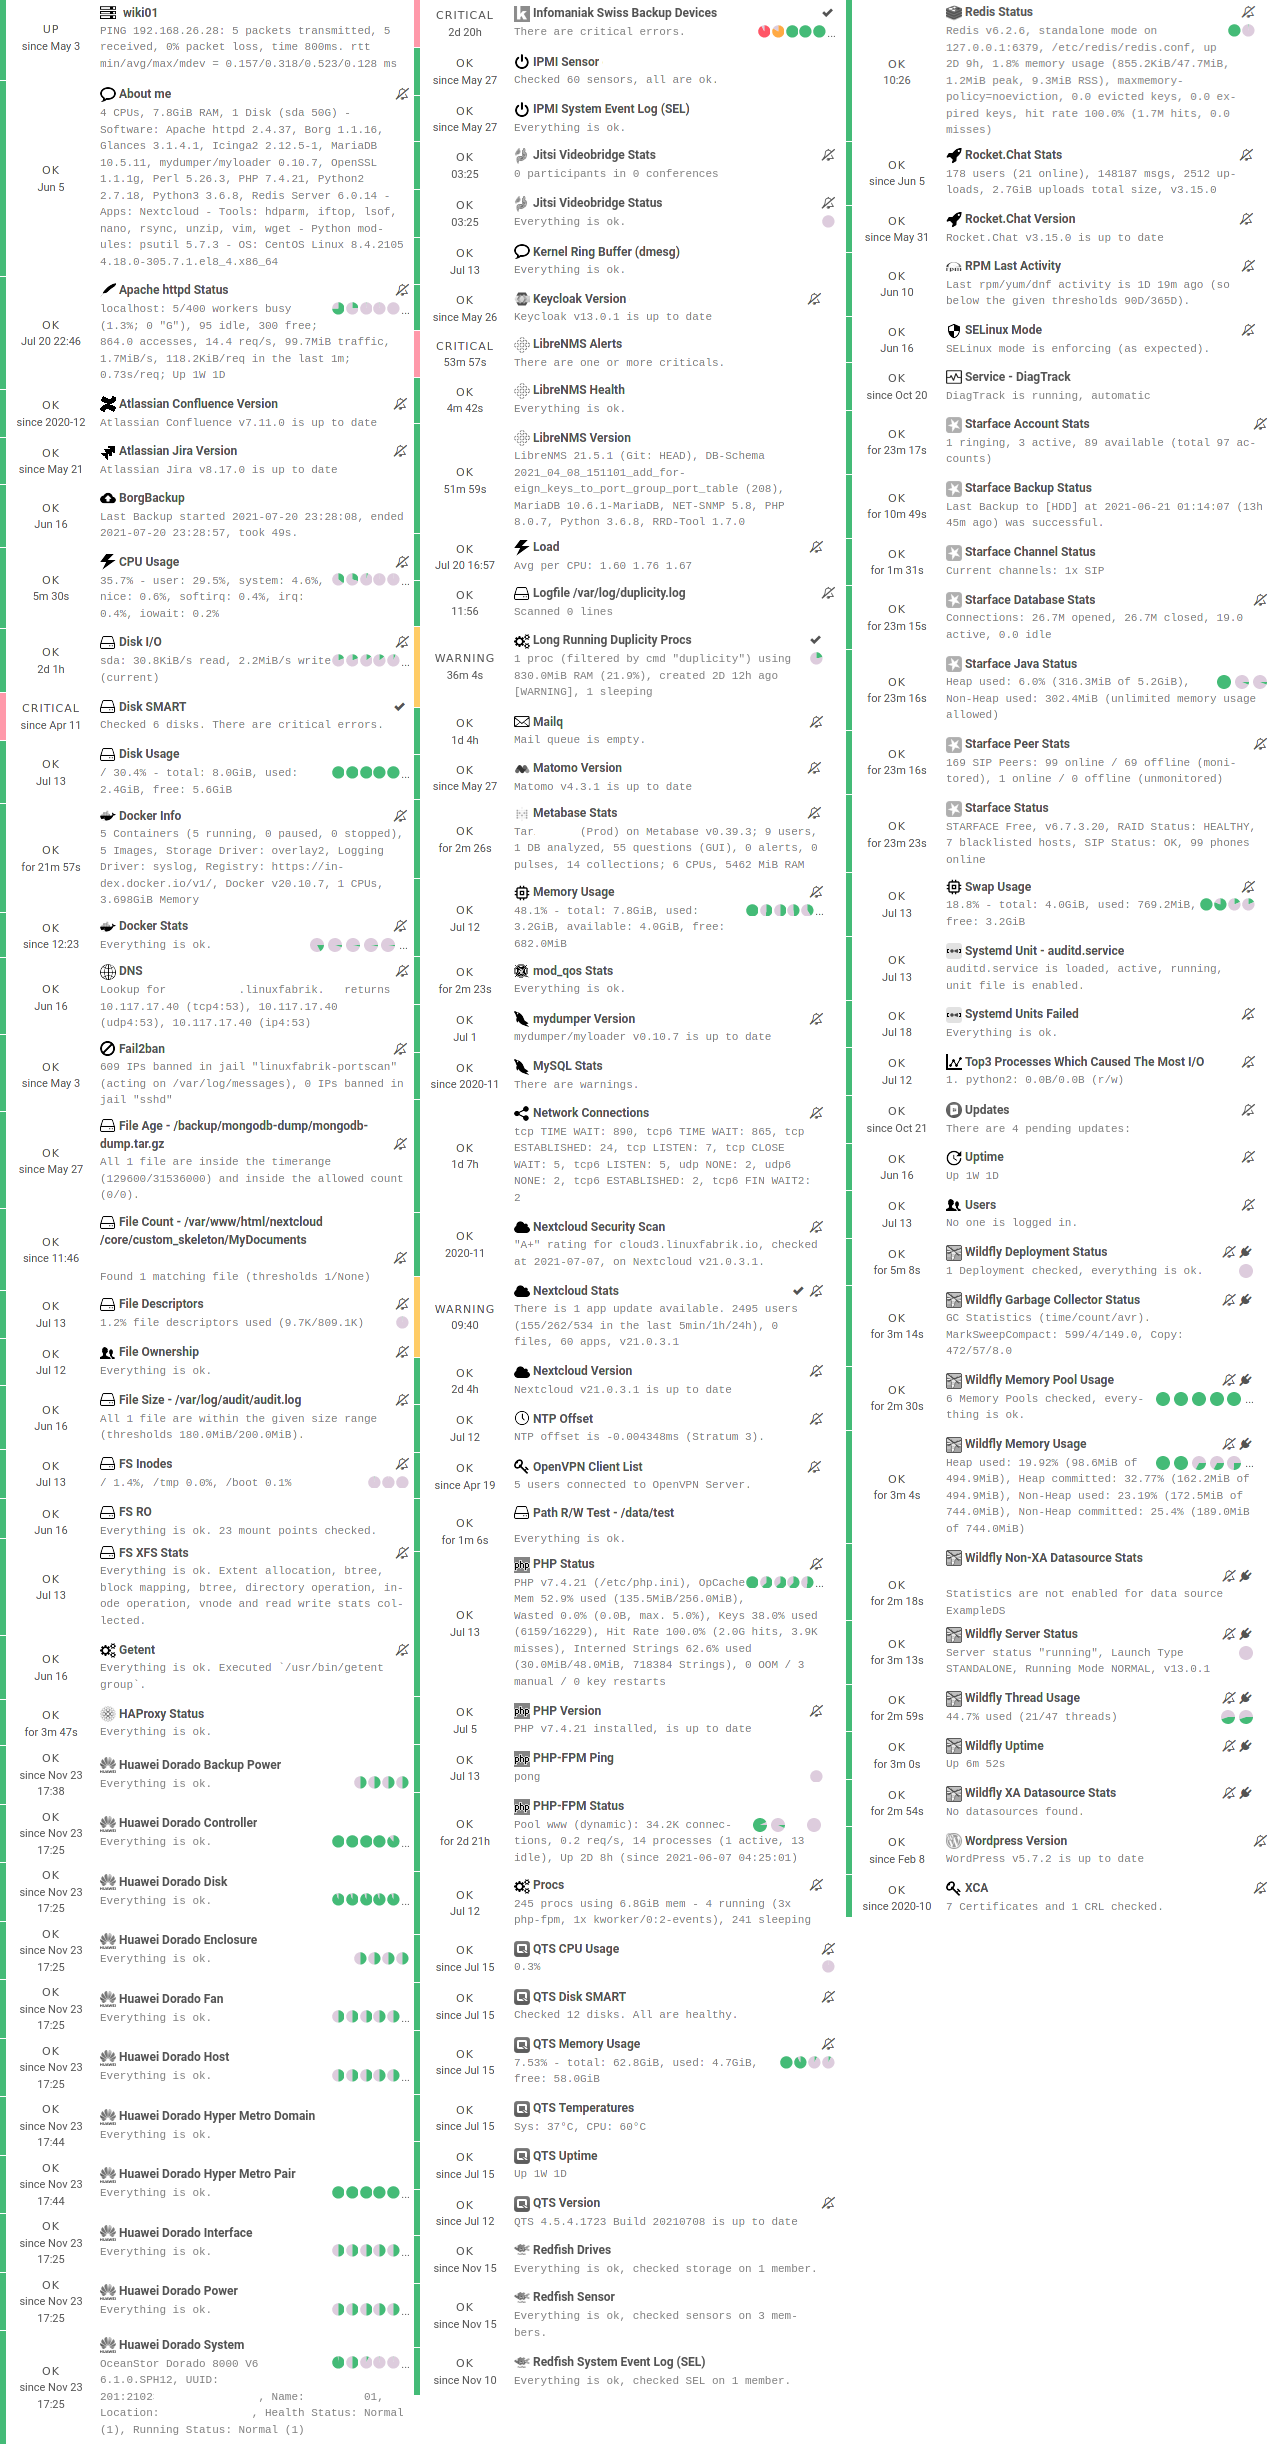
See some of our check plugins at a glance on an Icinga server:
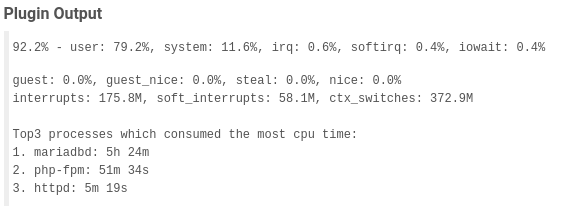
If you zoom in, for example on CPU Usage:
Some comments from the community about our monitoring plugins:
... thanks for your awesome plugins.
... Thanks for your awesome work & have a good day.
-- \Barney
... I can recommend this family of plugins, they are the highest quality I have seen around. ...
Ich bin vor kurzem (via Video vom Icinga Camp) über Eure Monitoringplugins gestolpert. Ganz herzlichen Dank dafür, großartige Arbeit!!
-- Christian Lox
... many thanks for your great collection of monitoring plugins! I've just found them - clean structure and output, cross-platform, Icinga Directory Basket configurations - loving it and currently migrating step by step most of my checks to use them where possible. 😍
-- Bernd Bestel
Nachdem ich beim Versuch, Nagios-Plugins auf VMwares Photon-OS zum laufen zu kriegen, graue Haare gekriegt habe, haben mir eure Plugins zum Ziel verholfen.
-- MajorTwip
A well engineered, regularly updated and maintained collection of plugins. Specially focused on Linux servers/VMs and used at large scale by the company developing it.
-- straessler
Hello, I stumbled across your collection and am thrilled! Especially the extensive documentary and the Director Baskets are a dream.
-- Stefan Beining
The "Linuxfabrik Monitoring Plugins" on a card of our popular Open Source Quartet 2023. 🙂 Click here if you want to get one to play (20 CHF). For more info, here's the story.
Regarding the check plugin output, this is how we convert and append symbols to large numbers in a human-readable format (according to Wikipedia Names of large numbers, and other).
Since the primary hosting platform is Linux, which uses IEC, the plugins display byte sizes in powers of 2 (KiB, MiB, GiB etc.) - otherwise it would be very confusing to have the monitoring plugins said something different than the command line.
| Value | Symbol | Origin | Type | Description |
|---|---|---|---|---|
| 1000^1 | K | Number | Thousand | |
| 1000^2 | M | SI Symbol | Number | Million (1), Million (2) |
| 1000^3 | G | SI Symbol | Number | Milliard (1), Billion (2) |
| 1000^4 | T | SI Symbol | Number | Billion (1), Trillion (2) |
| 1000^5 | P | SI Symbol | Number | Billiard (1), Quadrillion (2) |
| 1000^6 | E | SI Symbol | Number | Trillion (1), Quintillion (2) |
| 1000^7 | Z | SI Symbol | Number | Trilliard (1), Sextillion (2) |
| 1000^8 | Y | SI Symbol | Number | Quadrillion (1), Septillion (2) |
| 1024^0 | B | Bytes | Bytes | |
| 1024^1 | KiB | IEC unit | Bytes | Kibibytes |
| 1024^2 | MiB | IEC unit | Bytes | Mebibytes |
| 1024^3 | GiB | IEC unit | Bytes | Gibibytes |
| 1024^4 | TiB | IEC unit | Bytes | Tebibytes |
| 1024^5 | PiB | IEC unit | Bytes | Pebibytes |
| 1024^6 | EiB | IEC unit | Bytes | Exbibytes |
| 1024^7 | ZiB | IEC unit | Bytes | Zebibytes |
| 1024^8 | YiB | IEC unit | Bytes | Yobibytes |
| 1000^1 | KB | Bytes | Kilobytes | |
| 1000^2 | MB | Bytes | Megabytes | |
| 1000^3 | GB | Bytes | Gigabytes | |
| 1000^4 | TB | Bytes | Terrabytes | |
| 1000^5 | PB | Bytes | Petabytes | |
| 1000^6 | EB | Bytes | Exabytes | |
| 1000^7 | ZB | Bytes | Zetabytes | |
| 1000^8 | YB | Bytes | Yottabytes | |
| 1000^1 | Kbps | Bits per Second | Kilobits | |
| 1000^2 | Mbps | Bits per Second | Megabits | |
| 1000^3 | Gbps | Bits per Second | Gigabits | |
| 1000^4 | Tbps | Bits per Second | Terrabits | |
| 1000^5 | Pbps | Bits per Second | Petabits | |
| 1000^6 | Ebps | Bits per Second | Exabits | |
| 1000^7 | Zbps | Bits per Second | Zetabits | |
| 1000^8 | Ybps | Bits per Second | Yottabits | |
| 1e-12 | ps | Time | Picoseconds | |
| 1e-9 | ns | Time | Nanoseconds | |
| 1e-6 | us | Time | Microseconds | |
| 1e-3 | ms | Time | Milliseconds | |
| 1..59 | s | Time | Seconds | |
| 60 | m | Time | Minutes | |
| 60*60 | h | Time | Hours | |
| 60*60*24 | D | Time | Days | |
| 60*60*24*7 | W | Time | Weeks | |
| 60*60*24*30 | M | Time | Months | |
| 60*60*24*365 | Y | Time | Years |
- (1): Traditional European (Peletier, long scale)
- (2): US, Canada and modern British (short scale)
If a check supports ranges, they can be used as follows:
- Simple value: A range from 0 up to and including the value
- A "Range" is the same as on nagios-plugins.org: ... defined as a start and end point (inclusive) on a numeric scale (possibly negative or positive infinity)., in the format
start:end - Empty value after
:: positive infinity ~: negative infinity@: if range starts with@, then alert if inside this range (including endpoints)
Examples:
| -w, -c | OK if result is | WARN/CRIT if |
|---|---|---|
| 10 | in (0..10) | not in (0..10) |
| -10 | in (-10..0) | not in (-10..0) |
| 10: | in (10..inf) | not in (10..inf) |
| : | in (0..inf) | not in (0..inf) |
| ~:10 | in (-inf..10) | not in (-inf..10) |
| 10:20 | in (10..20) | not in (10..20) |
| @10:20 | not in (10..20) | in 10..20 |
| @~:20 | not in (-inf..20) | in (-inf..20) |
| @ | not in (0..inf) | in (0..inf) |
Shell commands like ./file-age --filename='/tmp/*' have two basic parts:
- Command name of the program to run (
./file-age). May be followed by one or more options, which adjust the behavior of the command or what it will do. - Options/Parameters normally start with one or two dashes to distinguish them from arguments (parameter
--filename, value'/tmp/*'). They adjust the behavior of the command. Parameters may be short (-w) or long (--warning). We prefer and often offer only the long version.
Many shell commands may also be followed by one or more arguments, which often indicate a target that the command should operate upon (useradd linus for example) . This does not apply to the check-plugins.
To avoid problems when passing parameter values that start with a -, the command line call must look like this:
- Long parameters:
./file-age --warning=-60:3600(use--param=valueinstead of--param value). - Short parameters:
./file-age -w-60:3600(so simply not putting any space nor escaping it in any special way).
All check plugins are available for Python 3.6+, and most of them also for Python 2.7. The Python 2 check plugins have the suffix "2" (for example cpu-usage2), the Python 3 plugins have the suffix "3" (for example cpu-usage3).
The Python 3-based check plugins use #!/usr/bin/env python3, while the Python 2-based check plugins use #!/usr/bin/env python2 explicitly.
We stopped maintaining the Python 2-based plugins on 2021-12-31.
See GRAFANA
See CONTRIBUTING
See BUILD
- Q: How can I remove the performance data after the
|?
A: In Bash:/usr/lib64/nagios/plugins/check-command | cut -f1 -d'|'


